INTRODUCTION
Climate change has led to more extreme weather conditions globally in the last few decades and the resulting altered ambient temperature regimes may modify key processes in host–parasite systems. Such changes may affect the frequency of epidemics and impose more subtle changes to disease outcomes. Good evidence now exists for a relationship between climate change and the recent increase of disease emergence in both animal and human populations (Daszak et al. Reference Daszak, Cunningham and Hyatt2000; Marcos-Lopez et al. Reference Marcos-Lopez, Gale, Oidtmann and Peeler2010; Gallana et al. Reference Gallana, Ryser-Degiorgis, Wahli and Segner2013). Diseases in freshwater ecosystems appear to be particularly sensitive to climate change (Marcos-Lopez et al. Reference Marcos-Lopez, Gale, Oidtmann and Peeler2010; Paull and Johnson, Reference Paull and Johnson2011; Adlard et al. Reference Adlard, Miller and Smit2015). The sensitivity of freshwater ecosystems is further compounded by the presence of multiple stressors (Perry et al. Reference Perry, Low, Ellis and Reynolds2005), and their cumulative impacts can alter the interactions in host–pathogen systems through diverse mechanisms (Johnson et al. Reference Johnson, Acreman, Dunbar, Feist, Giacomello, Gozlan, Hinsley, Ibbotson, Jarvie, Jones, Longshaw, Maberly, Marsh, Neal, Newman, Nunn, Pickup, Reynard, Sullivan, Sumpter and Williams2009; Segner et al. Reference Segner, Wahli and Burkhardt-Holm2012; Fey et al. Reference Fey, Siepielski, Nussle, Cervantes-Yoshida, Hwan, Huber, Fey, Catenazzi and Carlson2015).
One of the major interactions of temperature and disease relates to the activity of the immune response when hosts are confronted with an infection (Fischer et al. Reference Fischer, Ototake and Nakanishi1999; Kollner and Kotterba, Reference Kollner and Kotterba2002; Bowden, Reference Bowden2008; Cheng et al. Reference Cheng, Cheng, Chen and Chen2009; Jokinen et al. Reference Jokinen, Salo, Markkula, Rikalainen, Arts and Browman2011). In many poikilothermic animals, the strength of immune response is positively correlated with temperature (Bowden, Reference Bowden2008), and thus even small changes in ambient temperatures can lead to significantly increased investment in immune function when infected (Kollner and Kotterba, Reference Kollner and Kotterba2002; Bailey et al. Reference Bailey, Segner, Casanova-Nakayama and Wahli2017).
Temperature may also directly impact the rate of parasite proliferation and development (Noe and Dickerson, Reference Noe and Dickerson1995; Karvonen et al. Reference Karvonen, Rintamaki, Jokela and Valtonen2010). Bettge et al. (Reference Bettge, Segner, Burki, Schmidt-Posthaus and Wahli2009a ) showed an effect of temperature on the development time of proliferative kidney disease (PKD), however, increasing temperature had minor influence on the final parasite intensity in T. bryosalmonae-infected fish, suggesting the presence of a maximum limit for parasite proliferation and accumulation in the kidney. Despite such insights to parasite development within the host, it is not clear how the parasite development in the kidney relates to infective spore release and whether temperature influences the infective period. A general pattern of many myxozoan triggered fish diseases is an increase in pathology and mortality as temperatures increase (Baldwin et al. Reference Baldwin, Vincent, Silflow and Stanek2000; Okamura et al. Reference Okamura, Hartikainen, Schmidt-Posthaus and Wahli2011; Ray et al. Reference Ray, Holt and Bartholomew2012). Previous myxozoan studies have highlighted how such patterns may arise partly through temperature-linked effects on the transmission potential and the release of infective spores from the invertebrate host, potentially increasing the dose and infectivity of water borne actinomyxon stages (Morris et al. Reference Morris, Ferguson and Adams2005; Ray et al. Reference Ray, Holt and Bartholomew2012). Although it is difficult to predict how the relative strengths of temperature dependence in transmission dynamics across the complex life cycle of myxozoan parasites in general act to generate epidemics, it is clear that changing ecological and/or environmental conditions can directly alter the severity of disease and the transmission potential in a temperature-dependent manner.
The present study investigates how temperature influences parasite dynamics in brown trout challenged with local parasite strains and estimates the temperature-dependent shedding of parasite by the trout, translating into the transmission potential of the parasite from the vertebrate to the invertebrate host. The parasite, Tetracapsuloides bryosalmonae (Malacospora, Cnidaria) (Lom and Dykova, Reference Lom and Dykova2006), causes PKD in brown trout. The parasite life cycle includes fish as vertebrate hosts and bryozoans as invertebrate hosts, most commonly Fredericella sultana (Feist et al. Reference Feist, Longshaw, Canning and Okamura2001; Morris and Adams, Reference Morris and Adams2006). Infected bryozoans release spores infective to fish. The parasite develops in the kidney, producing spores which are released via urine. These spores are infective to bryozoans (Tops et al. Reference Tops, Baxa, McDowell, Hedrick and Okamura2004) but not to fish. The most common native host for T. bryosalmonae in Europe is the brown trout, yet almost all laboratory studies to date have been performed with rainbow trout (Okamura et al. Reference Okamura, Hartikainen, Schmidt-Posthaus and Wahli2011). Overall these studies show that at low water temperatures (8–15 °C) the parasitic infection appears to be associated with low or zero mortality and with little pathology (Bettge et al. Reference Bettge, Segner, Burki, Schmidt-Posthaus and Wahli2009a , Reference Bettge, Wahli, Segner and Schmidt-Posthaus b ; Dash and Vasemagi, Reference Dash and Vasemagi2014), while at temperatures above 15 °C PKD-associated severity of renal pathology is enhanced and mortality may rise to over 80% (Bettge et al. Reference Bettge, Segner, Burki, Schmidt-Posthaus and Wahli2009a ; Schmidt-Posthaus et al. Reference Schmidt-Posthaus, Bettge, Forster, Segner and Wahli2012; Bruneaux et al. Reference Bruneaux, Visse, Gross, Pukk, Saks and Vasemägi2017).
In order to minimize parasite-induced mortalities during the course of the infection and to allow assessment of initial infection success in the absence of major PKD symptoms, we chose moderate parasite spore doses and environmentally realistic temperature treatments (12 and 15 °C) where renal pathology is predicted to remain mild. We hypothesized that in this host–parasite system, temperature should modify parasite infection intensity and spore release through direct effects on growth and proliferation. Thus, we expected that: (1) temperature increases the rate of parasite proliferation; (2) inferred transmission stage production increases with temperature; and (3) initial infection success is positively associated with temperature. The first two predictions are derived from positive association of increased temperature and parasite growth kinetics. Whereas the third prediction is based on the expectation that temperature increases fish contact rate with the infective spores due to reduced water viscosity and increased gill ventilation activity. To test these hypotheses we used a novel experimental approach in which the fish were exposed to the same dose of infective parasite spores at two water temperatures: 12 and 15 °C. As a proxy to assess infection success we measured infection prevalence of the fish, as proxy for infection intensity we measured the concentration of parasite DNA copies in the fish kidney, and parasite spore shedding was assessed by determining the appearance of measurable parasite DNA copies in the tank water. With this experimental approach, the present study is the first to comprehensively test the effects of temperature on T. bryosalmonae kinetics in its natural host, the brown trout (Freyhof, Reference Freyhof2013). Furthermore, the study quantifies how infection intensity is related to the parasite fitness through transmission stage production.
MATERIALS AND METHODS
Fish maintenance
Brown trout (n = 1350) weighing on average 3·0 ± 0·7 g were obtained from a hatchery with no history of PKD in Southern Switzerland (Pescicoltura di Maggia, Maggia, Switzerland). Fish were transported and acclimatized in the aquarium facility at the Centre for Fish and Wildlife Health (FIWI), University of Bern, Bern, Switzerland. Ten fish were tested for the presence of parasites by direct microscopical examination of wet mounted skin, gills and intestinal content; and for the presence of bacteria by culture on blood agar plates (Biomerieux, Switzerland), on bromthymolblue-lactose-agar plates (Merck, Germany) supplemented with 0·5% sucrose for 48 h, and on special agar plates to favour growth of flavobacteria (Anacker and Ordal, Reference Anacker and Ordal1959) for 5 days. Viral screening was performed by the standardized cell culture methods (two-times 1-week incubation on BF-2 and EPC cell lines, respectively). Additionally, DNA from half of the kidney per fish was extracted and investigated for presence of T. bryosalmonae DNA (see the subsection ‘DNA extraction and qPCR for Parasite DNA quantification’). No infectious agents were found. The remaining 1340 brown trout were split into two groups (n = 670 each). One group was acclimatized to 12 °C, the other one to 15 °C, over a period of 2 weeks. After acclimatization, the final experimental setup included: three tanks at 12 °C and three at 15 °C. Two of the three tanks per temperature contained 300 fish each and served as infection replicates, while the third tank was stocked with 70 fish, which served as uninfected controls (online Supplementary Fig. S1).
All experiments were run in flow through glass tanks with a volume of 130 L supplied with tap water (2 L min−1) and constant aeration. Mortalities were recorded daily, and fish dying between the sampling days were necropsied and investigated for the presence of parasites or other infectious agents.
Approval for animal experiments was obtained from the Cantonal Veterinary Office (Bern, Switzerland) (Authorization BE60/14).
Parasite exposure
Bryozoans infected with T. bryosalmonae (overt infection confirmed via dissection) were collected from four Swiss rivers on June 25th 2014 and disrupted to release infective spores by dissection of the bryozoan zooids under a binocular and by gentle grinding bryozoan tissue using a pestle and mortar. The sites were known to harbour T. bryosalmonae infections in the bryozoan populations and the brown trout populations have shown PKD-positive animals in all previous electrofishing samplings (data not shown). The sites encompassed the rivers Fürtbach (47°26′51″N, 8°22′35″E), Surb (47°31′58″N, 8°17′51″E), Alte Aare (47°06′40″N, 7°19′01″E) and Lyssbach (47°02′59″N, 7°21′18″E). The disrupted tissues from all sites were pooled and suspended in 6 L of tap water to form a homogenous infection solution. Before infection, water flow in all tanks was stopped and water level reduced to 30 L, while aeration was intensified. The 6 L containing released parasite spores and disrupted bryozoan tissue were thoroughly mixed and distributed equally to the four exposure tanks. Water flow was reactivated after 1 h. The same procedure was applied to controls without any addition of infection solution.
To further check that the infective dose between the tanks was similar, water samples (2 × 100 mL) were taken from each tank 20 min after addition of the infection solution. The water samples were filtered using a 0·25 µm nitrocellulose filter (Merck-Millipore, Switzerland) and papers were stored in 1·5 mL Eppendorf tubes at −20 °C. The parasite DNA concentration was determined by DNA extraction from the filter papers and subsequent real-time quantitative PCR (qPCR) (see the subsection ‘DNA extraction and qPCR for parasite DNA quantification’).
Fish sampling
Sampling for detection of the parasite in the kidney was carried out daily during the first 7 days post-exposure (dpe) (number of fish: n = 10 for 1, 2 dpe; n = 5 for 3, 4, 5, 6 and 7 dpe). Then, samples were taken at: 10, 15, 20, 25 and 30 dpe (n = 10 for 10, 20 dpe, and n = 5 for 15, 25 dpe), and thereafter 10 fish were analysed every 10 days until 80 dpe and afterwards monthly until 200 dpe. A final sampling of all remaining fish was performed at 320 dpe (Table 1). From the two control groups, five fish were screened after 2 weeks, and then monthly as described above to check for the presence of pathogens.
Table 1. Summary of the number of fish sampled per day for the detection of the parasite in the kidney [Replicate 1 (R1) and Replicate 2 (R2) at 12 and 15 °C] and for the health control (Control at 12 and 15 °C)

Sampled fish were euthanized using 3-aminobenzoic acid ethyl ester (MS 222®, Argent Chemical Laboratories). Length (L) and weight (W) were recorded and the body condition index was calculated (W × L −3 × 100), the kidney was removed, weighed (KW) and prepared for DNA extraction. The kidney somatic index (KW/W × 100) was calculated.
DNA extraction and qPCR for parasite DNA quantification
All extractions were carried out using the Blood & Tissue DNA extraction kit (QIAGEN, Switzerland) following manufacturer instructions. Before extraction, kidneys were homogenized in a 1·5 mL tube with a 2 mm diameter steel bead (QIAGEN, Switzerland) using a tissue lyser (QIAGEN, Switzerland) with the shaking frequency set at 30 shakes s−1 for 3 min. Filter papers from the water samples were cut into small pieces using sterilized scissors. DNA was eluted with 100 µL EB buffer and stored at −20 °C.
qPCR was carried out using the T. bryosalmonae-specific TaqMan method according toBettge et al. (Reference Bettge, Wahli, Segner and Schmidt-Posthaus2009b ). Briefly, each reaction was carried out in a final volume of 20 µL containing 1× TaqMan universal Master Mix (Applied Biosystems, Switzerland), 0·5 µ m of each primer (PKDtaqf1: 5′–GCGAGATTTGTTGCATTTAAAAAG– 3′ and PKDtaqr1: 5′ –GCACATGCAGTGTCCAATCG– 3′), 0·2 µ m of the probe PKD (5′–CAAAATTGTGGAACCGTCCGACTACGA–3′) labelled with FAM-TAMRA, 1× of internal control Exo IPC Mix, 1× of IC DNA (TaqMan University MMix w Exog IntPostC, Applied Biosystems) and 2 µL of template DNA. All reactions were carried out in duplicate. A standard curve was generated for each run [using five dilutions from 106 down to 102 gene copy numbers of linearized plasmid containing the amplified fragment (Bettge et al. Reference Bettge, Segner, Burki, Schmidt-Posthaus and Wahli2009a )]. The regression coefficient of the standard curve had to be between −3·6 and −3·0, and the coefficient of variation between duplicates below 25% (Mackay, Reference Mackay2004; Joly et al. Reference Joly, Falconnet, Andre, Weill, Reyrolle, Vandenesch, Maurin, Etienne and Jarraud2006; Yun et al. Reference Yun, Heisler, Hwang, Wilkins, Lau, Hyrcza, Jayabalasingham, Jin, McLaurin, Tsao and Der2006; Hellemans et al. Reference Hellemans, Mortier, De Paepe, Speleman and Vandesompele2007). If these criteria were not met, the sample was tested again. Non-target controls (water) within the qPCR never showed any amplification, while the internal control was always amplified showing no qPCR inhibition.
Presence and intensity of the parasite (DNA copy number) was determined using qPCR on DNA extracted of the entire kidney. Prevalence was calculated per each sampling date, while parasite intensity was taken for each individual and standardized to kidney weight.
To confirm that T. bryosalmonae was the only malacosporean parasite present in the infected brown trout, we performed PCR and sequencing from selected brown trout kidneys using malacosporean-wide primers (Grabner and El-Matbouli, Reference Grabner and El-Matbouli2010). PCR products were purified using the NucleoSpinH ExtractII (Macherey-Nagel, Germany) and Sanger Sequencing was carried out by Microsynth (Mycrosynth, Switzerland). Sequences showed only one trace (1612 bp) and when blasted against GenBank database (https://blast.ncbi.nlm.nih.gov/) showed 100% similarity to published T. bryosalmonae sequences. This strongly suggests that T. bryosalmonae was the prevalent (and likely only) malacosporean present in the infective dose.
Inferred spore production post-infection
In order to evaluate when infected fish started releasing parasites post exposure, water samples were collected from the tanks during the course of the experiment and analysed for the presence of parasite DNA. We used the concentration of parasite DNA (number of copies of the SSU rDNA gene) in the tank water as a proxy to estimate the presence and the relative quantity of parasite transmission stages. Two 1 L water samples from each tank were filtered using a 3·0 µm nitrocellulose filter (Merck-Millipore, Switzerland). Samples were taken weekly starting at 55 dpe until 120 dpe, and afterwards every 2 weeks until 200 dpe, then at 250 and 300 dpe. Each filter was stored at −20 °C until further processed for DNA extraction and the qPCR.
Statistical analysis
When data were highly skewed we used non-parametrical tests. Raw data on parasite proliferation, intensity and shedding were log transformed to meet normality in residuals.
Cumulative counts of mortality over the testing period were compared between temperature groups using the Fisher's exact test. Non-parametric Kruskal–Wallis and Wilcoxon tests were used to test group differences in Body condition index (W × L −3 × 100), and the kidney somatic index (KW/W × 100). In these data, we only analysed data points where comparison with the control groups was possible, thus at 15, 30, 50, 100, 130 and 160 dpe. Prevalence changes between stable phase and the last sampling were analysed using a binomial distribution while differences between temperature groups in the final sampling at 320 dpe was analysed by a chi-square (χ 2) test.
Parametric statistics was applied to test changes over the testing phase in parasite proliferation, intensity and shedding (parasite DNA in the water of the tanks).
In line with previous studies in rainbow trout, we expected parasite proliferation in the kidney to follow a typical pattern: first an increasing phase, followed by a plateau and a subsequent decline in parasite numbers (Bettge et al. Reference Bettge, Segner, Burki, Schmidt-Posthaus and Wahli2009a ). These three possible phases were identified by inspection of graphs and analysed separately. Prevalence was analysed using the General Linear Mixed Model (GLMM) using a binomial transformation (link function = probit), with ‘tank’ as random effect and day and temperature as fixed effects.
Parasite intensity in the kidney (DNA copy number/g of kidney) was calculated as the average parasite quantification (over the duplicate qPCR reactions) in the DNA elution, divided by the extracted kidney weight in grams (g). Parasite intensity in the kidney and the concentration of parasite DNA in the water (DNA copy number per L water) were log-transformed to meet normality criteria and analysed using a Linear Mixed Model (lmer) with ‘tank’ as random effect while time and temperature as fixed effects (Bates et al. Reference Bates, Machler, Bolker and Walker2015). Parasite intensity (log transformed) at 320 dpe was analysed separately by a two-sided t-test.
In both prevalence and infection intensity analyses, interactions between variables were excluded from the final model when not statistically significant. All statistical analyses were performed using R (version 3·1·0) (de Micheaux et al. Reference de Micheaux, Drouilhet and Liquet2013; R Core Team, 2014).
RESULTS
Parasite exposure concentrations
All samples collected from water tanks during the initial fish exposure displayed homogenous parasite DNA at a concentration of 9 × 10⁵ ± 10% copies L−1.
Mortality
From the beginning to the end of the experiment (320 dpe), cumulative mortality in the 12 °C control group was 1%, while it was 2·3% (±0·3% s.d.) in the T. bryosalmonae-exposed fish at 12 °C. For the 15 °C groups, cumulative mortality in the control group was 5 and 3·5% (±1·5% s.d.) in the infected replicates. There were no significant differences between the respective control groups at 12 and 15 °C (P = 0·06), nor between the controls and the infected groups (P = 0·5).
Condition index
The condition index varied between 0·83 and 1·23 throughout the experiment, which falls in the normal values indicated for brown trout in FishBase (Froese and Pauly, Reference Froese and Pauly2016). There was neither a significant difference of the condition index between either controls or PKD infected fish kept at 12 or 15 °C, (control: Kruskal–Wallis χ 2 = 1·62, P = 0·2; PKD infected: Kruskal–Wallis χ2 1·61, P = 0·2), nor between control and infected groups (Kruskal–Wallis χ 2 = 3·56, P = 0·3).
Kidney somatic index
Kidney somatic index values showed no significant difference between temperature groups in the controls (W = 1709·5, P = 0·24) nor in the infected fish (W = 1664, P = 0·9). However, the infected fish had a higher kidney somatic index (W = 4122·5, P < 0·001) than the controls. Average (±s.d.) values of the kidney somatic index for control brown trout at 12 °C were 0·6 ± 0·15 and at 15 °C 0·56 ± 0·18, while for infected brown trout the values were 0·71 ± 0·21 at 12 °C and 0·71 ± 0·33 at 15 °C.
Infection prevalence
At 1, 2, 3, 4 and 5 dpe, no parasite DNA was detectable by means of qPCR in the kidneys of parasite-exposed fish.
At 7 dpe, when parasite DNA was detected for the first time in the 15 °C group, the prevalence was 20%. The prevalence value increased afterwards to a maximum of 80% at 50 dpe for this group. In the 12 °C group, the prevalence at 15 dpe was 30%, then increased to a maximum of 70% at 80 dpe (Fig. 1, GLMM: factor time: P < 0·001, z = 20·3). Until 80 dpe, the prevalence was significantly higher in the 15 °C than in the 12 °C group (Fig. 1, GLMM: factor temperature P < 0·001, z = 51). Afterwards, prevalence values levelled out at 56% in the 12 °C and at 59% in the 15 °C representing a ‘stable phase’. During this stable phase that spanned from 80 to 200 dpe, prevalence was not significantly different between temperature groups or sampling dates (Fig. 1, GLMM: factor temperature P = 0·66, factor time P = 0·52, respectively; z = 0·440 and −0·646). Finally, we checked for a decline in infection prevalence by analysing the prevalence at 320 dpe. For both temperatures, a decrease was found between the prevalence of the stable phase and the last sampling point (Fig. 1, binomial distribution: P < 0·001). The final prevalence was significantly higher at 15 °C than at 12 °C (χ2 = 10·03, P = 0·001), with 42% (±5% s.d.) and 26% (±7% s.d.), respectively.

Fig. 1. Prevalence per time-point (percentage ± s.d.) (n = 10 fish at time point 7, 15 and 25, while n = 20 fish per temperature every other point, all remaining fish were sampled at 320 dpe) and duration of the plateau phase for each temperature group. Asterisks shows significant model trend difference by temperature and by time (***P value < 0·001, N.S: not significant). A significant decrease was found between the prevalence of the stable phase and the last sampling point (***, P < 0·001). The final prevalence was significantly higher at 15 than 12 °C (P = 0·001).
Parasite DNA concentrations in the brown trout kidney
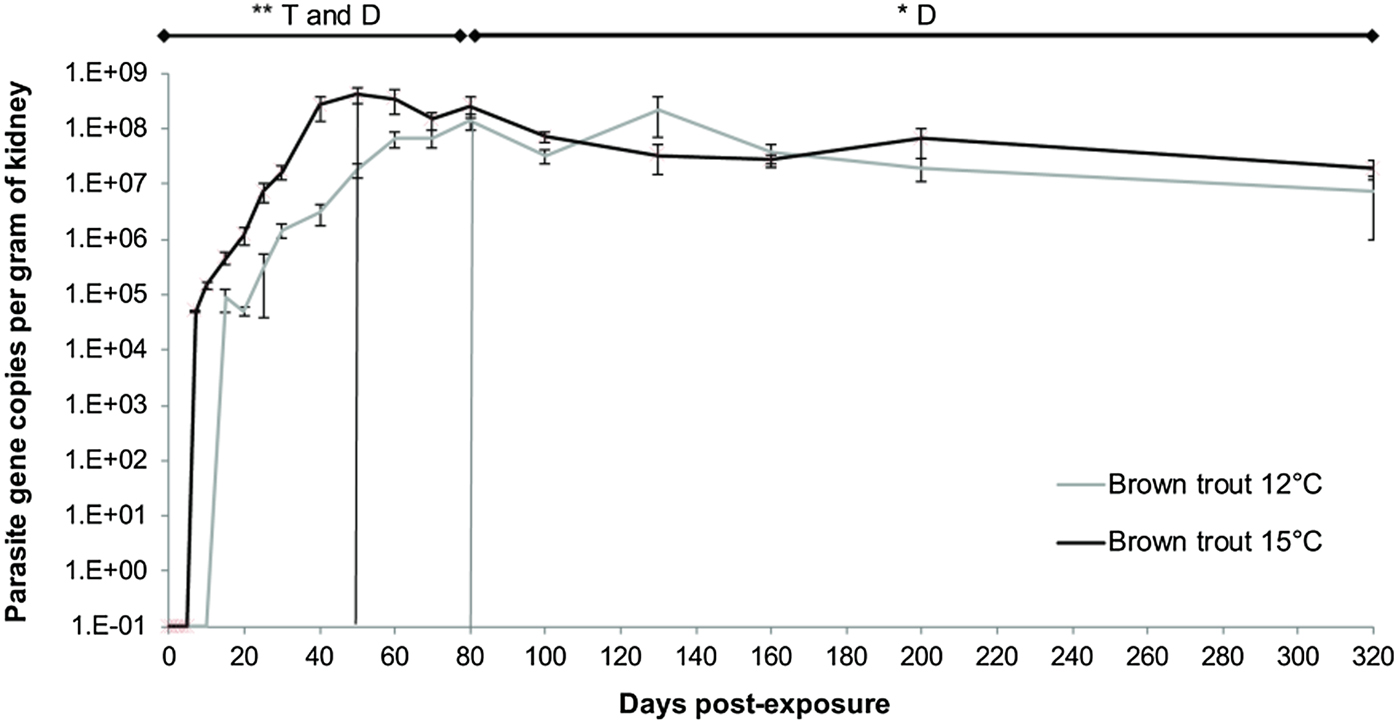
The concentration of parasite DNA per gram of kidney was used to estimate parasite intensity in the infected fish. Only T. bryosalmonae-positive fish were included. At both temperatures, parasite intensity increased rapidly in the days following exposure (Fig. 2, Linear mixed model, factor time F = 7·27, P = 0·008). The maximum level of parasite intensity was comparable between the two experimental temperatures, but was reached earlier in the 15 °C fish (at 50 dpe) than in the 12 °C fish (at 80 dpe) (Fig. 2, Linear mixed model, factor temperature F = 7·37, P = 0·007). The exponential rate of increase over time was twice as steep in trout kept at 15 °C (slope = 0·221, y = 17 026e 0·221x ; r 2 = 0·97) compared with those held at 12 °C (slope = 0·126, y = 146 114e 0·126x , r 2 = 0·93). After 80 dpe, the parasite intensity in the kidney in both temperature treatments showed a plateau phase (no significant difference in intensity between temperature treatments; Fig. 2, Linear mixed model, factor temperature F = 1·44, P = 0·30). The effect of sampling day during the plateau phase was significant (Fig. 2, Linear mixed model, factor time F = 5·50, P = 0·023), indicating that parasite intensity was decreasing over time (80–200 dpe).

Fig. 2. Intensity of Tetracapsuloides bryosalmonae infection in the kidney expressed as 18S rRNA gene copies per gram of kidney per day post exposure (each point correspond to the average of all infected fish per temperature ±s.e.). Bars indicate where the increasing phase is substituted by the plateau post-peak – declining phase at each temperature (15 °C group in black and 12 °C group in grey). Asterisks show significant model trend difference by both temperature and time or only by time (D). (**P value < 0·01, *P value < 0·05).
Finally, parasite intensity at the end of the experiment at 320 dpe was analysed separately. As found before for prevalence, parasite intensity was significantly lower in the 12 °C group than in the 15 °C group (Two-sample t-test: t = 2·61, P = 0·011).
Release of parasite DNA from infected fish into the water (shedding)
The beginning of release of parasite spores was inferred by the appearance of DNA in the tank water (first sampling date on 55 dpe). Temperature and infection intensity had a significant effect on the start of spore shedding (Fig. 3). In the water samples of the 15 °C tanks parasite DNA was found already at 55 dpe (Fig. 3). In the 12 °C group, parasite DNA was detected for the first time in the water sampled at 80 dpe (Fig. 3), indicating a delay in start of shedding of about 30 days between the 12 and 15 °C fish. Once started, fish of both groups shed almost identical amounts of DNA per sampling time-point, with no temperature effect (Fig. 3, Linear mixed model: factor temperature F = 2·89, P = 0·23). The effect of sampling day was significant (Fig. 3, Linear mixed model, factor time F = 45·57, P < 0·001), indicating that parasite DNA in water was decreasing over time (80–255 dpe). Although after 300 dpe parasite DNA at 12 °C could not be detected anymore using our method, bryozoan infections were still possible (data not shown) revealing the presence of infective spores.
Fig. 3. Tetracapsuloides bryosalmonae 18S rRNA gene copies per L of water ±s.e. per day post exposure (each point corresponds to the average of the two duplicates and the two replicates). Model shows significant trend differences by time. (P value < 0·001).
DISCUSSION
Temperature plays a key role in modifying the outcomes of interactions between hosts and parasites. Our results show how even a minor difference in water temperature (3 °C, from 12 to 15 °C) induced a large temporal shift in the initiation of parasite transmission stage production (by >1 month). Both 12 and 15 °C lay well within the natural temperature range of brown trout, yet a temperature increase of 3 °C would represent a broadly realistic, yet a very significant change under natural conditions.
The initiation of spore production crucially depended on the temperature mediated rate at which the parasite proliferated in the kidney to reach a plateau in infection intensity. At both temperatures, spore shedding was initiated once a common parasite infection intensity threshold in the kidney was reached. Temperature thus critically modified the rate at which this threshold was met and the parasite proliferation rate at 15 °C was almost double the rate at 12 °C. Interestingly our data suggest that the threshold, in terms of parasite intensity in the kidney, at which spore production commenced was independent of temperature. Further, once spore release had started, temperature played a minimal role and the transmission potential (measured as the parasite DNA-copy numbers in the tank water) was similar at both temperatures. This is the first time the infection intensity and parasite transmission potential have been explicitly linked in the case of PKD and hereby we provide a basis for improving population wide predictions of transmission scenarios from fish to the invertebrate host population. The spore shedding occurrence and magnitude was measured using a novel method involving water sampling and qPCR within the experimental aquaria. This provides a relative measurement informative on the temperature effects, but the actual transmission to the next host (bryozoans) would additionally depend on viability and infectivity of the released spores, the encounter rate with the next host and mean susceptibility of the receiving bryozoan population. Further, absolute quantification of the number of spores released would require additional calibration experiments involving known numbers of spores and dilution factors to quantify the recovery rate of parasite DNA using the extraction methods employed here.
Bettge et al. (Reference Bettge, Segner, Burki, Schmidt-Posthaus and Wahli2009a ) measured the infection intensity of T. bryosalmonae in the kidney of rainbow trout. Similar as in our results they identified a plateau phase in accumulation of parasite stages in the kidney. But in contrast to Bettge et al. (Reference Bettge, Segner, Burki, Schmidt-Posthaus and Wahli2009a , Reference Bettge, Wahli, Segner and Schmidt-Posthaus b ) where fish were exposed for 5 days to parasites in the natural habitat, we exposed fish for 1 h to a defined amount of parasites in the laboratory. Thus in our experiment, all parasites found in the fish originate from the same exposure time point, therefore influence of repeated infections over several days can be excluded. By applying a moderate single infection dose as in the present experiment, the possibility of subtle temperature related differences were not masked by an overwhelmingly large dose. Nevertheless, our results confirm the finding of Bettge et al. (Reference Bettge, Segner, Burki, Schmidt-Posthaus and Wahli2009a ) in identifying an intrinsic plateau phase in infection intensity and our results further reveal that this plateau phase acts as a threshold for parasite transmission from brown trout.
Bruneaux et al. (Reference Bruneaux, Visse, Gross, Pukk, Saks and Vasemägi2017) showed that T. bryosalmonae infection reduces the capacity of the brown trout to cope with demanding conditions by impaired thermal tolerance and reduced aerobic scope that were positively associated with the severity of kidney swelling during PKD. In our experiment, there was no macroscopic kidney swelling recognizable although the kidney swelling index was slightly higher in infected fish than controls, with no significant difference between the two infected temperature groups. Therefore, in the present experiment kidney swelling was largely uncoupled from infection intensity in the kidney. In a field setting with rainbow trout, Bettge et al. (Reference Bettge, Segner, Burki, Schmidt-Posthaus and Wahli2009a , Reference Bettge, Wahli, Segner and Schmidt-Posthaus b ) also showed little variation in the parasite intensity in the kidney at three different temperatures, but the kidney swelling index and disease severity varied in a temperature-dependent manner. In this study, there appeared to be no reduction in the aerobic scope due to PKD associated kidney swelling, suggesting that parasite infection dose or repeated infection dynamics might be an important factor in PKD severity. Evidence for such dynamics has been found in other myxozoan such as Ceratonova shasta (Ray et al. Reference Ray, Holt and Bartholomew2012).
In general, the more rapid parasite proliferation at 15 °C compared with that at 12 °C exceeds predictions from Q 10 temperature coefficient values and thus appears to be driven by more than just a general, linear effect of temperature on parasite growth. Moderately increased temperatures may disproportionally enhance cell division of the parasite (Noe and Dickerson, Reference Noe and Dickerson1995; Karvonen et al. Reference Karvonen, Rintamaki, Jokela and Valtonen2010), but also result in reduced parasite proliferation due to lethal effects on the parasite side at very high temperatures. Our experiment unlikely encompassed the top range of temperatures still permissive for proliferation. An alternative explanation for the temperature effect on the proliferation rate would be a pronounced impairment of the fish immune response at the higher temperature, and this reduced resistance would allow a faster proliferation rate of the parasite. Temperature is a key factor in modulating immune-competence of fish (Kollner et al. Reference Kollner, Wasserrab, Kotterba and Fischer2002; Bowden, Reference Bowden2008; Gorgoglione et al. Reference Gorgoglione, Wang, Secombes and Holland2013). This is highly relevant as a strong immune T. bryosalmonae infection response has been described in several studies (Chilmonczyk et al. Reference Chilmonczyk, Monge and de Kinkelin2002; Bettge et al. Reference Bettge, Wahli, Segner and Schmidt-Posthaus2009b ). However, the minimal clinical signs found in our experiment did not support a host effect on the parasite proliferation rate. Such an effect would possibly have to be investigated in fish infected with a higher parasite number.
Temperature may also directly modify the contact rate between hosts and water-borne parasite spores. Since temperature increases the oxygen demand of the trout and the fish responds to this by increasing gill ventilation and blood flow rates (Maricondi-Massari et al. Reference Maricondi-Massari, Kalinin, Glass and Rantin1998; Vornanen et al. Reference Vornanen, Haverinen and Egginton2014) spore contact rates with gill epithelium may increase with temperature. However, we consider this scenario less likely to explain the proliferation differences between the two temperatures. When assuming a Q 10 value of 2 for parasite motility and gill ventilation, a temperature difference of 3 °C is predicted to have only a moderate influence on these processes. Further, the average infection prevalence at both temperatures stayed below 60% throughout, suggesting no measurable differences in spore infectivity at the two experimental temperatures.
The infection dynamics after spore shedding did not differ between the two experimental temperatures. Throughout the plateau phase, there was only a slight decrease of the parasite intensity from the shedding point towards the end of the experiment; this decrease appears to be temperature independent. Our results indicate that brown trout at stable temperatures do not clear the infection. This is in contrast to findings in rainbow trout, where almost a full clearance of T. byosalmonae was seen and where the infection intensity in the few remaining positive fish decreased massively (Bettge et al. Reference Bettge, Segner, Burki, Schmidt-Posthaus and Wahli2009a ). Thereby the clearance was temperature dependent, i.e. the clearing period lasted longer at lower temperatures (Schmidt-Posthaus et al. Reference Schmidt-Posthaus, Bettge, Forster, Segner and Wahli2012).
Despite widely different parasite proliferation rates in the two temperatures, the level at which the infection intensity in the kidney stabilized was temperature-independent. Thus, factors other than proliferation capacity of the parasite or immune resistance of the host must be responsible for this. A possible explanation could be a density limitation of the parasite in the host tissue. As the parasite depends for its nutrition and metabolism (including oxygen consumption and waste production) on the host tissue, there may be an upper limit of how many parasites can be carried per unit host tissue, i.e. when oxygen and nutrient supply from the host tissue may become a limiting factor for a further increase of parasite intensity. Alternatively to nutrient and oxygen limitations as causative factors for parasite proliferation in the host tissue, T. bryosalmonae might be able to detect the presence of other parasites nearby and this could lead to a stop of proliferation as soon as a certain number of parasites per kidney volume is reached. Some pathogens and parasites appear to have such ability for ‘quorum sensing’, i.e. they can sense and communicate with con-specifics (Vassella et al. Reference Vassella, Reuner, Yutzy and Boshart1997; Williams et al. Reference Williams, Winzer, Chan and Camara2007). With regard to the fitness of T. bryosalmonae such a mechanism could be important to reduce the probability to be targeted by the fish's immune system before shedding occurs and to avoid excessive parasite proliferation preventing severe kidney damage destroying the kidney tubuli.
Insights from other myxosporean parasites may help to assess which life cycle aspects are important in the spread and establishment of PKD in new areas and as climates continue to change. All known myxozoans are endoparasites characterized by a high degree of morphological simplification, yet the parasite life-cycles are in many cases complex, involving multiple hosts and stage-dependent diversification, resulting in distinct spore types within the same life cycle (Fiala et al. Reference Fiala, Bartošová-Sojková, Okamura, Hartikainen, Okamura, Gruhl and Bartholomew2015). While most spores formed by myxosporeans possess hard valves and can remain infective for long periods of time, T. bryosalmonae malacospores have soft, thin-walled valves (de Kinkelin et al. Reference de Kinkelin, Gay and Forman2002), making malacospores potentially more sensitive to environmental stressors, in particular to temperature (Hartikainen and Okamura, Reference Hartikainen, Okamura, Okamura, Gruhl and Bartholomew2015). Therefore, PKD may be particularly strongly impacted by climate change and understanding the transmission parameters and their temperature-dependence across the multiple host life cycle is key to predicting and potentially mitigating future epidemics.
One general prediction arising from studies assessing pathogen sensitivity to climate change is that higher water temperatures can enhance the dispersive capacity of infective spores (Harvell et al. Reference Harvell, Mitchell, Ward, Altizer, Dobson, Ostfeld and Samuel2002; Thieltges and Rick, Reference Thieltges and Rick2006; Studer et al. Reference Studer, Thieltges and Poulin2010), potentially resulting in increasing encounter rates with infective spores. Changes in infective spore dose could also arise as temperatures provoke enhanced parasite development in the invertebrate host. Such temperature effects on proliferation rate have been demonstrated in the invertebrate host of T. bryosalmonae (Tops et al. Reference Tops, Lockwood and Okamura2006, Reference Tops, Hartikainen and Okamura2009), but it is not known whether spore infectivity are modified by temperature directly. Similarly to malacospore development in bryozoans, actinospore maturation and release are sensitive to temperature (El-Matbouli et al. Reference El-Matbouli, McDowell, Antonio, Andree and Hedrick1999; Tops et al. Reference Tops, Lockwood and Okamura2006, Reference Tops, Hartikainen and Okamura2009; Ray and Bartholomew, Reference Ray and Bartholomew2013). In a study on the whirling disease agent Myxobolus cerebralis (Myxosporea), susceptible rainbow trout exposed to actinospores from worms cultured at different temperatures showed different disease prevalence, demonstrating cascading effects of temperature on fish disease status (El-Matbouli et al. Reference El-Matbouli, McDowell, Antonio, Andree and Hedrick1999). In our experiment, we exposed all fish to an identical spore dose, allowing separation of temperature effects on spore production and viability in the invertebrate host from direct temperature effects on spore infectivity. Lack of prevalence differences between 12 and 15 °C thus suggested that temperature has non-detectable direct effects on the infectivity of T. bryosalmonae spores. This finding is in agreement with another study on C. shasta, where temperature did not influence spore ability to infect the vertebrate host, although actinospores production was modulated in the invertebrate host (Ray and Bartholomew, Reference Ray and Bartholomew2013). In general, these studies highlight the importance of parasite proliferation dynamics at level of hosts – physiological thresholds may in some cases over-ride the direct impacts of temperature on parasite infectivity and result in equivalent prevalence and infection intensities. In the case of PKD, the rate of parasite proliferation in the kidney seems to be the most important determinant controlling the period of active spore shedding and thus the key factor affecting the parasite transmission potential to the next host.
The present study has direct implications for understanding and modelling the processes leading to maintenance and spread of pathogens that exhibit temperature-dependent transmission dynamics. Specifically, our findings deliver important information on parasite dynamics and temporally modified transmission rates. In particular, the time required to reach the threshold intensity of transmission stage production is temperature-dependent and indicates that infected fish at higher water temperatures start to release infective spores at a significantly earlier time point than those in colder rivers. Through this, the available time window for the cycling of the parasite between the two hosts in the ecosystem is clearly increased.
Crucially, we have found no evidence that the released amount of parasite spores was higher at 15 °C than at 12 °C, but the longer period of the year during which spores were released by the fish might under natural circumstances increase the chances to complete the life cycle of the parasite and to maintain or spread the disease. An interesting observation is that the time-point when shedding started, occurred when parasite intensity in the fish kidney had reached its plateau level. Two different types of mechanisms could explain this finding: either the trigger for the parasite transmission is density-dependent and/or the parasite needs a defined temperature-dependent maturation time to locate in the tubules for being excreted. This further corroborates the suggestion above on the factors limiting parasite intensity in the fish host. Another implication of this interpretation is that the plateau phase of parasite intensity most likely does not reflect a stop of parasite proliferation, but an equilibrium between parasite proliferation and parasite release.
Here we provide experimental evidence on temperature accelerated parasite proliferation and transmission in a co-evolved fish–parasite system. Hereby we point out the importance of understanding how disease outcomes in such systems might exacerbate with increasing temperatures resulting in consequences for the already fragile equilibrium between species.
Supplementary material
The supplementary material for this article can be found at https://doi.org/10.1017/S0031182017001482.
ACKNOWLEDGEMENTS
We thank Bruno Polli (Ufficio Caccia e Pesca, Ticino) and the Fish farm of Maggia for providing us brown trout. Additionally, we would like to thank Barbara Müller and Regula Hirschi for taking care of the fish and all those that assisted in sampling. We are very grateful to Jukka Jokela for his constructive comments and suggestions.
FINANCIAL SUPPORT
This research was supported by the Swiss National Science Foundation (SNSF) Sinergia grant CRSII3_147649_1.