With requests for greater involvement and participation of patients and the general societal shift toward greater self-responsibility, self-determination, and autonomy, the role of the patient is changing (Reference Klemperer and Rosenwirth1). To fully and objectively assess clinical needs and treatment decisions, patient perspectives should be included.
With regard to optimal treatment of neuroendocrine tumors (NETs), decisions on approval, appraisal, utility assessment, and ultimately the pricing of health technologies are made by experts, with judgments grounded on evidence of clinical effectiveness obtained from (randomized) clinical trials. So far, decisions important from the perspective of NET patients and their next-of-kin, and how they are weighted against each other, have not yet been considered. As different preference studies have shown, decisions from experts do not always correlate with the subjective preferences of the patient, and patient criteria are not necessarily congruent with the endpoints set by experts (Reference Mühlbacher and Juhnke2). In addition, endpoints can be weighed differently in decision-making. Finally, subgroup differences in terms of preferences between different patient populations can also occur (Reference Mühlbacher and Bethge3).
NETs are slow-growing tumors that arise in the gastrointestinal tract, endocrine pancreas, lung, or thymus and are often malignant (Reference Granberg4). Many secrete hormones and thus provoke endocrine symptoms. Up to 10 percent of all NETs (Reference Kulke and Mayer5), especially midgut NETs, secrete high concentrations of hormones (Reference Kvols6). Symptoms caused by these NETs are collectively known as carcinoid syndrome (Reference Kulke and Mayer5).
NETs are relatively rare, having an annual incidence of approximately 2.5 to 5 per 100,000 people in Germany (approximately 1,600–4,000 per year) (Reference Arnold7) and prevalence of approximately 35 per 100,000 (Reference Öberg and Castellano8). Recent estimates show a steady increase in the incidence of NET and a dramatic increase in its prevalence; however, survival rates have increased, which is probably due to better diagnosis and treatment (9;10). The treatment of NET is multi-modal (Reference Melmed, Casanueva and Cavagnini11) and aims to control symptoms and reduce circulating hormone levels, thus preventing further tumor growth. Reducing tumor size may improve the chances of survival and quality of life of patients (Reference Colao, Faggiano and Pivonello9).
Drug treatment for patients with NET has several aims: treat the hormonal symptoms (anti-symptomatic treatment), improve the quality of life, and delay tumor growth (anti-proliferative therapy). The choice of a drug depends on the particular tumor type, because there are few drugs that are suitable for universal use (7;12). Biotherapies include mainly two groups of substances: somatostatin analogues and interferon-alfa (4;7;12). Several other new drugs are also available with different mechanisms of action, including cytostatics, tyrosine kinase inhibitors, and anti-angiogenic drugs; recently, radiolabeled substances have been introduced. Many of these compounds have shown promising results in patients with NET (Reference Granberg4).
Due to lack of information on patient preferences regarding drug treatment options of NET in Germany, identification and weighting of patient-relevant outcomes for decision-making are necessary. Obtaining preference criteria from patients should improve decisions about usage of health technologies in the short term (as preference-based treatment alternatives lead to higher compliance and adherence), strengthen patient orientation in the medium term (as patient-centered treatment alternatives and communication enhance patient understanding), and improve clinical effects in terms of morbidity and mortality in the long term (as higher compliance and adherence will lead to better treatment outcomes).
Against this background, the following questions are to be answered in the context of an empirical study with German participants: What are the key decision criteria for the selection of an optimal drug therapy from the perspectives of patients as well as their relatives? How do patients and relatives weigh these different decision criteria when selecting the optimal NET drug therapy? Are there differences in the weighting of the relevant decision criteria for different sub-groups? In this empirical study, we documented patient preferences regarding the drug treatment of NET. A discrete choice experiment (DCE) was used to rank patient-relevant treatment characteristics. The goal of the survey was to provide a basis for patient-oriented evaluations of innovative treatment options in NET and to assess patient perspectives on the basis of scientific evidence. Our overall aim was to expand the scientific clinical findings in the field of NET through assessments of treatment from the perspectives of patients and family members by means of preference data.
Methods
Elicitation of Patient Preferences through DCEs
The DCE is a choice-based version of the conjoint analysis, which was made possible by the theoretical work of Lancaster (Reference Lancaster13) and McFadden (Reference McFadden and Zarembka14). Instead of ranking or rating different therapeutic features (as in traditional importance elicitation formats and conjoint analyses), DCEs perform a pairwise comparison of hypothetical alternatives (differently configured therapy options) and ask participants to choose between them (Reference Ben-Akiva and Lerman15). Thus, respondents are forced to make trade-offs between attributes and their levels. This method offers practical advantages, such as closeness to reality, as trade-off decisions are part of everybody's everyday life. The implementation of pairwise comparisons considerably reduces the degree of complexity of the tasks for participants (Reference Hensher, Rose and Greene16–Reference Lancsar and Louviere18). Therefore, DCEs have been increasingly used in health economics and health service research (19;20). The structure of a DCE and its analysis are multi-stage (Reference Bridges, Hauber and Marshall21–Reference Mühlbacher and Johnson23). Several checklists are available and were considered during design of this study (16;18;24).
Decision Model: Attributes and Levels
A literature search was conducted on indications for NET (by means of PubMed and Medline) to document available state-of-the-art treatment options. Effects tables were used to structure the relevant literature. An effects table is a qualitative tool for displaying a concise summary of the key benefits and risks of a drug and summarizes key results from clinical studies in a certain indication (Reference Pignatti25).
Before the main survey was conducted, a preliminary qualitative study in nine NET patients who underwent semi-structured personal interviews was conducted. Within these, a list of treatment characteristics extracted from the literature was discussed and tested for relevance from the patient's perspective. Patient priorities were elicited using an analytic hierarchy process (AHP) (26;27).
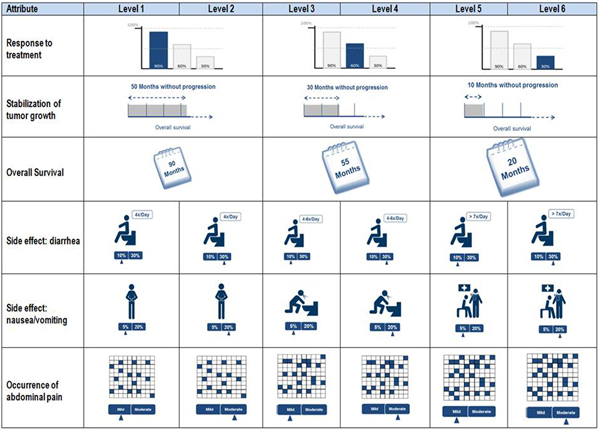
From these preliminary results, a DCE survey was developed using the most relevant aspects from the AHP, which was pretested in another nine qualitative personal interviews. These interviews were used to evaluate the clarity of the questionnaire design, the quality of the scales used, and the comprehensibility of the attributes, levels, graphics, and trade-offs included. This adaptive approach allowed the quality of the instrument to be optimized and questionnaire finalized (Reference Helm and Steiner28). A scope test to test for possible recoding of attribute levels on an ordinal scale was not included. However, visualizations used in the DCE to present attribute levels were also tested during the interviews. Figure 1 shows the final framework of the attributes, the characteristics with their explanations, and the associated icons.

Fig. 1. Overview of the decision model with visualizations.
The description of the attribute levels was created in a style used in the classification scheme by the U.S. Department of Health and Human Services and the Office of Human Research Protection of the Food and Drug Administration (29). Furthermore, a detailed patient-friendly introduction to every attribute and related level was included in the survey. Attributes related to side effects were introduced with respect to severity and risk to explain the different aspects of the attributes and to avoid any free interpretations.
Study Population and Recruitment
The survey was conducted between October and December 2014 using paper-and-pencil and online questionnaires. The support group “Netzwerk Neuroendokrine Tumoren (NeT) e.V.” aided in recruitment of patients for the survey. Patients diagnosed with NET as well as their relatives who gave informed consent and who were older than 18 years were included in the survey. Participants who did not meet all of the criteria were excluded as ineligible (disqualified), as were all participants who did not complete the questionnaire (incomplete).
Ethical Considerations
All documents, the study design, and the research questions for this study were reviewed and approved by the “Landesärztekammer Baden-Württemberg” ethics board (approval number F-2014-029). All participants were fully informed about the study and its potential risks and benefits before participation.
Experimental Design
To construct the DCE choice sets, an experimental d-efficient design (3*3; 6*3 MNL- Design) was created using NGene software (30). The selected design comprised eighty-four choices, which were divided into seven blocks of twelve choices. Allocation of participants to the individual blocks was randomized. An analysis of the linearity assumption based on various levels of attributes was possible with this design; that is, a parameter (coefficient) for each level could be calculated. From the experimental design, two alternatives were shown (binary choice sets). The experimental design excluded illogical combinations of attribute levels and also defined several combinations that condition each other. A status quo alternative was not taken into account in the choice scenarios, and participants had to state which of the therapeutic options they would choose (forced choice).
Based on Orme's formula (Reference Orme31), at least 125 respondents were needed to estimate the main effects (12 choice tasks, 2 alternatives, and a maximum of 3 levels). Because current discussion indicates that this value is the lowest limit and given the intended test for heterogeneity of preferences (32;33), a sample size of 200 participants was targeted to guarantee a statistically robust estimate and the chance to carry out analysis of subgroups.
Data Analyses
Socio-demographic data collected in the first part of the questionnaire were analyzed using descriptive analyses. The relative importance of each treatment attribute and level was estimated by means of multivariate methods (e.g., random parameter logit model, conditional logit model, latent class model) (Reference Rabe-Hesketh, Skrondal and Pickles34). SPSS and STATA were used for statistical analyses. In all analyses, p < .05 (double-sided) was considered statistically significant. The evaluation of the preference coefficients took place with consideration of the 95 percent confidence interval. Likelihood ratio tests, Akaike information criterion (AIC), and Bayesian information criterion (BIC) were used to check the accuracy of the model, to determine the most appropriate model, and to test for parameters that might improve the model fit.
Results
Socio-demographic Data and Health Responses
Participants could choose whether they filled in the online questionnaire or the identical paper-and-pencil questionnaire. Most (74.6 percent) opted for the online version. Of the total sample of 275 participants, 51.6 percent were female. Mean age was 58.4 years (range, 28–78 years; standard deviation [SD] = 10.05). As shown in Supplementary Table 1, 77.1 percent of the participants were married. Of total participants, 26.2 percent held an intermediate high-school diploma or technical college qualification and 42.5 percent had a university degree. Of total patient responders, 82.1 percent rated their current health as “good,” “very good,” or “excellent,” with 17.5 percent indicating that their current health was “not so good” or “poor.”
Mixed Logit Model (Random Parameter Logit Model) Results
Because the linearity assumption cannot be taken for granted, a nonlinear model was estimated. Thus, effects coding was used, and no function was assumed about the attribute levels. With this coding, a coefficient could be calculated for each level. The random parameter logit (also “mixed logit”) takes unobserved heterogeneities between the survey participants into account. Figure 2 and Supplementary Table 2 illustrate the corresponding values. In the mixed logit model, the significance of the individual therapeutic properties must be evaluated by differences between the coefficients of the best and worst levels. If one compares this more differentiated analysis with the previously presented analysis of the conditional logit model, the relevance of the decision criteria shows a similar structure. If the different risks (of occurrence) are analyzed separately from the effect-coded model shown here, it becomes apparent that no clear rankings for side effects can be derived due to overlaps among confidence intervals.

Fig. 2. Random parameter logit model (95 percent CI and SD).
AIC and BIC were used to select the models. Both information criteria follow the idea that a model should not be unnecessarily complex and balance the quality of fit of the estimated model to the available empirical data (sample) and its complexity measured by the number of parameters. The number of parameters is considered “punitively,” meaning that, for both information criteria, the model with the lowest value of the information criterion is best. Within the analyses, the model quality, measured by AIC and BIC, improved significantly in the combined model. Thus, for further analyses and for ease of illustration, the compound attributes with six levels (side effects) were summarized according to the primary dimension of the attributes to three levels. The summary was based on the severity of occurrence (“mild” to “severe”) for the occurrence of “diarrhea” and “nausea/ vomiting.” In the “occurrence of abdominal pain,” the summary was based on the probability of occurrence (15 percent to 25 percent).
The meaning of each therapy characteristic must be evaluated by differences in coefficients of the levels. In addition, the mixed logit model allows an analysis of existing heterogeneities within the individual attributes and levels. Because all attributes have been adopted as “random parameters” within the calculation model, the extent of heterogeneous preferences within the sample can be inferred from the SD. The corresponding SDs are shown in Supplementary Table 2.
The random parameter logit model resulted in the following order. The preference analysis (considering the 95 percent confidence interval) showed dominance for the attribute of “overall survival” (level difference [LD] = 3.229), which was followed by “response to treatment” (LD = 1.440), “stabilization of tumor growth” (LD: 1.236), “occurrence of nausea/ vomiting” (LD = 1.218), and “occurrence of diarrhea” (LD = 0.852). In the therapy decision of NET patients, “abdominal pain” (LD = 0.150) did not seem to play a decisive role, which is expressed by the lack of significance for two of the three levels.
Subgroup Testing Through Latent Class Analysis
Because the mixed logit model revealed significant SDs for most levels, resulting from heterogeneities within the sample, an exploratory analysis was generated by means of latent class models. A latent class model divides the population into several classes with differences in sensitivities across classes. With the class membership being treated as a latent component, a probabilistic class-allocation model is used. The class-membership probabilities are a function of socio-demographic attributes of the decision maker, meaning that any taste heterogeneity across respondents can be linked directly to variations across individuals. The standard mixed model has a rather low degree of flexibility in terms of the analysis of the extent of heterogeneity, and the possibility of identifying variations due to patient characteristics is quite limited (35;36). The latent class model has significant advantages in interpretation over the mixed model. Using LC, one is able to link taste heterogeneity to socio-demographic indicators instead of just knowing that a certain sensitivity follows a certain (assumed) random distribution in the study sample (35;37).
When reviewing model accuracy using AIC and BIC, a three-class model was identified as suitable to reflect existing heterogeneity in responses. In addition, based on the probability of class membership, structure variables could be analyzed regarding affiliations and possible correlations between socio-demographic variables, and preference weightings were derived. To determine class membership, significant differences in group distribution were first analyzed using cross tables, which were confirmed by mean value comparisons. From the significant structural parameters, a regression model was calculated. In total, five structural and personal characteristics were identified that influenced the respective probability of class membership: “gender,” “marital status (married),” “living in a household with a partner,” “worries about the future,” and “self-rated health.”
The preference pattern of the first group (class 1 [n = 54; 19.5 percent]) was characterized by a very high rating of the three outcome attributes (Figure 3). In class 1, order of preference was “response to treatment” (LD = 1.989), followed by “overall survival” (LD = 1.613) and “stabilization of tumor growth” (LD = 1.347). Members of class 1 were predominantly male. More than in the other two classes, participants in class 1 indicated “less/not at all” when asked about concerns regarding future health. In the other two classes, participants were moderately or very concerned regarding future health.

Fig. 3. Preference patterns for class 1, 2, and 3 (95 percent- CI).
Class 2 (n = 95; 34.84 percent) showed significantly different preference patterns versus class 1. Side effect attributes were significantly more important, with “nausea/vomiting” (LD = 1.677) being most relevant for this subgroup, which was followed by “occurrence of diarrhea” (LD = 1.166) and “overall survival” (LD = 0.964) (Figure 3). Participants in class 2 were predominantly and significantly female. In class 2, an above average number of participants lived in single households (as opposed to the results of class 3). Accordingly, class 2 included the lowest proportion of married participants (Table 1). This effect was statistically significant.
Table 1. Latent Class Analysis (Three-Class Model)

−−, low number of respondents; ++, high number of respondents.
In class 3 (n = 126; 46.0 percent), a noticeable preference was shown for “overall survival” (LD = 4.519) (Figure 3). This most important preference was followed by “stabilization of tumor growth” (LD = 1.130) and “response to treatment” (LD = 0.949). Participants in class 3 mainly lived together with a partner and were mainly married (Table 1). We observed a significant association between the structure variable “married” and class membership.
Discussion
Most patients with NETs of the digestive organs are in their 6th and 7th decade of life, with our present sample within this range of 50 to 69 years (38;39). Compared with past investigations, our study included the highest number of NET patients (Reference Johanson, Wilson and Abrahamsson40). With regard to tumor location, fifty respondents (18.2 percent) had tumors of the pancreas (functionally active or nonfunctional active). This is within results from the Global Patient Survey (Reference Kolarova, Sissons and Leyden41), in which 22 percent of participants worldwide and 15 percent of U.S. respondents reported tumors of the pancreas. Also in accordance most NET forms being balanced between males and females (38;39;42;43), the current sample was relatively balanced, with 133 men and 142 women.
This study is the first to elicit patient preferences with regard to medicinal therapies for NETs. In the mixed logit model, all attributes except “occurrence of abdominal pain” showed a significant effect within therapeutic decisions. “Occurrence of abdominal pain” had no significant coefficient r in the mixed logit model, meaning that this side effect did not affect decision choices with respect to medicinal therapies. This result is consistent with the lack of occurrence of this adverse event in our respondents: 49.8 percent of respondents indicated “not at all” or only “mild” abdominal pain.
The attributes that affected therapeutic decisions (overall survival, response to treatment, stabilization of tumor growth, nausea/vomiting, and diarrhea) are discussed below.
Overall survival was a key decision criterion and had the greatest effect on patient decisions. When asked, “What do you think is the average life expectancy in a drug therapy,” 78.2 percent of participants answered time spans over 55 months and 33.8 percent answered time over 90 months. In other words, most study participants believed that a medicinal therapy resulted in an overall survival of more than 4.5 years. This corresponds with the original survival times of various active agents (Reference Öberg, Knigge, Kwekkeboom and Perren44). Due to the lack of availability of additional preference studies for NET treatment, these preference results could not be compared.
Both “response to treatment” and “stabilization of tumor growth” shared equal importance as part of the underlying decision model or underlying level margins. The high importance of response to treatment was displayed in the AHP. In previous studies, response to treatment has been ranked third in the AHP (26;27). Stabilization of tumor growth also significantly affected decision of participants. Progression-free survival is the primary endpoint in most clinical trials (Reference Arnold, Wittenberg and Rinke45–Reference Raymond, Niccoli and Raoul49). Because study participants were recruited with the help of a support group, the study sample was familiar with this clinical parameter and understood its meaning and importance.
Side effects were weighted lower than treatment outcomes. Among the side effects, “nausea/vomiting” had the highest weight. One possible explanation is that patients are often seriously affected daily by this side effect. Therefore, patients find that nausea/vomiting limits their performance and possibly reduces their quality of life. A total of 40.0 percent of respondents stated that their quality of life was moderately or severely affected by nausea/vomiting. However, when asked about the frequency of occurrence of nausea/vomiting, only 5.5 percent of 181 respondents taking medications reported having moderate or severe nausea/vomiting during therapy.
Similar to previous AHP results, occurrence of diarrhea was the second highest rated side effect (26;27). However, we observed a relatively low significance in the mixed logit model (taking into account the 95 percent confidence interval, a split rank must be assumed due to the intersection of the intervals). When respondents were asked about how strong diarrhea would affect quality of life, 55.2 percent stated moderately or severely. When asked about the frequency (of occurrence) of diarrhea, 24.8 percent of 181 respondents taking medication claimed to have moderate or severe diarrhea during therapy.
Latent Class Analysis
The latent class analyses revealed three heterogeneous classes, each showing different weightings of therapeutic characteristics. Class 1 clearly emphasized the effects of therapy and valued these the most. This class corresponds somewhat to a clinical viewpoint, in which outcomes precede side effects. In class 2, the side effects “nausea/vomiting” and “diarrhea” were the most important attributes for therapeutic decisions, with “overall survival” being the third most important outcome attribute. Thus, this group seemed to value “quality” instead of “quantity.” That is, adverse events and treatment outcomes were paramount to a certain extent, but outcome was not preferred at any price. Class 3 was a mixture of the other two groups, with both views seemingly superimposed. However, we observed a large gap between the main outcome attribute and the subsequent attributes. As shown by the heterogeneity test in the mixed logit model, “overall survival” was a significantly more important attribute. This underlines the great difference between the individual attributes in this largest of the three subgroups.
Among studies that analyzed the extent by which patient characteristics could influence the preference patterns, one study showed a dependence on educational status, whereas another found no correlation. In terms of gender, different studies on other oncological indications have consistently shown no relationship between gender of respondents and the preference patterns (Reference Brundage, Davidson and Mackillop50–Reference Hirose, Yamaoka and Ohnishi54). The present latent class analysis was clearly contradictory, as we observed significant differences between men and women. However, similar to previous results (55;56), no relevant differences between age and preference patterns were observed.
Study Limitations
The study had several limitations. First, recruitment conducted by means of a patient support group could have influenced our study population with respect to individual parameters, which could not be examined in total. However, access to this self-help group is free to every patient and family member. In addition, socio-demographic data showed a pattern similar to other studies.
As previously shown, preferences can depend on the population's cultural background and their existing healthcare system (Reference Blinman, Alam and Duric55). When interpreting and generalizing our study results, it is important to remember that a German study sample was used. Furthermore, it cannot be excluded that interactions may be present. Because analysis was not designed to discern interactions, this would need to be addressed in further experiments.
It has to be noted that study participants did not form decisions on the survey together with their relatives or their physicians, which could be different in reality, depending on the patient and the healthcare provider setting. Different stakeholders may have different preferences. As part of an evaluation process, it should be possible to consider all perspectives (i.e., those of decision makers, citizens, patients, insurers, and experts). Information and priorities from each view are necessary and important.
Scale heterogeneity (differences in choice variability) was not considered in this analysis. Choice variability refers to how respondents may be inconsistent in their overall choices. The focus of our analysis was segments/classes of respondents, which we assumed to be consistent in their choice decisions. Latent classes in the analysis were only characterized in terms of preference differences (Reference Burke, Burton and Huybers56).
Conclusions
With the present movement of “patient involvement” and “shared decision making,” patient preferences and objectives on innovative therapies and medications should be analyzed and considered, including with regard to NETs.
NET treatment decisions are complex and require a fine balance between potential outcomes and simultaneous potential risks and side effects. The results showed that patients and their relatives gave the highest weighting to “overall survival,” “response to treatment,” and “stabilization of tumor growth.” Thus, overall survival is of crucial importance for participants in the context of a possible choice of therapy versus potential side effects and associated impairments.
However, sole consideration of treatment from a patient's perspective is not appropriate. That is, patient benefit is not only determined by overall survival but also by other positive outcomes as well as potential side effects. Patients trade several aspects when making their final treatment decisions. Therefore, multi-criteria decision models should be used for allocation and treatment decisions.
The study found that the DCE could identify and weigh patient-relevant characteristics of NET treatment options in terms of possible treatment alternatives. The DCE features a high degree of realism and is easy to handle for the patient. This comprehensive theoretical and application-oriented use of a DCE allowed us to view essential decision criteria for optimal drug therapies for NET treatment according to patients and their relatives. By assigning weight to different treatment properties and their characteristics, we could evaluate how patients and their relatives evaluated relevance of different aspects of NET treatment.
Patient preferences gained from this study can be used as information in the context of shared decision-making (Reference Alvaro, Kumar and Julka57–Reference Edwards, Elwyn and Wood59). Moreover, the results can allow patient preferences to be added to clinical evidence when making treatment or regulatory decisions and to extend available knowledge. Incorporating the patient perspective within treatment and reimbursement decisions can improve the optimal allocation of scarce resources.
Author ORCIDs
Axel C. Mühlbacher, 0000-0003-4402-9211
Supplementary material
The supplementary material for this article can be found at https://doi.org/10.1017/S0266462319000217.
Conflicts of interest
The authors declare no further conflicts of interests.