1 Introduction
The flow over swept wings is subject to laminar–turbulent transition due to the growth and breakdown of the so-called crossflow (CF) instability. This inviscid instability mechanism can be traced back to the flow topology of the boundary layer developing over the wing (e.g. Mack Reference Mack1984; Saric, Reed & White Reference Saric, Reed and White2003). This flow, as well as the one around axisymmetric bodies at incidence or spinning about the symmetry axis, follows three-dimensional trajectories. Considering a particle of air moving along a streamline near the aerodynamic body, the force equilibrium in the direction orthogonal to the streamline itself and parallel to the model surface is dictated by the pressure forces (which cause centripetal acceleration) balanced by the centrifugal forces (which, instead, tear the particle outwards of the streamline). While the equilibrium holds in the inviscid flow field, this is not the case within the boundary layer. In the boundary layer, given the lack of momentum, the air particle will experience a force imbalance and will tend to move in the direction opposite to the pressure gradient. In practice, the boundary layer velocity profile along the direction orthogonal to the inviscid streamlines will have null values at the wall and at the outer edge but a finite local maximum at a given wall-normal position. This will create boundary layer velocity profiles that feature a point of inflection, giving rise to inviscid instability modes (Saric et al. Reference Saric, Reed and White2003). These can be of a travelling or stationary nature depending on the boundary layer receptivity to free stream turbulence and surface roughness (Bippes Reference Bippes1999).
Surface flow visualisation and infrared thermography experiments in low turbulence wind tunnels (e.g. Dagenhart et al. Reference Dagenhart, Saric, Mousseux and Stack1989; Bippes Reference Bippes1999; Saric et al. Reference Saric, Reed and White2003; Saric, Carpenter & Reed Reference Saric, Carpenter and Reed2011) have shown a distinctive transition scenario for this type of boundary layer, characterised by sequences of streaks aligned, within a few degrees, with the flow direction. These streaks are the footprint of stationary boundary layer vortices causing a velocity modulation along the wing span and therefore of the wall skin friction and of the convective heat flux (quantities usually visualised in these experiments). The crossflow vortices, although relatively weak, modify the mean flow and, consequently, the stability of the boundary layer. They tear low momentum flow from the lower regions of the boundary layer and displace it upwards in high momentum regions, and vice versa. This results in a modified boundary layer featuring a momentum modulation of the flow in the spanwise direction and in the development of strong velocity shears in the spanwise and wall-normal directions, which are highly unstable to secondary instability mechanisms.
A short review of the main studies on the crossflow instability is presented in the next section. For more complete reviews the reader is instead referred to Bippes (Reference Bippes1999), Arnal & Casalis (Reference Arnal and Casalis2000), Saric et al. (Reference Saric, Reed and White2003) and to some more recent studies such as Wassermann & Kloker (Reference Wassermann and Kloker2002, Reference Wassermann and Kloker2003), White & Saric (Reference White and Saric2005), Bonfigli & Kloker (Reference Bonfigli and Kloker2007), Downs & White (Reference Downs and White2013) and Hosseini et al. (Reference Hosseini, Tempelmann, Hanifi and Henningson2013).
2 Background and present work
Experimental investigations on three-dimensional boundary layers were mainly carried in Germany (Deutsches Zentrum für Luft- und Raumfahrt (DLR) Göttingen) by Bippes and coworkers (Deyhle & Bippes Reference Deyhle and Bippes1996; Bippes Reference Bippes1999) and in United States by William Saric and his group (Arizona State University (ASU) first and Texas A&M University (TAMU) up to date) (Saric et al. Reference Saric, Reed and White2003; White & Saric Reference White and Saric2005). These campaigns made use of very quiet wind tunnels, exhibiting a free stream turbulence level typically lower than 0.1 % of the free stream velocity. Surface flow visualisation was performed by means of infrared thermography (Saric et al. Reference Saric, Carpenter and Reed2011), hydrogen bubbles tracing (Bippes Reference Bippes1999), naphthalene sublimation techniques (Dagenhart et al. Reference Dagenhart, Saric, Mousseux and Stack1989; Saric, Carrillo R. & Reibert Reference Saric, Carrillo and Reibert1998; White & Saric Reference White and Saric2000) and fluorescent mineral oil (Serpieri & Kotsonis Reference Serpieri and Kotsonis2015a ,Reference Serpieri and Kotsonis b ). Hot-wire anemometry (HWA) boundary layer measurements were performed using precision sensor traversing systems (e.g. Deyhle & Bippes Reference Deyhle and Bippes1996; Reibert et al. Reference Reibert, Saric, Carrillo and Chapman1996; Kawakami, Kohama & Okutsu Reference Kawakami, Kohama and Okutsu1999; White & Saric Reference White and Saric2005). Glauser et al. (Reference Glauser, Saric, Chapman and Reibert2014) reported the use of hot-film surface sensors.
Along with these experimental efforts, several studies based on stability theories (e.g. Fischer & Dallmann Reference Fischer and Dallmann1991; Malik et al. Reference Malik, Li, Choudhari and Chang1999; Haynes & Reed Reference Haynes and Reed2000; Janke & Balakumar Reference Janke and Balakumar2000; Koch et al. Reference Koch, Bertolotti, Stolte and Hein2000; Koch Reference Koch2002; Bonfigli & Kloker Reference Bonfigli and Kloker2007) and on numerical investigations (e.g. Högberg & Henningson Reference Högberg and Henningson1998; Wassermann & Kloker Reference Wassermann and Kloker2002, Reference Wassermann and Kloker2003; Bonfigli & Kloker Reference Bonfigli and Kloker2007) have been performed.
The extended literature on the topic, briefly summarised in this section, covers almost all the relevant aspects of the complex transition pattern of these flows. It will become evident that the development and diffusion of theoretical models and direct numerical simulations (DNS), as has occurred in the last twenty years, has allowed investigations so far not possible in experimental frameworks. This justifies the need for deploying more advanced flow diagnostic tools for wind tunnel campaigns. This demand partially drove the current study.
2.1 Primary instability
In his review article, Bippes (Reference Bippes1999) reported several experiments, conducted over a period of years at DLR (e.g. Deyhle & Bippes Reference Deyhle and Bippes1996), making use of different models and placed in several facilities in order to see the effect of model geometry and tunnel free stream turbulence on instability development. It was found that the model leading edge radius influences the attachment line instability while the curvature of the surface has a stabilising effect when convex and a destabilising effect when concave due to the generation of Görtler vortices. The free stream turbulence level instead changes the type of the amplified crossflow instability modes: in lower turbulence tunnels (with a free stream turbulence intensity related to the free stream velocity of
 $Tu/U_{\infty }<0.15\,\%$
) stationary crossflow waves are observed while, in higher turbulence facilities, travelling modes take place and dominate the transition scenario.
$Tu/U_{\infty }<0.15\,\%$
) stationary crossflow waves are observed while, in higher turbulence facilities, travelling modes take place and dominate the transition scenario.
Similar results were recently shown through the extensive measurements performed by Downs & White (Reference Downs and White2013), by carefully modifying and measuring the turbulence intensity of the KSWT facility at TAMU by means of turbulence screens. Their results confirm the effectiveness of surface roughness in forcing the primary stationary modes and the capability of free stream turbulence to enhance primary travelling instabilities, adding that the latter are also highly sensitive to the surface roughness.
The studies carried at ASU concentrated mainly on the effect of surface roughness on the stability of the boundary layer and led to significant conclusions: Reibert et al. (Reference Reibert, Saric, Carrillo and Chapman1996) measured several stationary waves in the boundary layer developing on a
 $45^{\circ }$
swept wing featuring a laminar airfoil at chord Reynolds number of
$45^{\circ }$
swept wing featuring a laminar airfoil at chord Reynolds number of
 $2.4\times 10^{6}$
. Towards simplifying the flow arrangement and to facilitate comparison with numerical results, they made use of small roughness elements (cylindrical rub-on transfers with a diameter of 3.7 mm and height of 6
$2.4\times 10^{6}$
. Towards simplifying the flow arrangement and to facilitate comparison with numerical results, they made use of small roughness elements (cylindrical rub-on transfers with a diameter of 3.7 mm and height of 6
 ${\rm\mu}$
m) placed at the model leading edge region. The roughness elements were spaced along the spanwise direction at distances matching the wavelength predicted by linear stability theory (LST) for the most amplified stationary mode. The discrete roughness elements fixed the wavelength of the amplified mode leading to a more uniform transition pattern compared to the unforced case. The spatial amplification factors of the stationary vortices were reported featuring a monotonic growth till a given saturation amplitude prior to the onset of transition. In the same study, the flow configuration was forced by placing the roughness elements at three times the wavelength of the naturally dominant mode. This case showed again the naturally most amplified mode to dominate the transition process but showed also that all the higher harmonics of the forced mode (i.e. shorter wavelength modes) were amplified. In contrast, no lower harmonics were observed in both the performed tests. Moreover they showed that if stationary modes undergo amplitude saturation, then the forcing amplitude does not modify the transition process.
${\rm\mu}$
m) placed at the model leading edge region. The roughness elements were spaced along the spanwise direction at distances matching the wavelength predicted by linear stability theory (LST) for the most amplified stationary mode. The discrete roughness elements fixed the wavelength of the amplified mode leading to a more uniform transition pattern compared to the unforced case. The spatial amplification factors of the stationary vortices were reported featuring a monotonic growth till a given saturation amplitude prior to the onset of transition. In the same study, the flow configuration was forced by placing the roughness elements at three times the wavelength of the naturally dominant mode. This case showed again the naturally most amplified mode to dominate the transition process but showed also that all the higher harmonics of the forced mode (i.e. shorter wavelength modes) were amplified. In contrast, no lower harmonics were observed in both the performed tests. Moreover they showed that if stationary modes undergo amplitude saturation, then the forcing amplitude does not modify the transition process.
These observations were at the base of the study done by Saric et al. (Reference Saric, Carrillo and Reibert1998) and White & Saric (Reference White and Saric2000), centred on the idea of forcing a subcritical mode, which is a mode with a wavelength smaller than that of the most amplified mode. The experiment of Saric et al. (Reference Saric, Carrillo and Reibert1998), done at the same flow conditions as the one of Reibert et al. (Reference Reibert, Saric, Carrillo and Chapman1996), led to the remarkable conclusion that subcritical forcing can delay transition to turbulence for stationary crossflow instability boundary layers. This transition control strategy has been followed by several other experimental (Downs & White Reference Downs and White2013; Serpieri & Kotsonis Reference Serpieri and Kotsonis2015b ), theoretical (Malik et al. Reference Malik, Li, Choudhari and Chang1999) and numerical (Wassermann & Kloker Reference Wassermann and Kloker2002; Hosseini et al. Reference Hosseini, Tempelmann, Hanifi and Henningson2013) studies. Transition delay by this technique has not been always observed (Downs & White Reference Downs and White2013) and would need further investigation.
Radeztsky, Reibert & Saric (Reference Radeztsky, Reibert and Saric1999) demonstrated the effect of discrete surface roughness on transition location. They performed a careful study of the geometrical parameters (width and height) of the roughness elements, showing promotion of transition for taller roughness elements of diameter up to 0.08 times the mode wavelength. For larger diameters, increasing the height of the roughness elements did not have an effect on the transition onset. Additionally, they showed relative insensitivity of the transition process to strong and broadband acoustic forcing, in agreement with the work of Deyhle & Bippes (Reference Deyhle and Bippes1996).
Tempelmann et al. (Reference Tempelmann, Schrader, Hanifi, Brandt and Henningson2012) studied the boundary layer receptivity to surface roughness by means of parabolised stability equations (PSE) and adjoint PSE together with DNS. They commented on the discrepancies with the experimental results of Reibert et al. (Reference Reibert, Saric, Carrillo and Chapman1996) pointing at possible small imperfections in the application of roughness elements on the model surface (which is very likely in laboratory conditions given the micrometric size of these elements). The problem of receptivity to surface roughness was further investigated by Kurz & Kloker (Reference Kurz and Kloker2014) in a following DNS study. They found that the amplitude of the fundamental stationary mode scales linearly with the roughness height only when the roughness array features null spanwise-averaged shape and flow blockage.
2.2 Secondary instability
In his study on the stability of a swept cylinder, Poll (Reference Poll1985) measured high-frequency boundary layer fluctuations superimposed on the primary crossflow instability mode. These were reported also in the swept wing experiments by Kohama, Saric & Hoos (Reference Kohama, Saric and Hoos1991) and identified as a secondary instability mechanism acting on the boundary layer, modified by the primary stationary crossflow modes. Since these early works, efforts in revealing the nature and the evolution of the crossflow secondary instability have intensified.
Malik et al. (Reference Malik, Li, Choudhari and Chang1999), following the work of Malik, Li & Chang (Reference Malik, Li and Chang1994) on a Hiemenz flow, exploited linear and nonlinear parabolised stability equations (PSE and NPSE) to assess the evolution of the primary instabilities as well as a temporal two-dimensional eigenvalue problem to study the secondary instability for the flow case of the ASU experiments (Reibert et al.
Reference Reibert, Saric, Carrillo and Chapman1996). Under the assumption that the secondary modes are of a convective nature (see also the theoretical efforts of Fischer & Dallmann (Reference Fischer and Dallmann1991), Lingwood (Reference Lingwood1997), Janke & Balakumar (Reference Janke and Balakumar2000), Koch et al. (Reference Koch, Bertolotti, Stolte and Hein2000) and Koch (Reference Koch2002)), they used Gaster’s transformation to track the modes spatial evolution, finding good agreement with the experimental results. Another key contribution from the work of Malik et al. (Reference Malik, Li, Choudhari and Chang1999) is the classification of the secondary instability into two main modes. The first is the type-I mode, related to the streamwise flow velocity gradient along the spanwise direction (usually
 $z$
, from which this mode is also referred to as the z-mode) located at the outer side of the upwelling region of the primary crossflow vortex and characterised by higher energy and lower frequencies. The second is the type-II mode, or y-mode, that is located on the top of the primary vortices where the streamwise velocity wall-normal (
$z$
, from which this mode is also referred to as the z-mode) located at the outer side of the upwelling region of the primary crossflow vortex and characterised by higher energy and lower frequencies. The second is the type-II mode, or y-mode, that is located on the top of the primary vortices where the streamwise velocity wall-normal (
 $y$
) gradients are larger. This mode features lower energy but higher frequencies. As a last outcome of this study, a transition estimation criterion based on secondary instability amplification was presented, showing good correlation with the transition locations measured by Reibert et al. (Reference Reibert, Saric, Carrillo and Chapman1996).
$y$
) gradients are larger. This mode features lower energy but higher frequencies. As a last outcome of this study, a transition estimation criterion based on secondary instability amplification was presented, showing good correlation with the transition locations measured by Reibert et al. (Reference Reibert, Saric, Carrillo and Chapman1996).
Haynes & Reed (Reference Haynes and Reed2000) used linear and nonlinear PSEs as well as LST to investigate the boundary layer experimentally measured by Reibert et al. (Reference Reibert, Saric, Carrillo and Chapman1996). Their results are in very good agreement with the experimental data. Furthermore, the study highlighted the importance of including nonlinear terms and surface curvature. Convex surfaces have a stabilising effect on the primary vortices and as such, enhance their saturation and the occurrence of secondary modes.
Floquet analysis was used by Fischer & Dallmann (Reference Fischer and Dallmann1991) and Janke & Balakumar (Reference Janke and Balakumar2000) to inspect the secondary stability of the CF vortices of the DLR experiment (Deyhle & Bippes Reference Deyhle and Bippes1996) (in the second study, the secondary instability of a Hiemenz flow boundary layer was also considered). One of the main outcomes from these studies is the investigation of the low-frequency type-III mode. This mode refers to the interactions between primary stationary and primary travelling modes and therefore its relevance in the transition pattern depends on the free stream turbulence level (Högberg & Henningson Reference Högberg and Henningson1998; Downs & White Reference Downs and White2013).
White & Saric (Reference White and Saric2005) dedicated a detailed experimental investigation to the secondary instability mechanisms and sensitivity to different base flow cases. Hot-wire measurements of velocity fluctuations, corresponding to the secondary instability, were extracted for a chord Reynolds number flow of
 $Re=2.4\times 10^{6}$
under critical stationary mode forcing. Following previous works, micron-sized roughness elements were placed at the leading edge region spaced at the wavelength of the most amplified mode. In this study, the different secondary instability modes were detected and their appearance and sudden growth identified as the cause of turbulent breakdown. The conditions under which the type-II mode arises and reaches higher energies are those of supercritical forcing (same roughness spacing as the
$Re=2.4\times 10^{6}$
under critical stationary mode forcing. Following previous works, micron-sized roughness elements were placed at the leading edge region spaced at the wavelength of the most amplified mode. In this study, the different secondary instability modes were detected and their appearance and sudden growth identified as the cause of turbulent breakdown. The conditions under which the type-II mode arises and reaches higher energies are those of supercritical forcing (same roughness spacing as the
 $Re=2.4\times 10^{6}$
case but Reynolds number increased to
$Re=2.4\times 10^{6}$
case but Reynolds number increased to
 $Re=2.8\times 10^{6}$
) where the spanwise shear and hence type-I modes are mitigated (see also Hosseini et al.
Reference Hosseini, Tempelmann, Hanifi and Henningson2013). Furthermore, the influence of increased free stream turbulence and of acoustic forcing on the transition scenario were also investigated but required further dedicated efforts which came later with the already mentioned study of Downs & White (Reference Downs and White2013).
$Re=2.8\times 10^{6}$
) where the spanwise shear and hence type-I modes are mitigated (see also Hosseini et al.
Reference Hosseini, Tempelmann, Hanifi and Henningson2013). Furthermore, the influence of increased free stream turbulence and of acoustic forcing on the transition scenario were also investigated but required further dedicated efforts which came later with the already mentioned study of Downs & White (Reference Downs and White2013).
The first spatial DNS study on the development of secondary instability modes over the primary stationary vortices was performed by Högberg & Henningson (Reference Högberg and Henningson1998). They studied the evolution of a Falkner–Skan–Cooke boundary layer subject to fixed steady primary forcing and random unsteady excitation of the secondary instability via the use of volume body forces. The location of the unsteady volume forces changed the nature of the amplified modes: a more upstream forcing gave rise to lower-frequency type-III modes, while a more downstream forcing, close to the location of primary saturation, led to the triggering of the aforementioned high-frequency type-I modes. The latter mode showed much larger growth rates than the low-frequency type-III mode.
Two later DNS investigations by Wassermann & Kloker (Reference Wassermann and Kloker2002, Reference Wassermann and Kloker2003) further described the secondary instability modes developing around stationary and travelling CF vortices, respectively. In these works, the type-I secondary instability vortices are visualised and described as a sequence of corotating helicoidal structures superimposed on the upwelling region of the primary vortices and convecting downstream. The axes of these structures form a considerable angle with the one of the primary waves and the spinning direction of the two modes is opposite. An interesting outcome of the simulations of Wassermann & Kloker (Reference Wassermann and Kloker2002, Reference Wassermann and Kloker2003) is that, when the unsteady disturbance that triggers the secondary modes is switched off, the associated structures are advected downstream, thus confirming the findings of Kawakami et al. (Reference Kawakami, Kohama and Okutsu1999) and Koch (Reference Koch2002) regarding the convective nature of these instability modes.
Another relevant investigation on the secondary instability of stationary and travelling primary CF vortices was reported by Bonfigli & Kloker (Reference Bonfigli and Kloker2007). In this study the authors used spatial DNS and secondary linear stability theory (SLST), the latter previously applied by Fischer & Dallmann (Reference Fischer and Dallmann1991), Malik et al. (Reference Malik, Li and Chang1994, Reference Malik, Li, Choudhari and Chang1999), Janke & Balakumar (Reference Janke and Balakumar2000) and Koch (Reference Koch2002). The two techniques showed good agreement in terms of eigenfunctions and growth rates when the DNS analysis is tuned to the simplified base flow of the SLST. The two techniques captured the structures related to the type-I and type-III instabilities, whereas DNS did not show amplification of the type-II instability predicted by SLST. For the analysis of the travelling primary CF instability, with no stationary modes considered, destabilisation of the type-III mode is not reported. This is expected given that this mode is generated by the spanwise modulation of the primary travelling waves (see also Fischer & Dallmann Reference Fischer and Dallmann1991; Högberg & Henningson Reference Högberg and Henningson1998; Janke & Balakumar Reference Janke and Balakumar2000) caused by the stationary CF vortices. One more important outcome from the work of Bonfigli & Kloker (Reference Bonfigli and Kloker2007) relates to the nature of type-I and type-II modes. The behaviour and location of these modes associates them to instabilities of the Kelvin–Helmholtz type.
The possibility of experimentally confirming the outcomes of these theoretical and numerical investigations on the spatio-temporal development of the secondary instability has been so far limited. This is attributed to the inherent features of the technique mainly used in wind tunnel tests: single or double-wire hot-wire probes. Hot-wires, although being very accurate for this type of experiment, are a point measurement technique and as such cannot infer any information regarding the spatio-temporal evolution of the unsteady structures described by Högberg & Henningson (Reference Högberg and Henningson1998), Malik et al. (Reference Malik, Li and Chang1994, Reference Malik, Li, Choudhari and Chang1999) and Wassermann & Kloker (Reference Wassermann and Kloker2002, Reference Wassermann and Kloker2003), Bonfigli & Kloker (Reference Bonfigli and Kloker2007).
A successful attempt to overcome this limitation was performed by Kawakami et al. (Reference Kawakami, Kohama and Okutsu1999), who inferred the spatio-temporal evolution of the secondary instabilities in an experimental framework. Although the technique they used was still based on hot-wire measurements, they forced the secondary modes at their respective frequencies by applying unsteady blowing and suction in the boundary layer undergoing primary mode saturation, similarly to what done in their numerical framework by Högberg & Henningson (Reference Högberg and Henningson1998). By correlating the wire signal at the several phases of the actuation, they were able to reconstruct the shape, projected in two-dimensional planes, the direction and the velocity by which the secondary type-I waves and the primary travelling lower-frequency type-III modes are evolving in the boundary layer.
Similarly to Kawakami et al. (Reference Kawakami, Kohama and Okutsu1999), Chernoray et al. (Reference Chernoray, Dovgal, Kozlov and Löfdahl2005) performed phase locked hot-wire measurements on the secondary instability of streamwise vortices in a swept wing boundary layer. These vortices were not generated by crossflow instability mechanisms, but rather directly caused by large roughness elements or localised continuous suction and were subsequently subject to the crossflow. Despite these differences, their measurements encompassed full volumes and hence led to the description of the three-dimensional organisation and streamwise evolution of the streamwise vortices and their instability.
Simultaneous multipoint measurements have been performed using surface mounted hot-film sensors (Glauser et al. Reference Glauser, Saric, Chapman and Reibert2014). However, the sensors were located at the wall and the region of the flow field that was investigated was quite small and not in the zone of the boundary layer mainly influenced by the secondary instability. Despite this, the simultaneous use of multiple sensors allowed the study of the spatial coherence of the vortical structures by means of POD. A correlation between the first and second POD modes with the primary travelling crossflow mode and the secondary instability, respectively, was proposed for a transition prediction criterion.
It is evident from previous work that the role of the secondary instability is catalytic in the swept wing transition scenario. Additionally, due to limitations of measurement techniques, the only information on the spatio-temporal characteristics of these modes is available from numerical simulations, theoretical investigations or phase locked measurements. All these approaches though imply artificially imposed unsteady forcing at arbitrary amplitude, which requires opportune calibration.
2.3 Present work
The present study was performed at the Delft University of Technology Aerodynamics laboratories towards experimentally investigating the primary and secondary crossflow instability. A
 $45^{\circ }$
swept wing model was designed following the guidelines set by the ASU and TAMU campaigns (for details see Serpieri & Kotsonis Reference Serpieri and Kotsonis2015a
) and installed in the low turbulence tunnel (LTT). A preliminary flow visualisation campaign was performed to assess the flow evolution and its main stability characteristics (Serpieri & Kotsonis Reference Serpieri and Kotsonis2015b
). These were also inspected by means of LST applied to numerical solutions of the developing boundary layer. Boundary layer measurements by means of hot-wire anemometers and three-component three-dimensional particle image velocimetry (tomographic or tomo-PIV) were performed. Hot-wire scans covered a wider region in space and, given their extremely high temporal resolution, allowed the spectral content of the unsteady fluctuations to be inferred. The tomo-PIV investigation was instead confined to the boundary layer region where the primary stationary waves saturate. Having simultaneous volumetric field data allowed the deployment of powerful data reduction and mode identification techniques such as POD. These techniques greatly enhance the identification and description of the temporal and spatial organisation of the unsteady modes in an experimental framework under natural flow conditions.
$45^{\circ }$
swept wing model was designed following the guidelines set by the ASU and TAMU campaigns (for details see Serpieri & Kotsonis Reference Serpieri and Kotsonis2015a
) and installed in the low turbulence tunnel (LTT). A preliminary flow visualisation campaign was performed to assess the flow evolution and its main stability characteristics (Serpieri & Kotsonis Reference Serpieri and Kotsonis2015b
). These were also inspected by means of LST applied to numerical solutions of the developing boundary layer. Boundary layer measurements by means of hot-wire anemometers and three-component three-dimensional particle image velocimetry (tomographic or tomo-PIV) were performed. Hot-wire scans covered a wider region in space and, given their extremely high temporal resolution, allowed the spectral content of the unsteady fluctuations to be inferred. The tomo-PIV investigation was instead confined to the boundary layer region where the primary stationary waves saturate. Having simultaneous volumetric field data allowed the deployment of powerful data reduction and mode identification techniques such as POD. These techniques greatly enhance the identification and description of the temporal and spatial organisation of the unsteady modes in an experimental framework under natural flow conditions.
The experimental set-ups of the flow visualisation, hot-wire and tomo-PIV experiments are introduced in § 3. The linear stability analysis is presented in § 4. Section 5 is dedicated to the discussion of the boundary layer primary stationary instability. The outcomes of the investigation of the secondary instability are presented in § 6. The conclusions of this study are in § 7.
3 Experimental set-up
In this section an overview of the experimental set-up is given, including the swept wing model and wind tunnel facility. Several coordinate systems necessary for the presentation and interpretation of the results of this study are introduced, followed by a description of the measurement techniques.
3.1 Swept wing model, wind tunnel facility and test conditions
The model used in the current investigation is a swept wing of approximately 1.25 m in span (
 $b$
) with a 1.27 m chord in the free stream direction (
$b$
) with a 1.27 m chord in the free stream direction (
 $c_{X}$
). The sweep angle (
$c_{X}$
). The sweep angle (
 ${\it\Lambda}$
) is
${\it\Lambda}$
) is
 $45^{\circ }$
. The model is made of fibreglass with a very smooth polished surface, featuring a measured value of surface roughness standard deviation of
$45^{\circ }$
. The model is made of fibreglass with a very smooth polished surface, featuring a measured value of surface roughness standard deviation of
 $R_{q}=0.20~{\rm\mu}$
m. The airfoil used is an in-house modified version of the NACA 66018 shape that was named 66018M3J and features a small leading edge radius of approximately 1 % of the chord in order to avoid attachment line instability (Poll Reference Poll1985; Bippes Reference Bippes1999). Until approximately 70 % of the chord, the airfoil shows accelerating flow when at zero incidence, and has no concave surfaces to avoid the amplification of Tollmien–Schlichting (TS) waves and of Görtler vortices, respectively. The airfoil used is shown in figure 1 together with the NACA 66018 on which it was based. It must be stressed that the wing section is presented along the normal to the leading edge direction.
$R_{q}=0.20~{\rm\mu}$
m. The airfoil used is an in-house modified version of the NACA 66018 shape that was named 66018M3J and features a small leading edge radius of approximately 1 % of the chord in order to avoid attachment line instability (Poll Reference Poll1985; Bippes Reference Bippes1999). Until approximately 70 % of the chord, the airfoil shows accelerating flow when at zero incidence, and has no concave surfaces to avoid the amplification of Tollmien–Schlichting (TS) waves and of Görtler vortices, respectively. The airfoil used is shown in figure 1 together with the NACA 66018 on which it was based. It must be stressed that the wing section is presented along the normal to the leading edge direction.

Figure 1. The 66018M3J airfoil used in the present work and comparison with the NACA 66018. Wing sections orthogonal to the leading edge direction.
The wind tunnel where the experiments were performed is the TU Delft LTT facility. This is a closed-loop low turbulence subsonic tunnel with a test section of
 $1.25~\text{m}\times 1.80~\text{m}\times 2.6~\text{m}$
in height, width and length, respectively. The tunnel is furnished with seven anti-turbulence screens and has a contraction ratio of
$1.25~\text{m}\times 1.80~\text{m}\times 2.6~\text{m}$
in height, width and length, respectively. The tunnel is furnished with seven anti-turbulence screens and has a contraction ratio of
 $17:1$
. Turbulence intensity was measured in an empty test section with a single hot-wire sensor at approximately the conditions of the experiment. The acquired signal was bandpass filtered between 2 and 5000 Hz. At the free stream velocity
$17:1$
. Turbulence intensity was measured in an empty test section with a single hot-wire sensor at approximately the conditions of the experiment. The acquired signal was bandpass filtered between 2 and 5000 Hz. At the free stream velocity
 $U_{\infty }=24~\text{m}~\text{s}^{-1}$
the turbulence intensity was found to be
$U_{\infty }=24~\text{m}~\text{s}^{-1}$
the turbulence intensity was found to be
 $Tu/U_{\infty }=0.07\,\%$
. This value is low enough to observe stationary crossflow waves (Bippes Reference Bippes1999; Downs & White Reference Downs and White2013). The background acoustic emission of the tunnel, although considerable, is not relevant to the transition scenario of this type of flow (Deyhle & Bippes Reference Deyhle and Bippes1996; Radeztsky et al.
Reference Radeztsky, Reibert and Saric1999; White & Saric Reference White and Saric2005).
$Tu/U_{\infty }=0.07\,\%$
. This value is low enough to observe stationary crossflow waves (Bippes Reference Bippes1999; Downs & White Reference Downs and White2013). The background acoustic emission of the tunnel, although considerable, is not relevant to the transition scenario of this type of flow (Deyhle & Bippes Reference Deyhle and Bippes1996; Radeztsky et al.
Reference Radeztsky, Reibert and Saric1999; White & Saric Reference White and Saric2005).
The experiment was performed at Mach number
 $M=0.075$
(
$M=0.075$
(
 $U_{\infty }=25.6~\text{m}~\text{s}^{-1}$
) and Reynolds number
$U_{\infty }=25.6~\text{m}~\text{s}^{-1}$
) and Reynolds number
 $Re=2.17\times 10^{6}$
(based on the free stream velocity and streamwise chord) and at incidence angle of
$Re=2.17\times 10^{6}$
(based on the free stream velocity and streamwise chord) and at incidence angle of
 ${\it\alpha}=3^{\circ }$
. The flow over the wing pressure side was investigated. The boundary layer over the wing suction side was forced to a turbulent state close to the leading edge using a tripping wire in order to avoid any unsteady flow separation influencing the measurements on the pressure side.
${\it\alpha}=3^{\circ }$
. The flow over the wing pressure side was investigated. The boundary layer over the wing suction side was forced to a turbulent state close to the leading edge using a tripping wire in order to avoid any unsteady flow separation influencing the measurements on the pressure side.

Figure 2. Pressure coefficient distribution on the wing pressure side measured by two arrays of 46 pressure taps placed at the 25 and 75 % of the wing span (300 mm from top and bottom wind tunnel wall respectively) at
 ${\it\alpha}=3^{\circ }$
and
${\it\alpha}=3^{\circ }$
and
 $Re=2.17\times 10^{6}$
.
$Re=2.17\times 10^{6}$
.
As described in a preliminary work by the authors (Serpieri & Kotsonis Reference Serpieri and Kotsonis2015a
), as well as suggested by Saric et al. (Reference Saric, Reed and White2003), conditions of infinite span swept wing are necessary in order to capture the fundamental features of crossflow-dominated transition. To achieve this condition, the swept wing model used must be able to feature a spanwise-invariant pressure distribution and flow field in the measurement region. In the characterisation work (Serpieri & Kotsonis Reference Serpieri and Kotsonis2015a
), three-dimensional contoured wall liners based on the inviscid streamlines (as done also by e.g. Deyhle & Bippes Reference Deyhle and Bippes1996; Reibert et al.
Reference Reibert, Saric, Carrillo and Chapman1996; Radeztsky et al.
Reference Radeztsky, Reibert and Saric1999; White & Saric Reference White and Saric2005) were designed and used for the case of zero incidence angle. Comparison of pressure distributions with and without liners showed similar results, suggesting that the wing aspect ratio is sufficient to ensure spanwise invariance even in the absence of wall conditioning. For the present experiment (incidence of
 ${\it\alpha}=3^{\circ }$
) the invariance of the flow along the leading edge direction was assessed without the use of liners. Two arrays of 46 streamwise-oriented pressure taps were integrated in the model at approximately 25 and 75 % of the span (300 mm from the tunnel walls). The measured pressure coefficient, for the experiment condition, over the wing pressure side is shown in figure 2. The pressure distributions show a high degree of uniformity without the contoured liners. Furthermore, it is worth noting that, for this flow configuration, the pressure minimum point is at
${\it\alpha}=3^{\circ }$
) the invariance of the flow along the leading edge direction was assessed without the use of liners. Two arrays of 46 streamwise-oriented pressure taps were integrated in the model at approximately 25 and 75 % of the span (300 mm from the tunnel walls). The measured pressure coefficient, for the experiment condition, over the wing pressure side is shown in figure 2. The pressure distributions show a high degree of uniformity without the contoured liners. Furthermore, it is worth noting that, for this flow configuration, the pressure minimum point is at
 $X/c_{X}=0.63$
and thus far downstream of the transition location, as will be shown later. This is a necessary condition for studies on CF instability as it produces boundary layers stable to TS modes.
$X/c_{X}=0.63$
and thus far downstream of the transition location, as will be shown later. This is a necessary condition for studies on CF instability as it produces boundary layers stable to TS modes.
Natural transition pertaining to swept wings manifests as a result of the amplification of a narrow band of crossflow modes. Within the band, small variations in spanwise wavelength can compromise the measurement and interpretation of the developing flow field. It becomes therefore important to fix the dominant mode wavelength in order to enhance the uniformity of the boundary layer. Towards this goal, the technique used by Reibert et al. (Reference Reibert, Saric, Carrillo and Chapman1996) was followed in this work. The primary mode was fixed by forcing a known spanwise wavelength using micron-sized roughness elements. A sequence of small cylindrical elements (rub-on transfers used for etch masking of printed circuit boards) was installed on the model surface close to the leading edge (
 $X/c_{X}=0.025$
). These forcing elements have a diameter of
$X/c_{X}=0.025$
). These forcing elements have a diameter of
 $d=2.8$
mm and an average height of
$d=2.8$
mm and an average height of
 $k=10~{\rm\mu}\text{m}$
. They were installed with a spacing along the leading edge direction (
$k=10~{\rm\mu}\text{m}$
. They were installed with a spacing along the leading edge direction (
 $z$
) of 9 mm. The selected spacing corresponds to the wavelength of the most amplified stationary mode for these conditions according to LST predictions (§ 4) and preliminary flow visualisation studies (Serpieri & Kotsonis Reference Serpieri and Kotsonis2015a
). This forced wavelength will be henceforth denoted with the symbol:
$z$
) of 9 mm. The selected spacing corresponds to the wavelength of the most amplified stationary mode for these conditions according to LST predictions (§ 4) and preliminary flow visualisation studies (Serpieri & Kotsonis Reference Serpieri and Kotsonis2015a
). This forced wavelength will be henceforth denoted with the symbol:
 ${\it\lambda}_{z}^{F}$
. The performed LST analysis indicates that the position of the roughness element array is located slightly upstream of the neutral instability location for the the 9 mm stationary mode (§ 4).
${\it\lambda}_{z}^{F}$
. The performed LST analysis indicates that the position of the roughness element array is located slightly upstream of the neutral instability location for the the 9 mm stationary mode (§ 4).
3.2 Coordinate systems
Due to the complexity of the swept wing geometry and the multitude of measurement techniques used in this study, a rigorous definition of the coordinate systems and of the velocity components is necessary towards correct interpretation of results. The used systems and respective notations are presented in figure 3. Firstly, the wing un-swept coordinate system is introduced and defined with the upper case letters
 $XYZ$
. It is aligned with the wing chords plane and the velocity components along this coordinate system are indicated with upper case letters
$XYZ$
. It is aligned with the wing chords plane and the velocity components along this coordinate system are indicated with upper case letters
 $UVW$
.
$UVW$
.

Figure 3. Schematic of the model and definition of the un-swept (
 $XYZ$
), the swept (
$XYZ$
), the swept (
 $xyz$
) and the local tangential (
$xyz$
) and the local tangential (
 $x_{t}y_{t}z_{t}$
) reference systems. The chord along
$x_{t}y_{t}z_{t}$
) reference systems. The chord along
 $X$
is defined with
$X$
is defined with
 $c_{X}$
and shown with a black dashed line while the chord along
$c_{X}$
and shown with a black dashed line while the chord along
 $x$
, defined with
$x$
, defined with
 $c$
, is plotted with a white dashed line.
$c$
, is plotted with a white dashed line.
The swept wing model is placed at an incidence angle of
 ${\it\alpha}=3^{\circ }$
and, as such, the wind tunnel reference system does not coincide with the un-swept wing coordinates. The velocity components along the wind tunnel reference system are denoted with upper case letters and the subscript (
${\it\alpha}=3^{\circ }$
and, as such, the wind tunnel reference system does not coincide with the un-swept wing coordinates. The velocity components along the wind tunnel reference system are denoted with upper case letters and the subscript (
 $_{\infty }$
), with
$_{\infty }$
), with
 $U_{\infty }$
being the free stream velocity.
$U_{\infty }$
being the free stream velocity.
In figure 3 the swept wing reference system is plotted in grey and is such that its
 $x$
axis is orthogonal to the wing leading edge direction, with
$x$
axis is orthogonal to the wing leading edge direction, with
 $z$
parallel to it (both these axes lie in the chord plane) and
$z$
parallel to it (both these axes lie in the chord plane) and
 $y$
coincides with the un-swept
$y$
coincides with the un-swept
 $Y$
direction. Rotation of
$Y$
direction. Rotation of
 ${\it\Lambda}=45^{\circ }$
about the
${\it\Lambda}=45^{\circ }$
about the
 $Y$
axis transforms the
$Y$
axis transforms the
 $XYZ$
system of coordinates to the swept
$XYZ$
system of coordinates to the swept
 $xyz$
system. Note that in existing literature, some ambiguity with the definition of swept and un-swept exists (see for instance White & Saric Reference White and Saric2005; Tempelmann et al.
Reference Tempelmann, Schrader, Hanifi, Brandt and Henningson2012). In this study the definition of White & Saric (Reference White and Saric2005) is used. The velocity components in this system of coordinates are indicated with the lower case letters
$xyz$
system. Note that in existing literature, some ambiguity with the definition of swept and un-swept exists (see for instance White & Saric Reference White and Saric2005; Tempelmann et al.
Reference Tempelmann, Schrader, Hanifi, Brandt and Henningson2012). In this study the definition of White & Saric (Reference White and Saric2005) is used. The velocity components in this system of coordinates are indicated with the lower case letters
 $uvw$
. The origins of both the
$uvw$
. The origins of both the
 $XYZ$
and
$XYZ$
and
 $xyz$
systems are at the wing leading edge at the mid-span location. In the schematic, the chords in the
$xyz$
systems are at the wing leading edge at the mid-span location. In the schematic, the chords in the
 $XYZ$
(
$XYZ$
(
 $c_{X}$
) and
$c_{X}$
) and
 $xyz$
(
$xyz$
(
 $c$
) systems are indicated with black and white dashed lines respectively.
$c$
) systems are indicated with black and white dashed lines respectively.
 $X/c_{X}$
is used to define the streamwise measurement station as the HWA traverses were mainly along
$X/c_{X}$
is used to define the streamwise measurement station as the HWA traverses were mainly along
 $X$
and at constant
$X$
and at constant
 $Z$
(centred at
$Z$
(centred at
 $Z=0$
). For the LST, the streamwise station is defined with
$Z=0$
). For the LST, the streamwise station is defined with
 $x/c$
as the formulation of the problem is in the swept wing coordinate system. The two definitions of the chordwise locations are equivalent given the semi-infinite swept wing flow assumption.
$x/c$
as the formulation of the problem is in the swept wing coordinate system. The two definitions of the chordwise locations are equivalent given the semi-infinite swept wing flow assumption.
One other coordinate system is the local tangential system where the definition of tangential is simplified as it implies only the surface curvature along the
 $X$
direction. The system is such that the
$X$
direction. The system is such that the
 $x_{t}$
axis is aligned with the local surface tangent, the
$x_{t}$
axis is aligned with the local surface tangent, the
 $y_{t}$
is the wall-normal direction and
$y_{t}$
is the wall-normal direction and
 $z_{t}$
coincides with the
$z_{t}$
coincides with the
 $Z$
axis.
$Z$
axis.
Finally, the reference system of the primary stationary CF vortices is introduced as
 $X_{W}Y_{W}Z_{W}$
. A more detailed description of this coordinate system will be given in the next sections.
$X_{W}Y_{W}Z_{W}$
. A more detailed description of this coordinate system will be given in the next sections.
3.3 Non-dimensionalisation
As evident by the previous discussion, the problem of transition in three-dimensional boundary layers, pertinent to swept wings, is of a complex nature. The multitude of length scales, time scales, measurement techniques and coordinate systems imposes an intriguing problem regarding scaling of the measured variables. Typical for boundary layer flows, a Reynolds-based scaling approach is sought. In such an approach, a reference velocity and reference length are needed. While the free stream velocity is a straightforward choice, the choice for the reference length is, in this case, problematic as no one single parameter can be chosen that can describe the observed phenomena in a consistent and meaningful manner. Possible choices would be the chord of the swept wing, thickness of the boundary layer or spacing of the discrete roughness elements. Choice of chord would lead to inherent inconsistencies with the scales of the investigated primary CF mode, since the latter are locked by the discrete roughness elements. Choice of boundary layer thickness would lead to the collapse of the approximately self-similar laminar boundary layer when comparisons at several chord stations are reported. This choice is not effective in showing the growth of the stationary modes. Finally, choice of the roughness elements spacing as scaling length would lead to inconsistencies between the swept and the stationary CF vortices coordinate systems.
Due to the previous considerations, the choice of using dimensional values for the spatial coordinates is made in this work. This is consistent with several previous investigations of this type of flow (Bippes Reference Bippes1999; Saric et al.
Reference Saric, Reed and White2003; White & Saric Reference White and Saric2005; Downs & White Reference Downs and White2013). It should be noted that the streamwise chord (
 $c_{X}$
) is used throughout as the scaling length for the definition of the Reynolds (
$c_{X}$
) is used throughout as the scaling length for the definition of the Reynolds (
 $Re=c_{X}U_{\infty }/{\it\nu}$
) and Strouhal (
$Re=c_{X}U_{\infty }/{\it\nu}$
) and Strouhal (
 $St=fc_{X}/U_{\infty }$
) numbers.
$St=fc_{X}/U_{\infty }$
) numbers.
3.4 Flow visualisation
Flow visualisation was performed by application of a fluorescent mineral oil on the model surface. The applied mixture consists of paraffin oil (Shell Ondina), petroleum and fluorescent mineral pigments in customised ratios according to the tested velocity regime and flow temperature. In this experiment, the mixture was carefully applied on the model surface in a homogeneous manner, taking care to omit the leading edge region in order not to influence the inception of crossflow instability. Illumination was provided by an ultraviolet (UV) lamp and a digital camera equipped with UV filters was used for imaging.
The distribution of wall shear stresses due to the developing flow are indicated by the formation of patterns in the oil. Areas of intense light emission indicate accumulation of oil which denotes low shear stresses. In contrast, darker areas are formed due to elimination of the oil caused by high shear forces. The primary features elucidated by the technique are the laminar–turbulent transition front and its location. Moreover, quantitative information is also accessible via this technique, such as the spacing (spanwise wavelength) of the developing crossflow modes.
3.5 Hot-wire anemometry
Hot-wire measurements were performed with a single-wire boundary layer probe (Dantec Dynamics P15). A second single-wire probe (Dantec Dynamics P11) performed simultaneous free stream measurements approximately 20 cm away from the boundary layer probe. Both the probes were operated by a TSI IFA-300 constant temperature bridge with automatic overheat ratio adjustment.
The wind tunnel is temperature regulated via a heat exchanger, resulting in minimal temperature drifts over long running periods. Nevertheless, flow temperature was continuously monitored and used to correct the calibrated hot-wire signal. The bridge signals were sampled at a frequency of
 $f_{s}=50$
kHz and filtered using an analog lowpass filter at a cutoff frequency of
$f_{s}=50$
kHz and filtered using an analog lowpass filter at a cutoff frequency of
 $f_{co}=20$
kHz before amplification. Time series of 4 s were recorded at every probe position to ensure statistical convergence.
$f_{co}=20$
kHz before amplification. Time series of 4 s were recorded at every probe position to ensure statistical convergence.
A three degrees-of-freedom automated traverse system was installed in the wind tunnel diffuser, as shown in figure 4. The traverse system is capable of a step resolution of
 $2.5~{\rm\mu}\text{m}$
in all three directions. Hot-wire scans of the developing boundary layer were performed at several stations along the
$2.5~{\rm\mu}\text{m}$
in all three directions. Hot-wire scans of the developing boundary layer were performed at several stations along the
 $X$
direction. Special care was taken to account for the slight inclination of the developing stationary CF waves with respect to the free stream direction.
$X$
direction. Special care was taken to account for the slight inclination of the developing stationary CF waves with respect to the free stream direction.

Figure 4. Schematic of the hot-wire set-up. The flow comes from the right. The automated traverse system, the hot-wire sting and the wing are represented as installed in the LTT facility. The testing chamber is drawn semi-transparent for better visualisation.
Each hot-wire scan consisted of a sequence of point measurements on the local
 $y_{t}$
–
$y_{t}$
–
 $z$
plane located at constant chordwise stations. The boundary layer measurements in the local wall-normal direction (
$z$
plane located at constant chordwise stations. The boundary layer measurements in the local wall-normal direction (
 $y_{t}$
) consisted of 50 equally spaced points in order to fully resolve the development of the wall shear layer. The spacing of the measurement points was selected so as to cover the extent of the boundary layer from near the wall (0.1 times the local external velocity) to the local free stream. Due to the streamwise growth of the boundary layer, the achieved wall-normal resolution varied between 40 and 132
$y_{t}$
) consisted of 50 equally spaced points in order to fully resolve the development of the wall shear layer. The spacing of the measurement points was selected so as to cover the extent of the boundary layer from near the wall (0.1 times the local external velocity) to the local free stream. Due to the streamwise growth of the boundary layer, the achieved wall-normal resolution varied between 40 and 132
 ${\rm\mu}$
m. In the spanwise direction (
${\rm\mu}$
m. In the spanwise direction (
 $z$
) 64 equally spaced boundary layer traverses were conducted for a total of 3200 measurement points per
$z$
) 64 equally spaced boundary layer traverses were conducted for a total of 3200 measurement points per
 $X$
station. The spanwise traverse was 625
$X$
station. The spanwise traverse was 625
 ${\rm\mu}$
m, yielding a total resolved spanwise range of 40 mm. The measured range enabled the resolution of three full CF vortices forced at 9 mm wavelength at all the chord stations.
${\rm\mu}$
m, yielding a total resolved spanwise range of 40 mm. The measured range enabled the resolution of three full CF vortices forced at 9 mm wavelength at all the chord stations.
For the entirety of this study the hot-wire probe was aligned in the global reference system. As such, it was mainly measuring the Euclidean sum of velocity components in the
 $X$
–
$X$
–
 $Y$
plane:
$Y$
plane:
 $|V^{HWA}|=(U^{2}+V^{2})^{1/2}$
. The hot-wire probes were calibrated in situ every 24 h. The maximum error in the sensor calibration is estimated to be lower than 4 %.
$|V^{HWA}|=(U^{2}+V^{2})^{1/2}$
. The hot-wire probes were calibrated in situ every 24 h. The maximum error in the sensor calibration is estimated to be lower than 4 %.
3.6 Tomographic PIV
Tomographic PIV (Elsinga et al.
Reference Elsinga, Scarano, Wieneke and van Oudheusden2006) was selected to measure the instantaneous distribution of the velocity vector and the velocity gradient tensor in the three-dimensional domain of interest. The flow was seeded homogeneously by water–glycol droplets of average diameter of
 $1~{\rm\mu}$
m. The droplets were produced with a SAFEX fog generator with seeding inlet downstream of the test section, which minimizes disturbances. Illumination was provided by a Quantel Evergreen Nd:YAG dual cavity laser (200 mJ pulse energy). The laser light was introduced from a transparent port in the bottom wall of the test section. Light sheet optics were used to shape the beam into a sheet 50 mm wide and 4 mm thick along the wall-normal direction. The imaging system comprised of four LaVision Imager LX CCD cameras (16 Mpixels, 12 bits, pixel size
$1~{\rm\mu}$
m. The droplets were produced with a SAFEX fog generator with seeding inlet downstream of the test section, which minimizes disturbances. Illumination was provided by a Quantel Evergreen Nd:YAG dual cavity laser (200 mJ pulse energy). The laser light was introduced from a transparent port in the bottom wall of the test section. Light sheet optics were used to shape the beam into a sheet 50 mm wide and 4 mm thick along the wall-normal direction. The imaging system comprised of four LaVision Imager LX CCD cameras (16 Mpixels, 12 bits, pixel size
 $7.4~{\rm\mu}$
m). The cameras were equipped with 200 mm focal length Nikon Micro-Nikkor objectives. The numerical aperture was set to
$7.4~{\rm\mu}$
m). The cameras were equipped with 200 mm focal length Nikon Micro-Nikkor objectives. The numerical aperture was set to
 $f_{\sharp }=8$
to obtain focused particle images across the full depth of the measurement domain. A lens-tilt mechanism was used to comply with the Scheimpflug condition with a plane of focus corresponding to the median adapters. The cameras were installed outside the wind tunnel test section with a tomographic aperture that subtended an arc of
$f_{\sharp }=8$
to obtain focused particle images across the full depth of the measurement domain. A lens-tilt mechanism was used to comply with the Scheimpflug condition with a plane of focus corresponding to the median adapters. The cameras were installed outside the wind tunnel test section with a tomographic aperture that subtended an arc of
 $60^{\circ }$
. The set-up is presented in the schematic of figure 5.
$60^{\circ }$
. The set-up is presented in the schematic of figure 5.

Figure 5. Schematic of the tomo-PIV set-up. The flow comes from the right. The four cameras (outside the tunnel looking through the optical window), the laser head (beneath the testing chamber), the laser light (entering vertically in the testing chamber) and the wing are represented as installed in the LTT facility. The testing chamber is drawn semi-transparent for better visualisation.
The active area of the cameras sensors was reduced to
 $1700\times 1700~\text{px}^{2}$
, due to illumination constraints. The cameras were placed at a distance of approximately 1 m from the surface of the model and the imaged volume was
$1700\times 1700~\text{px}^{2}$
, due to illumination constraints. The cameras were placed at a distance of approximately 1 m from the surface of the model and the imaged volume was
 $50\times 50\times 4~\text{mm}^{3}$
, centred at
$50\times 50\times 4~\text{mm}^{3}$
, centred at
 $X/c_{X}=0.45$
. The magnification factor for this experiment was 0.25. The time separation between laser pulses was set to 22
$X/c_{X}=0.45$
. The magnification factor for this experiment was 0.25. The time separation between laser pulses was set to 22
 ${\rm\mu}$
s, returning a particle image displacement of 20 pixels (0.6 mm) in the flow outside of the boundary layer. The large displacement ensures a relatively high dynamic range of the velocity measurement (Adrian & Westerweel Reference Adrian and Westerweel2011), which is suited to enable the measurement of the weak velocity components in planes orthogonal to the streamwise direction. However, it compromises the measurement of the highly sheared regions close to the wall due to the distortion of the particle image pattern beyond
${\rm\mu}$
s, returning a particle image displacement of 20 pixels (0.6 mm) in the flow outside of the boundary layer. The large displacement ensures a relatively high dynamic range of the velocity measurement (Adrian & Westerweel Reference Adrian and Westerweel2011), which is suited to enable the measurement of the weak velocity components in planes orthogonal to the streamwise direction. However, it compromises the measurement of the highly sheared regions close to the wall due to the distortion of the particle image pattern beyond
 $0.5~\text{pixels}~\text{pixel}^{-1}$
(Scarano Reference Scarano2002), as it will be discussed in later sections. A dual layer target was used for the calibration of the tomographic imaging system. The obtained object-to-image space mapping function was corrected using the volume self-calibration procedure (Wieneke Reference Wieneke2008) available in the LaVision software DaVis 8 thus reducing the calibration uncertainty to less than 0.1 px.
$0.5~\text{pixels}~\text{pixel}^{-1}$
(Scarano Reference Scarano2002), as it will be discussed in later sections. A dual layer target was used for the calibration of the tomographic imaging system. The obtained object-to-image space mapping function was corrected using the volume self-calibration procedure (Wieneke Reference Wieneke2008) available in the LaVision software DaVis 8 thus reducing the calibration uncertainty to less than 0.1 px.

Figure 6. Schematic of the imaged tomo-PIV volume and of the reference system (
 $X_{W}Y_{W}Z_{W}$
) aligned with the stationary CF vortices (indicated in red). The dashed line is parallel to the leading edge direction and shows the position of the volume, centred at
$X_{W}Y_{W}Z_{W}$
) aligned with the stationary CF vortices (indicated in red). The dashed line is parallel to the leading edge direction and shows the position of the volume, centred at
 $X/c_{X}=0.45$
. The flow comes from right. The light grey background represents the model surface.
$X/c_{X}=0.45$
. The flow comes from right. The light grey background represents the model surface.
Image acquisition, preprocessing, volume reconstruction and frame correlation were performed with LaVision Davis 8. The raw images were preprocessed reducing the background intensity caused by laser light reflection from the wing surface. Volume reconstruction and correlation were performed in a dedicated coordinate system, aligned with the stationary crossflow vortices (
 $X_{W}Y_{W}Z_{W}$
). This system is presented in figure 6 along with the dimensions of the volume. It must be noted that a mild natural inclination of the stationary vortices with respect to the
$X_{W}Y_{W}Z_{W}$
). This system is presented in figure 6 along with the dimensions of the volume. It must be noted that a mild natural inclination of the stationary vortices with respect to the
 $X$
direction is expected. An estimation of this inclination angle (
$X$
direction is expected. An estimation of this inclination angle (
 ${\it\Psi}$
) is presented in §§ 5.1 and 4. Due to the small curvature of the wing at the station centred with the tomo-PIV volume (compare with the wing section presented in figure 1), the
${\it\Psi}$
) is presented in §§ 5.1 and 4. Due to the small curvature of the wing at the station centred with the tomo-PIV volume (compare with the wing section presented in figure 1), the
 $Y_{W}$
axis (normal to the chord plane) is practically aligned with the local wall-normal direction (
$Y_{W}$
axis (normal to the chord plane) is practically aligned with the local wall-normal direction (
 $y_{t}|_{0.45c_{X}}\equiv Y_{W}$
). For the remainder of this study these two directions will be considered identical.
$y_{t}|_{0.45c_{X}}\equiv Y_{W}$
). For the remainder of this study these two directions will be considered identical.
For the volume reconstruction, the CSMART algorithm was used. The spatial cross-correlation was performed in the Fourier domain and with final interrogation volume size of
 $2.6\times 0.67\times 0.67~\text{mm}^{3}$
in the
$2.6\times 0.67\times 0.67~\text{mm}^{3}$
in the
 $X_{W}$
,
$X_{W}$
,
 $Z_{W}$
and
$Z_{W}$
and
 $Y_{W}$
directions respectively. The relative overlap of adjacent interrogation volumes was set to 75 % for an accurate estimate of the velocity fields. The final vector field was interpolated on a grid with a uniform spacing of 0.15 mm in all three directions. This length, corresponding to the final vector spacing along
$Y_{W}$
directions respectively. The relative overlap of adjacent interrogation volumes was set to 75 % for an accurate estimate of the velocity fields. The final vector field was interpolated on a grid with a uniform spacing of 0.15 mm in all three directions. This length, corresponding to the final vector spacing along
 $Y_{W}$
and
$Y_{W}$
and
 $Z_{W}$
, implies interpolation only along
$Z_{W}$
, implies interpolation only along
 $X_{W}$
. After volume reconstruction and correlation, the final resolved domain narrowed to
$X_{W}$
. After volume reconstruction and correlation, the final resolved domain narrowed to
 $35\times 35\times 3~\text{mm}^{3}$
.
$35\times 35\times 3~\text{mm}^{3}$
.
The measurements comprise 500 sets of image pairs acquired at a rate of 0.5 Hz. The uncertainty associated with the instantaneous velocity measurements is estimated to be 0.3 voxels, following Lynch & Scarano (Reference Lynch and Scarano2014), therefore the relative random error, considering the free stream displacement of 20 voxels, is approximately 1.5 %. The uncertainty on the mean velocity will be dominated by the ensemble size. In fact, given the sampling rate for this measurement and the characteristic frequencies of the expected unsteady flow phenomena, the instantaneous fields are not correlated in time. The relative error of the time-averaged field (
 ${\it\varepsilon}_{\bar{u}}$
) is equal to the amplitude of flow root-mean-square (r.m.s.) fluctuations (estimated to be below 10 %) divided by the square root of the ensemble size:
${\it\varepsilon}_{\bar{u}}$
) is equal to the amplitude of flow root-mean-square (r.m.s.) fluctuations (estimated to be below 10 %) divided by the square root of the ensemble size:
 ${\it\varepsilon}_{\bar{u}}<0.1/\sqrt{500}\approx 0.45\,\%$
. The relative error of the r.m.s. fluctuation field (
${\it\varepsilon}_{\bar{u}}<0.1/\sqrt{500}\approx 0.45\,\%$
. The relative error of the r.m.s. fluctuation field (
 ${\it\varepsilon}_{u^{\prime }}$
) is dominated by the r.m.s. bias due to random errors that will not average out, therefore an estimation of this error leads to:
${\it\varepsilon}_{u^{\prime }}$
) is dominated by the r.m.s. bias due to random errors that will not average out, therefore an estimation of this error leads to:
 ${\it\varepsilon}_{u^{\prime }}=1.5\,\%$
.
${\it\varepsilon}_{u^{\prime }}=1.5\,\%$
.
4 Linear stability theory
LST has been traditionally used in crossflow instability studies (e.g. Reibert et al. Reference Reibert, Saric, Carrillo and Chapman1996; Arnal, Gasparian & Salinas Reference Arnal, Gasparian and Salinas1998; Högberg & Henningson Reference Högberg and Henningson1998; Malik et al. Reference Malik, Li, Choudhari and Chang1999; Haynes & Reed Reference Haynes and Reed2000) as a tool to predict the onset of the primary modes, the wavelengths and directions and the frequencies and spatial growths.
Following this approach, a two-dimensional disturbance linear stability problem was solved in the spatial formulation for the boundary layer over the wing pressure side. Boundary layer disturbances are expressed in the form of a wave with two-dimensional wavenumber vector as described in (4.1). According to the spatial formulation, the streamwise and spanwise wavenumbers (
 ${\it\alpha}$
and
${\it\alpha}$
and
 ${\it\beta}$
respectively) are complex and the angular frequency (
${\it\beta}$
respectively) are complex and the angular frequency (
 ${\it\omega}$
) is real,
${\it\omega}$
) is real,
 ${\it\phi}(y)$
is the perturbation eigenfunction.
${\it\phi}(y)$
is the perturbation eigenfunction.
 $$\begin{eqnarray}{\it\psi}(x,y,z,t)={\it\phi}(y)\text{e}^{\text{i}({\it\alpha}x+{\it\beta}z-{\it\omega}t)}.\end{eqnarray}$$
Similar to the work by Malik et al. (Reference Malik, Li, Choudhari and Chang1999) and Tempelmann et al. (Reference Tempelmann, Schrader, Hanifi, Brandt and Henningson2012), the laminar boundary layer pertaining to the measured pressure distribution (presented in figure 2) was computed. A boundary layer solver was developed based on the steady incompressible boundary layer equations. The Crank–Nicholson implicit discretisation was employed for the marching scheme (see Schlichting & Gersten Reference Schlichting and Gersten2000 for the formulation). The code was validated by comparison with analytic Falkner–Skan–Cooke solutions. Furthermore, comparison of the computed boundary layer with experimental data is presented later in § 5.3. A thorough description of LST for two-dimensional disturbances can be found in Mack (Reference Mack1984) and in Högberg & Henningson (Reference Högberg and Henningson1998). Notwithstanding what is suggested by Mack, the stability equations are solved here in the swept wing coordinate system (
 $xyz$
). In this formulation, the invariance of the flow along the spanwise direction simplifies the solution of the problem allowing the assumption of null growth rates along the
$xyz$
). In this formulation, the invariance of the flow along the spanwise direction simplifies the solution of the problem allowing the assumption of null growth rates along the
 $z$
direction (i.e.
$z$
direction (i.e.
 ${\it\beta}_{i}=0$
). With this formulation, the amplification
${\it\beta}_{i}=0$
). With this formulation, the amplification
 $N$
-factor of a mode with given frequency and
$N$
-factor of a mode with given frequency and
 $z$
-wavelength (
$z$
-wavelength (
 ${\it\lambda}_{z}=2{\rm\pi}/{\it\beta}_{r}$
) is evaluated by computing the integral of (4.2), where
${\it\lambda}_{z}=2{\rm\pi}/{\it\beta}_{r}$
) is evaluated by computing the integral of (4.2), where
 $x_{0}$
is the first unstable station for the considered mode. The Orr–Sommerfeld (OS) equation is solved with the Chebyshev collocation method, using 100 polynomials, while the nonlinearity to the eigenvalue is treated following the companion matrix technique of Bridges & Morris (Reference Bridges and Morris1984).
$x_{0}$
is the first unstable station for the considered mode. The Orr–Sommerfeld (OS) equation is solved with the Chebyshev collocation method, using 100 polynomials, while the nonlinearity to the eigenvalue is treated following the companion matrix technique of Bridges & Morris (Reference Bridges and Morris1984).
 $$\begin{eqnarray}N(x,{\it\lambda}_{z},{\it\omega})=\int _{x_{0}({\it\lambda}_{z},{\it\omega})}^{x}-{\it\alpha}_{i}({\it\zeta},{\it\lambda}_{z},{\it\omega})\,\text{d}{\it\zeta}.\end{eqnarray}$$

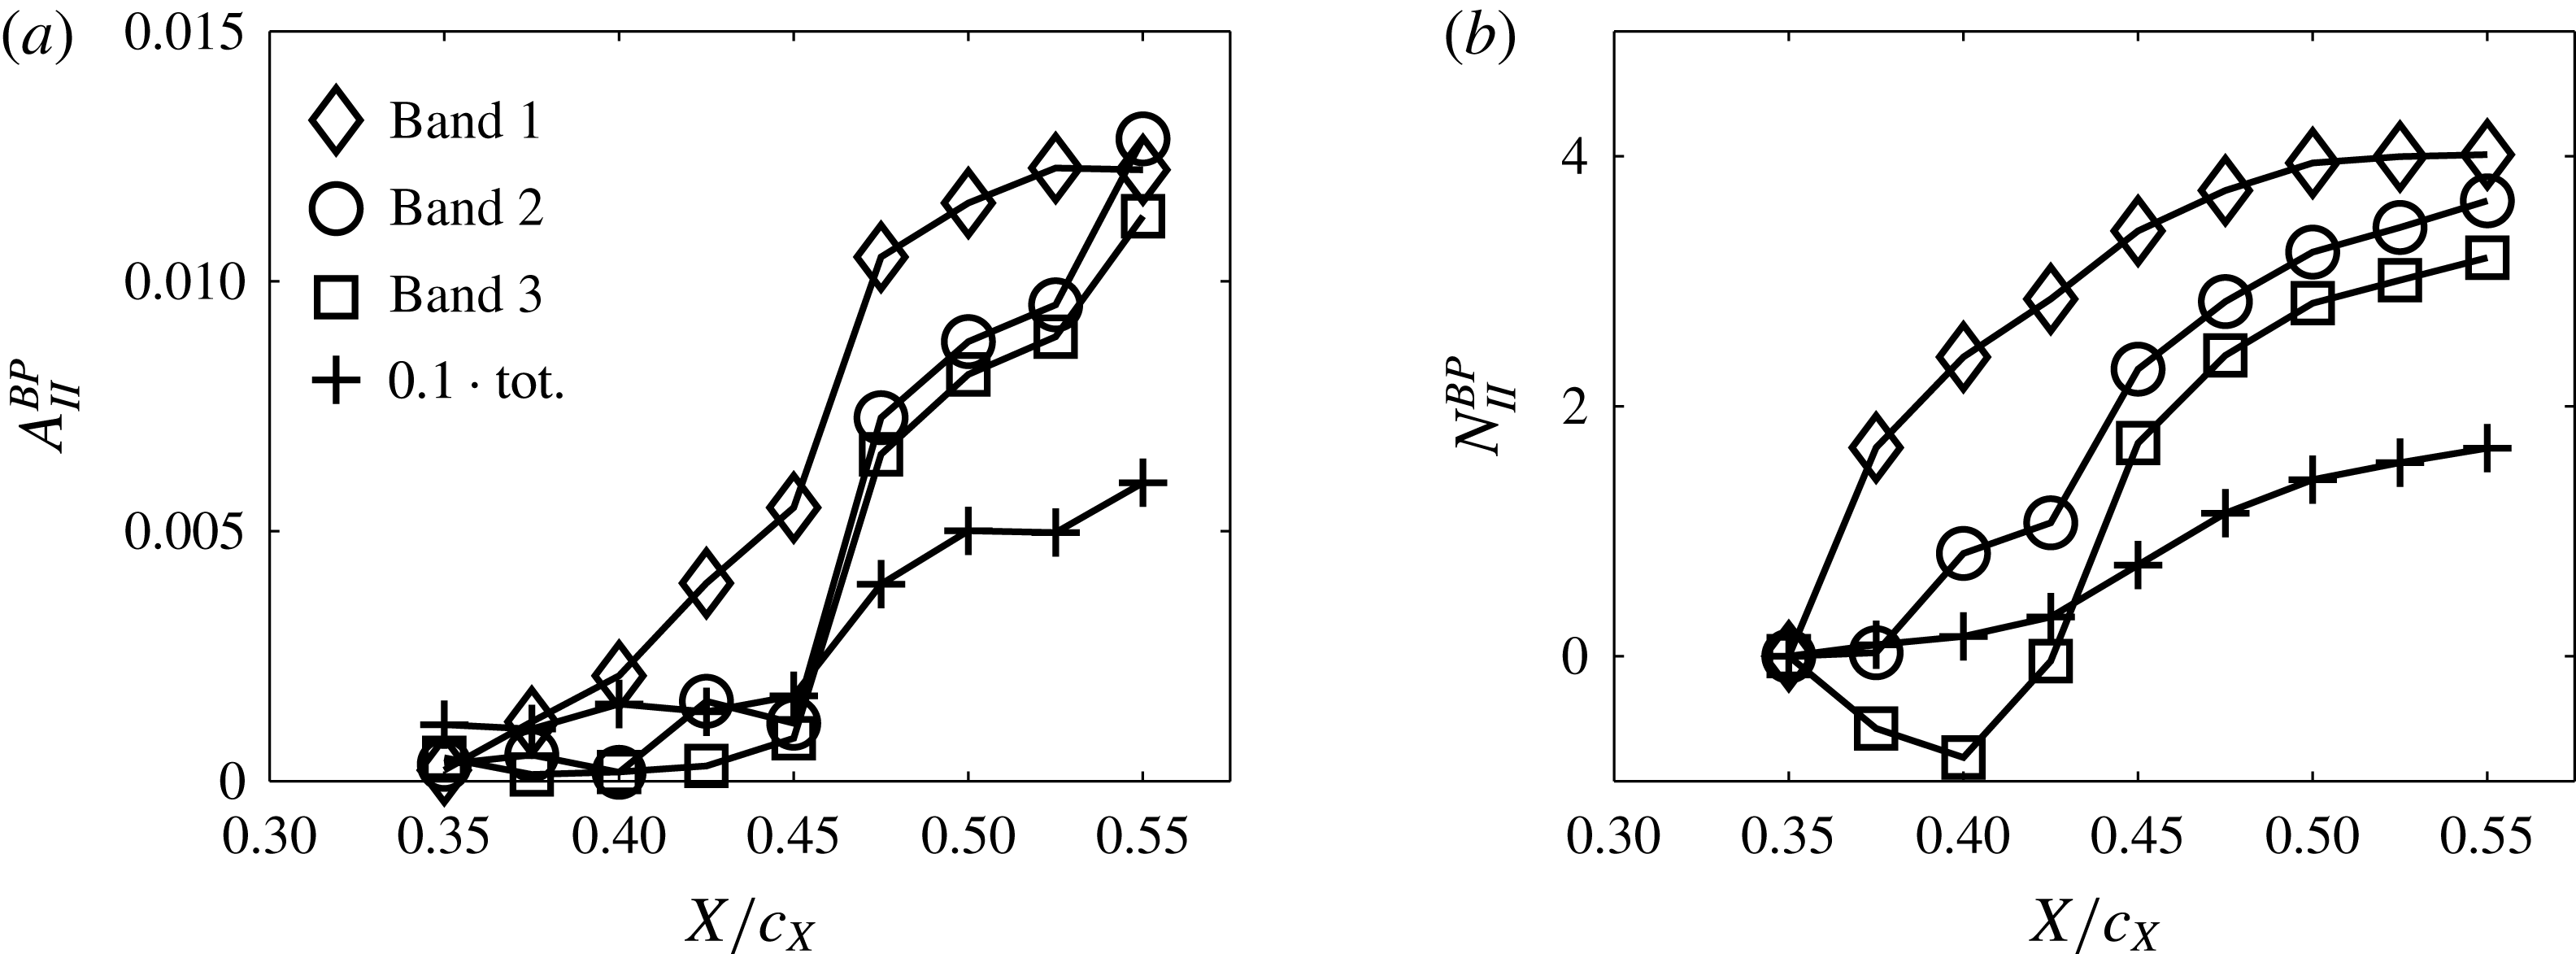
Figure 7. LST analysis for the flow case of figure 2. (a)
 $N$
-factors, as the envelope of all the modes with constant
$N$
-factors, as the envelope of all the modes with constant
 ${\it\lambda}_{z}$
, of the stationary mode (○:
${\it\lambda}_{z}$
, of the stationary mode (○:
 $St=0$
(
$St=0$
(
 $f=0$
Hz)) and two travelling modes (▫:
$f=0$
Hz)) and two travelling modes (▫:
 $St=5.0$
(
$St=5.0$
(
 $f=100$
Hz); ♢:
$f=100$
Hz); ♢:
 $St=14.9$
(
$St=14.9$
(
 $f=300$
Hz)). (b)
$f=300$
Hz)). (b)
 $N$
-factors of the stationary modes versus
$N$
-factors of the stationary modes versus
 ${\it\lambda}_{z}$
at
${\it\lambda}_{z}$
at
 $x/c=0.45$
. The mode corresponding to the maximum amplification (
$x/c=0.45$
. The mode corresponding to the maximum amplification (
 ${\it\lambda}_{z}=9.10$
mm) is indicated with the dotted line. (c)
${\it\lambda}_{z}=9.10$
mm) is indicated with the dotted line. (c)
 $N$
-factors (○) and wavenumber vector angle with respect to the
$N$
-factors (○) and wavenumber vector angle with respect to the
 $x$
direction (♢) of the
$x$
direction (♢) of the
 ${\it\lambda}_{z}=9$
mm stationary mode. Mode critical location (
${\it\lambda}_{z}=9$
mm stationary mode. Mode critical location (
 $x_{cr}$
) (dotted line) and position of the forcing roughness (
$x_{cr}$
) (dotted line) and position of the forcing roughness (
 $x_{f}$
) (dashed line). (d) Schematic of the wavenumber vector angle with respect to the
$x_{f}$
) (dashed line). (d) Schematic of the wavenumber vector angle with respect to the
 $xyz$
coordinate system (
$xyz$
coordinate system (
 ${\it\Psi}^{\ast }$
).
${\it\Psi}^{\ast }$
).
A comparison between the stationary CF modes and travelling modes characterised by Strouhal numbers of
 $St=4.97$
(
$St=4.97$
(
 $f=100$
Hz) and
$f=100$
Hz) and
 $St=14.9$
(
$St=14.9$
(
 $f=300$
Hz) is presented in figure 7(a). The relative
$f=300$
Hz) is presented in figure 7(a). The relative
 $N$
-factors (
$N$
-factors (
 $N$
) are computed with respect to the first evaluated station (
$N$
) are computed with respect to the first evaluated station (
 $x_{0}/c=0.05$
) and considering the envelope of all the unstable modes with constant
$x_{0}/c=0.05$
) and considering the envelope of all the unstable modes with constant
 ${\it\lambda}_{z}$
, as in (4.3) (cf. Arnal et al.
Reference Arnal, Gasparian and Salinas1998)
${\it\lambda}_{z}$
, as in (4.3) (cf. Arnal et al.
Reference Arnal, Gasparian and Salinas1998)
 $$\begin{eqnarray}N^{env}(x,{\it\omega})=\max |_{{\it\lambda}_{z}}(N(x,{\it\lambda}_{z},{\it\omega})).\end{eqnarray}$$
Previous studies have shown the formation and growth of travelling waves is dramatically affected by the receptivity to the free stream turbulence (Deyhle & Bippes Reference Deyhle and Bippes1996; Bippes Reference Bippes1999; Downs & White Reference Downs and White2013). Despite the low turbulence intensity of the used facility, it is likely that travelling modes within the inspected frequency band will also be amplified in the boundary layer along with the primary stationary CF modes.
 $N$
-factors as a function of the spanwise wavelength (
$N$
-factors as a function of the spanwise wavelength (
 ${\it\lambda}_{z}$
) computed at
${\it\lambda}_{z}$
) computed at
 $x/c=0.45$
, for stationary crossflow modes, are presented in figure 7(b). The most amplified CF mode features a spanwise wavelength of
$x/c=0.45$
, for stationary crossflow modes, are presented in figure 7(b). The most amplified CF mode features a spanwise wavelength of
 ${\it\lambda}_{z}=9.10$
mm. Based on this preliminary prediction, as well as from earlier flow visualisation experiments described in Serpieri & Kotsonis (Reference Serpieri and Kotsonis2015b
), the spanwise wavelength of 9 mm has been chosen for spacing the leading edge roughness elements. This wavelength will be considered from now on as the primary CF mode for the tested conditions.
${\it\lambda}_{z}=9.10$
mm. Based on this preliminary prediction, as well as from earlier flow visualisation experiments described in Serpieri & Kotsonis (Reference Serpieri and Kotsonis2015b
), the spanwise wavelength of 9 mm has been chosen for spacing the leading edge roughness elements. This wavelength will be considered from now on as the primary CF mode for the tested conditions.
The
 $N$
-factors of the stationary mode with
$N$
-factors of the stationary mode with
 ${\it\lambda}_{z}=9$
mm along with the wavenumber vector angle with respect to the
${\it\lambda}_{z}=9$
mm along with the wavenumber vector angle with respect to the
 $x$
direction (
$x$
direction (
 ${\it\Psi}^{\ast }$
, see figure 7
d) are presented in figure 7(c). LST predicts the onset (neutral point) of the 9 mm stationary mode at
${\it\Psi}^{\ast }$
, see figure 7
d) are presented in figure 7(c). LST predicts the onset (neutral point) of the 9 mm stationary mode at
 $x/c=0.058$
and shows a linear monotonic growth from
$x/c=0.058$
and shows a linear monotonic growth from
 $x/c=0.10$
up to the most downstream station considered in this analysis. As previously mentioned, the roughness array in the experiment is placed at
$x/c=0.10$
up to the most downstream station considered in this analysis. As previously mentioned, the roughness array in the experiment is placed at
 $x/c=0.025$
. This is slightly upstream of the neutral stability point for the forced mode (cf. figure 7
c) (Reibert et al.
Reference Reibert, Saric, Carrillo and Chapman1996). Despite these considerations, the neutral point is only roughly estimated by this analysis as neither the boundary layer code nor the OS solver account for the surface curvature of the model, which is non-negligible close to the leading edge. Nevertheless, preliminary wind tunnel experiments confirmed the effectiveness of the applied stationary forcing in inducing the desired mode (Serpieri & Kotsonis Reference Serpieri and Kotsonis2015b
). The waves angle results to an average value of approximately
$x/c=0.025$
. This is slightly upstream of the neutral stability point for the forced mode (cf. figure 7
c) (Reibert et al.
Reference Reibert, Saric, Carrillo and Chapman1996). Despite these considerations, the neutral point is only roughly estimated by this analysis as neither the boundary layer code nor the OS solver account for the surface curvature of the model, which is non-negligible close to the leading edge. Nevertheless, preliminary wind tunnel experiments confirmed the effectiveness of the applied stationary forcing in inducing the desired mode (Serpieri & Kotsonis Reference Serpieri and Kotsonis2015b
). The waves angle results to an average value of approximately
 ${\it\Psi}^{\ast }=47^{\circ }$
. For a sweep angle of
${\it\Psi}^{\ast }=47^{\circ }$
. For a sweep angle of
 $45^{\circ }$
, the wavefronts, away from the leading edge region, are predicted to be roughly aligned with the free stream direction with only a slight inclination (
$45^{\circ }$
, the wavefronts, away from the leading edge region, are predicted to be roughly aligned with the free stream direction with only a slight inclination (
 ${\it\Psi}={\it\Psi}^{\ast }-{\it\Lambda}\approx 2^{\circ }$
).
${\it\Psi}={\it\Psi}^{\ast }-{\it\Lambda}\approx 2^{\circ }$
).
LST estimates continuous growth for these modes and no saturation of the primary instability is found. This is in agreement with the theoretical limits of LST, where non-parallel effects and nonlinear interactions have not been accounted for (Arnal et al. Reference Arnal, Gasparian and Salinas1998; Högberg & Henningson Reference Högberg and Henningson1998; Haynes & Reed Reference Haynes and Reed2000).
5 Primary instability
The evolution of the primary stationary mode is described by means of flow visualisation, hot-wire boundary layer scans and tomo-PIV measurements. The results are presented in the following three subsections, respectively.
5.1 Surface flow visualisation
A detail centred on the wing mid-chord station of the flow visualisation test is presented in figure 8. Stationary mode critical forcing at
 ${\it\lambda}_{z}^{F}=9$
mm has been applied. The flow direction is from right to left, as indicated. The boundary layer transitions from laminar to turbulent as evident from the change in surface oil concentration. The characteristic transition front with a jagged pattern of turbulent wedges pertinent to this type of boundary layers is clearly visible (Saric et al.
Reference Saric, Reed and White2003). Despite the spanwise uniform forcing via the discrete roughness elements, the transition front is highly modulated. As such, the location of transition can only be estimated based on a spanwise average simplification. It is estimated to occur at approximately
${\it\lambda}_{z}^{F}=9$
mm has been applied. The flow direction is from right to left, as indicated. The boundary layer transitions from laminar to turbulent as evident from the change in surface oil concentration. The characteristic transition front with a jagged pattern of turbulent wedges pertinent to this type of boundary layers is clearly visible (Saric et al.
Reference Saric, Reed and White2003). Despite the spanwise uniform forcing via the discrete roughness elements, the transition front is highly modulated. As such, the location of transition can only be estimated based on a spanwise average simplification. It is estimated to occur at approximately
 $X/c_{X}=0.50$
. Notwithstanding the care in applying the oil film on the surface, this estimate has to be considered as only an indication of the transition location because the layer of oil can be a source of slight alterations in the transition process.
$X/c_{X}=0.50$
. Notwithstanding the care in applying the oil film on the surface, this estimate has to be considered as only an indication of the transition location because the layer of oil can be a source of slight alterations in the transition process.

Figure 8. Fluorescent oil visualisation of the transition region. The flow comes from the right. The
 $X_{W}Y_{W}Z_{W}$
system is rotated by
$X_{W}Y_{W}Z_{W}$
system is rotated by
 ${\it\Psi}=5^{\circ }$
about the
${\it\Psi}=5^{\circ }$
about the
 $Y_{W}\equiv Y$
axis with respect to the
$Y_{W}\equiv Y$
axis with respect to the
 $XYZ$
system. A reference line of 9 mm length is plotted in the
$XYZ$
system. A reference line of 9 mm length is plotted in the
 $z$
direction. The two grey lines indicate two streamwise stations.
$z$
direction. The two grey lines indicate two streamwise stations.
At this location the envelope of the stationary modes reached a magnitude of
 $N^{env}|_{x/c=0.50}=2.88$
and the
$N^{env}|_{x/c=0.50}=2.88$
and the
 $N$
-factor of the 9 mm stationary mode is
$N$
-factor of the 9 mm stationary mode is
 $N=2.86$
. These values are lower compared to the results of the ASU studies (Reibert et al.
Reference Reibert, Saric, Carrillo and Chapman1996; Haynes & Reed Reference Haynes and Reed2000), indicating stronger growth of the primary modes. It must be noted here that without roughness elements, the transition occurs at approximately 65 % of the chord, which is downstream of the minimum pressure point (Serpieri & Kotsonis Reference Serpieri and Kotsonis2015b
). Transition at this location is dominated by the formation of laminar separation and cannot be used for the definition of a CF instability-dominated transition
$N=2.86$
. These values are lower compared to the results of the ASU studies (Reibert et al.
Reference Reibert, Saric, Carrillo and Chapman1996; Haynes & Reed Reference Haynes and Reed2000), indicating stronger growth of the primary modes. It must be noted here that without roughness elements, the transition occurs at approximately 65 % of the chord, which is downstream of the minimum pressure point (Serpieri & Kotsonis Reference Serpieri and Kotsonis2015b
). Transition at this location is dominated by the formation of laminar separation and cannot be used for the definition of a CF instability-dominated transition
 $N$
-factor. Instead, at
$N$
-factor. Instead, at
 $Re=2.55\times 10^{6}$
and
$Re=2.55\times 10^{6}$
and
 ${\it\alpha}=3^{\circ }$
, transition for a clean configuration occurs at
${\it\alpha}=3^{\circ }$
, transition for a clean configuration occurs at
 $x/c=0.58$
(Serpieri & Kotsonis Reference Serpieri and Kotsonis2015b
). The critical envelope
$x/c=0.58$
(Serpieri & Kotsonis Reference Serpieri and Kotsonis2015b
). The critical envelope
 $N$
-factor for this flow is
$N$
-factor for this flow is
 $N_{cr}^{env}=4.22$
. The most amplified stationary mode in these conditions features a wavelength of
$N_{cr}^{env}=4.22$
. The most amplified stationary mode in these conditions features a wavelength of
 ${\it\lambda}_{z}=8.30$
mm.
${\it\lambda}_{z}=8.30$
mm.
The presence of the PIV seeding particles in the flow did not appear to result in any changes in the transition pattern. A comparison between the tomo-PIV and the HWA velocity fields, presented later in § 5.4, further confirms this.
A second prominent feature revealed by the oil flow test are the streaks caused by the stationary CF modes. These are locked to the 9 mm wavelength of the discrete roughness elements. Compared to cases of non-forced boundary layers, these streaks appear more uniform in both their streamwise onset and spanwise spacing (Reibert et al. Reference Reibert, Saric, Carrillo and Chapman1996; Kawakami et al. Reference Kawakami, Kohama and Okutsu1999; Serpieri & Kotsonis Reference Serpieri and Kotsonis2015b ). This behaviour is indicative of the strong conditioning of CF vortices by initial amplitude effects, related further to receptivity processes near the leading edge.
Two reference systems are also shown in figure 8. These are the un-swept reference system (
 $XYZ$
) and the stationary crossflow mode reference system (
$XYZ$
) and the stationary crossflow mode reference system (
 $X_{W}Y_{W}Z_{W}$
). In order to move from one system of coordinates to the other, a rotation of
$X_{W}Y_{W}Z_{W}$
). In order to move from one system of coordinates to the other, a rotation of
 ${\it\Psi}=5^{\circ }$
about the coincident
${\it\Psi}=5^{\circ }$
about the coincident
 $Y\equiv Y_{W}$
axes is required (as discussed in § 3.6). The magnitude of the angle
$Y\equiv Y_{W}$
axes is required (as discussed in § 3.6). The magnitude of the angle
 ${\it\Psi}$
is, within a few degrees, in agreement with the predictions of linear stability theory (figure 7
c). This angle is not constant along the chord and is approximately inferred by this technique. Nevertheless, the value of
${\it\Psi}$
is, within a few degrees, in agreement with the predictions of linear stability theory (figure 7
c). This angle is not constant along the chord and is approximately inferred by this technique. Nevertheless, the value of
 $5^{\circ }$
for the region centred at
$5^{\circ }$
for the region centred at
 $X/c_{X}=0.45$
is an acceptable estimate and will be used for the coordinate system of the tomo-PIV experiment.
$X/c_{X}=0.45$
is an acceptable estimate and will be used for the coordinate system of the tomo-PIV experiment.
5.2 Hot-wire measurements
The hot-wire probe was aligned so as to measure mainly the Euclidean sum of the
 $U$
and
$U$
and
 $V$
velocity components (
$V$
velocity components (
 $|V^{HWA}|$
) (i.e. aligned with
$|V^{HWA}|$
) (i.e. aligned with
 $Z$
). The automated traverse was programmed to shift the probe in the local
$Z$
). The automated traverse was programmed to shift the probe in the local
 $y_{t}$
–
$y_{t}$
–
 $z$
plane at the selected
$z$
plane at the selected
 $X/c_{X}$
stations. As shown in figure 8, the primary crossflow waves are inclined with a small angle with respect to the free stream direction. This was taken into account for the hot-wire scans in order to correctly follow the evolution of the individual CF modes both in the streamwise and spanwise areas of interest.
$X/c_{X}$
stations. As shown in figure 8, the primary crossflow waves are inclined with a small angle with respect to the free stream direction. This was taken into account for the hot-wire scans in order to correctly follow the evolution of the individual CF modes both in the streamwise and spanwise areas of interest.
The most upstream
 $X$
station where hot-wire scans are performed is at
$X$
station where hot-wire scans are performed is at
 $X/c_{X}=0.15$
while the most downstream is located in the fully turbulent region at
$X/c_{X}=0.15$
while the most downstream is located in the fully turbulent region at
 $X/c_{X}=0.55$
. Contours of time-averaged velocity (denoted with the bar symbol), non-dimensionalised with the time-averaged local external velocity (
$X/c_{X}=0.55$
. Contours of time-averaged velocity (denoted with the bar symbol), non-dimensionalised with the time-averaged local external velocity (
 $|\bar{V}_{e}^{HWA}|$
), for six streamwise stations are presented in figure 9. Velocity contours are presented as seen in the direction of the flow (i.e. as seen from upstream). The origin of the
$|\bar{V}_{e}^{HWA}|$
), for six streamwise stations are presented in figure 9. Velocity contours are presented as seen in the direction of the flow (i.e. as seen from upstream). The origin of the
 $z$
coordinate has been changed to align the stationary waves at all the reported streamwise stations. Additionally, it must be stressed that the measurements were performed from the boundary layer outer edge to the wall-normal location where the local velocity attained approximately 10 % of the external velocity. However, the position of the wall is linearly extrapolated from the measured velocity profiles. This procedure has been performed for all the velocity profiles constituting the contours. It should be mentioned here that application of this strategy is common practice in studies of laminar boundary layers, whereas in intermittent or turbulent boundary layers, is expected to introduce an error in the estimation of the wall position due to the shape of the velocity profiles. This is the case for the measured stations downstream of
$z$
coordinate has been changed to align the stationary waves at all the reported streamwise stations. Additionally, it must be stressed that the measurements were performed from the boundary layer outer edge to the wall-normal location where the local velocity attained approximately 10 % of the external velocity. However, the position of the wall is linearly extrapolated from the measured velocity profiles. This procedure has been performed for all the velocity profiles constituting the contours. It should be mentioned here that application of this strategy is common practice in studies of laminar boundary layers, whereas in intermittent or turbulent boundary layers, is expected to introduce an error in the estimation of the wall position due to the shape of the velocity profiles. This is the case for the measured stations downstream of
 $X/c_{X}=0.50$
in this study. Despite this, small errors in the position of the model surface have a minimal effect on the performed analyses and conclusions of this investigation.
$X/c_{X}=0.50$
in this study. Despite this, small errors in the position of the model surface have a minimal effect on the performed analyses and conclusions of this investigation.

Figure 9. Contours of time-averaged velocity (
 $|\bar{V}^{HWA}|=(\bar{U}^{2}+\bar{V}^{2})^{1/2}$
) non-dimensionalised with the mean local external velocity (
$|\bar{V}^{HWA}|=(\bar{U}^{2}+\bar{V}^{2})^{1/2}$
) non-dimensionalised with the mean local external velocity (
 $|\bar{V}_{e}^{HWA}|$
) (10 levels from 0 to 1). The dotted lines show the boundary layer thickness averaged along
$|\bar{V}_{e}^{HWA}|$
) (10 levels from 0 to 1). The dotted lines show the boundary layer thickness averaged along
 $z$
and based on the
$z$
and based on the
 $0.99|V_{e}^{HWA}|$
threshold (
$0.99|V_{e}^{HWA}|$
threshold (
 ${\it\delta}_{99}^{z}$
). The contours are stretched along the vertical direction for better visualisation and presented as seen from upstream.
${\it\delta}_{99}^{z}$
). The contours are stretched along the vertical direction for better visualisation and presented as seen from upstream.
In the contours, the boundary layer thickness averaged along
 $z$
and based on the
$z$
and based on the
 $0.99|\bar{V}_{e}^{HWA}|$
threshold is also plotted with a black dotted line to infer the growth of the boundary layer and the relative size of the stationary vortices. This quantity will be henceforth defined as
$0.99|\bar{V}_{e}^{HWA}|$
threshold is also plotted with a black dotted line to infer the growth of the boundary layer and the relative size of the stationary vortices. This quantity will be henceforth defined as
 ${\it\delta}_{99}^{z}$
. At
${\it\delta}_{99}^{z}$
. At
 $X/c_{X}=0.15$
, the primary vortices are barely visible and only a weak modulation of the outer edge of the boundary layer can be seen. For the remainder of this study, station
$X/c_{X}=0.15$
, the primary vortices are barely visible and only a weak modulation of the outer edge of the boundary layer can be seen. For the remainder of this study, station
 $X/c_{X}=0.15$
will be considered as the first onset of the stationary instability. At
$X/c_{X}=0.15$
will be considered as the first onset of the stationary instability. At
 $X/c_{X}=0.25$
, the development of strong spanwise modulation has already become clearly evident. The standing CF modes appear as a sequence of corotating vortices rigorously spaced 9 mm from each other. The effect of the CF standing vortices is a strong modification of the base flow within the boundary layer. Low momentum flow is extracted from the region close to the wall and ejected to the outer edge and vice versa.
$X/c_{X}=0.25$
, the development of strong spanwise modulation has already become clearly evident. The standing CF modes appear as a sequence of corotating vortices rigorously spaced 9 mm from each other. The effect of the CF standing vortices is a strong modification of the base flow within the boundary layer. Low momentum flow is extracted from the region close to the wall and ejected to the outer edge and vice versa.
The stationary CF modes evolve in the streamwise direction both by increasing amplitude and changing topological features. From
 $X/c_{X}=0.25$
to
$X/c_{X}=0.25$
to
 $X/c_{X}=0.45$
the characteristic lobe structure is formed. The vortices tend to roll about their axis and eventually collapse further downstream at
$X/c_{X}=0.45$
the characteristic lobe structure is formed. The vortices tend to roll about their axis and eventually collapse further downstream at
 $X/c_{X}=0.50$
(see Kawakami et al.
Reference Kawakami, Kohama and Okutsu1999). Of interest is the furthest downstream measured station at
$X/c_{X}=0.50$
(see Kawakami et al.
Reference Kawakami, Kohama and Okutsu1999). Of interest is the furthest downstream measured station at
 $X/c_{X}=0.55$
where the flow has fully transitioned to turbulence. At this location strong spanwise modulation of the turbulent boundary layer is still evident, indicating the persevering nature of the mean flow distortion due to CF vortices in the early turbulent boundary layer (Glauser et al.
Reference Glauser, Saric, Chapman and Reibert2014). This is further supported by the streaky structures captured by the surface oil visualisation downstream of the transition front seen in figure 8.
$X/c_{X}=0.55$
where the flow has fully transitioned to turbulence. At this location strong spanwise modulation of the turbulent boundary layer is still evident, indicating the persevering nature of the mean flow distortion due to CF vortices in the early turbulent boundary layer (Glauser et al.
Reference Glauser, Saric, Chapman and Reibert2014). This is further supported by the streaky structures captured by the surface oil visualisation downstream of the transition front seen in figure 8.
Spanwise average of the mean velocity profiles and the respective standard deviation can be extracted and used to track the streamwise evolution of the standing CF mode. To be noted, the velocity fields pertaining to three full stationary waves have been used for this analysis at all the chord stations. Moreover, it should be noted that the forced stationary 9 mm mode, as well as other modes that might eventually amplify, are ensemble-averaged by this analysis. The presence of other modes can be due to nonlinear development of higher harmonics of the fundamental mode. In order to carefully assess the occurrence and strength of these modes, extended spanwise measurements and spectral analysis are necessary. The limited spatial range of the spanwise HWA traverse did not allow this measurement. Despite this, inspection of figure 9 reveals the effectiveness of the roughness forcing in locking the stationary disturbances to a single fundamental mode (9 mm), even at the more downstream stations. This observation establishes that the following analysis of the primary instability mainly refers to the fundamental forced mode. This analysis is presented for several streamwise stations in figure 10. The results closely follow the ones reported by Reibert et al. (Reference Reibert, Saric, Carrillo and Chapman1996), Radeztsky et al. (Reference Radeztsky, Reibert and Saric1999), Haynes & Reed (Reference Haynes and Reed2000) and White & Saric (Reference White and Saric2005).

Figure 10. (a) Spanwise mean (base flow) and (b) standard deviation (mode shape) of the time-averaged velocity profiles at several chord stations, non-dimensionalised with the local external velocity. For clarity, only one out of four measured values is reported with a marker symbol. The profiles presented pertain to three full stationary vortices.
The spanwise average velocity profiles of figure 10(a) reveal the evolution along the streamwise direction of the boundary layer through the stages of primary instability growth and saturation. Between the first two stations (
 $0.15\leqslant X/c_{X}\leqslant 0.25$
) the growth of an approximately self-similar laminar boundary layer occurred, while the profiles from
$0.15\leqslant X/c_{X}\leqslant 0.25$
) the growth of an approximately self-similar laminar boundary layer occurred, while the profiles from
 $X/c_{X}=0.35$
show a different curvature with a point of inflection. The most downstream profile presented, at
$X/c_{X}=0.35$
show a different curvature with a point of inflection. The most downstream profile presented, at
 $X/c_{X}=0.50$
, reveals a less distorted boundary layer.
$X/c_{X}=0.50$
, reveals a less distorted boundary layer.
The mode shape profiles of figure 10(b) provide further insight into the evolution of the developing CF modes. Again, for the first two stations a growth of the primary disturbance is observed, while between
 $X/c_{X}=0.25$
and
$X/c_{X}=0.25$
and
 $X/c_{X}=0.35$
a change occurs for these profiles as well. This relates not only with an increase in amplitude but also with changes in the shape of the mode, most notably the development of two local maxima. The second maximum of the curve at station
$X/c_{X}=0.35$
a change occurs for these profiles as well. This relates not only with an increase in amplitude but also with changes in the shape of the mode, most notably the development of two local maxima. The second maximum of the curve at station
 $X/c_{X}=0.35$
is related to the increased size of the stationary vortices and the eventual rolling over of the characteristic lobe structure. This behaviour has been related to the onset of secondary instability modes (Haynes & Reed Reference Haynes and Reed2000; White & Saric Reference White and Saric2005). These features are further enhanced in the more downstream stations until
$X/c_{X}=0.35$
is related to the increased size of the stationary vortices and the eventual rolling over of the characteristic lobe structure. This behaviour has been related to the onset of secondary instability modes (Haynes & Reed Reference Haynes and Reed2000; White & Saric Reference White and Saric2005). These features are further enhanced in the more downstream stations until
 $X/c_{X}=0.45$
where a peak value of
$X/c_{X}=0.45$
where a peak value of
 $0.21|\bar{V}_{e}^{HWA}|$
is attained by the mode shape profile. This is identified as a typical saturation value reported by Downs & White (Reference Downs and White2013) based on experiments performed at similar conditions (see figure 19 of their article). Moving further in the developing transitional boundary layer (
$0.21|\bar{V}_{e}^{HWA}|$
is attained by the mode shape profile. This is identified as a typical saturation value reported by Downs & White (Reference Downs and White2013) based on experiments performed at similar conditions (see figure 19 of their article). Moving further in the developing transitional boundary layer (
 $X/c_{X}=0.50$
), both maxima are reduced, indicating dampening of the primary mode due to turbulent diffusion.
$X/c_{X}=0.50$
), both maxima are reduced, indicating dampening of the primary mode due to turbulent diffusion.
The streamwise growth of the CF mode can be extracted from figure 10(b). There exist several options regarding the specific metric used for the estimation of modal growth. One option is to directly track the maxima, as described by (5.1) (e.g. Haynes & Reed Reference Haynes and Reed2000). A second option is to track the wall-normal integral of the mode shape profiles using (5.2) (e.g. Downs & White Reference Downs and White2013). Although the latter option suffers less from measurement errors and uncertainties, both approaches are followed in this study for comparison with data from previous studies. Results are presented in the form of absolute amplitudes (
 $A_{I}$
) in figure 11(a) and in the form of
$A_{I}$
) in figure 11(a) and in the form of
 $N$
-factors (
$N$
-factors (
 $N_{I}$
) in figure 11(b), where the local
$N_{I}$
) in figure 11(b), where the local
 $N$
-factors are the natural logarithm of the local amplitudes normalised with the amplitude at the first instability point as defined by (5.3). For the experimental results of this study the onset of the primary instability is assumed to occur at the first measured station,
$N$
-factors are the natural logarithm of the local amplitudes normalised with the amplitude at the first instability point as defined by (5.3). For the experimental results of this study the onset of the primary instability is assumed to occur at the first measured station,
 $x_{0}=0.15\cdot c_{X}$
. It must be noted here that in order to arrive at the non-dimensional amplitudes using the wall-normal integral metric (
$x_{0}=0.15\cdot c_{X}$
. It must be noted here that in order to arrive at the non-dimensional amplitudes using the wall-normal integral metric (
 $A_{I}^{int}$
), the spanwise average boundary layer thickness (
$A_{I}^{int}$
), the spanwise average boundary layer thickness (
 ${\it\delta}_{99}^{z}$
) is used for non-dimensionalising, as shown in (5.2). This is done following the work of Downs & White (Reference Downs and White2013) and the results presented are in good agreement with the outcomes of their study for similar values of free stream turbulence.
${\it\delta}_{99}^{z}$
) is used for non-dimensionalising, as shown in (5.2). This is done following the work of Downs & White (Reference Downs and White2013) and the results presented are in good agreement with the outcomes of their study for similar values of free stream turbulence.
 $$\begin{eqnarray}\displaystyle & \displaystyle A_{I}^{max}=\max |_{y_{t}}\left(z_{rms}\left\{\frac{|\bar{V}^{HWA}|}{|\bar{V}_{e}^{HWA}|}\right\}\right), & \displaystyle\end{eqnarray}$$
 $$\begin{eqnarray}\displaystyle & \displaystyle A_{I}^{int}=\frac{1}{{\it\delta}_{99}^{z}}\int _{0}^{{\it\delta}_{99}^{z}}z_{rms}\left\{\frac{|\bar{V}^{HWA}|}{|\bar{V}_{e}^{HWA}|}\right\}\text{d}y_{t}, & \displaystyle\end{eqnarray}$$
 $$\begin{eqnarray}\displaystyle & \displaystyle N_{I}=\ln \frac{A_{I}}{A_{I}(x_{0})}. & \displaystyle\end{eqnarray}$$
The growth of the primary CF mode is monotonic from the first observation station until approximately
 $X/c_{X}=0.45$
. Further downstream, a notable reduction of both the local maxima and the integral of the mode shape profile is evident. This indicates primary mode amplitude saturation. Saturation has been typically associated with the rise of nonlinear interactions between the primary mode and secondary instability (Malik et al.
Reference Malik, Li, Choudhari and Chang1999; Haynes & Reed Reference Haynes and Reed2000; White & Saric Reference White and Saric2005). Comparison with the LST predictions for the stationary 9 mm mode (presented again in figure 11
b) shows the known limits of the theory, not being able to predict the observed saturation. Despite this, it appears that linear theory can estimate with good agreement the
$X/c_{X}=0.45$
. Further downstream, a notable reduction of both the local maxima and the integral of the mode shape profile is evident. This indicates primary mode amplitude saturation. Saturation has been typically associated with the rise of nonlinear interactions between the primary mode and secondary instability (Malik et al.
Reference Malik, Li, Choudhari and Chang1999; Haynes & Reed Reference Haynes and Reed2000; White & Saric Reference White and Saric2005). Comparison with the LST predictions for the stationary 9 mm mode (presented again in figure 11
b) shows the known limits of the theory, not being able to predict the observed saturation. Despite this, it appears that linear theory can estimate with good agreement the
 $N$
-factor when the maximum mode shape metric is applied. At the more downstream stations, the forced
$N$
-factor when the maximum mode shape metric is applied. At the more downstream stations, the forced
 ${\it\lambda}_{z}^{F}=9$
mm stationary waves start decaying rapidly, with a steep reduction at
${\it\lambda}_{z}^{F}=9$
mm stationary waves start decaying rapidly, with a steep reduction at
 $X/c_{X}=0.55$
where a fully turbulent boundary layer has developed.
$X/c_{X}=0.55$
where a fully turbulent boundary layer has developed.
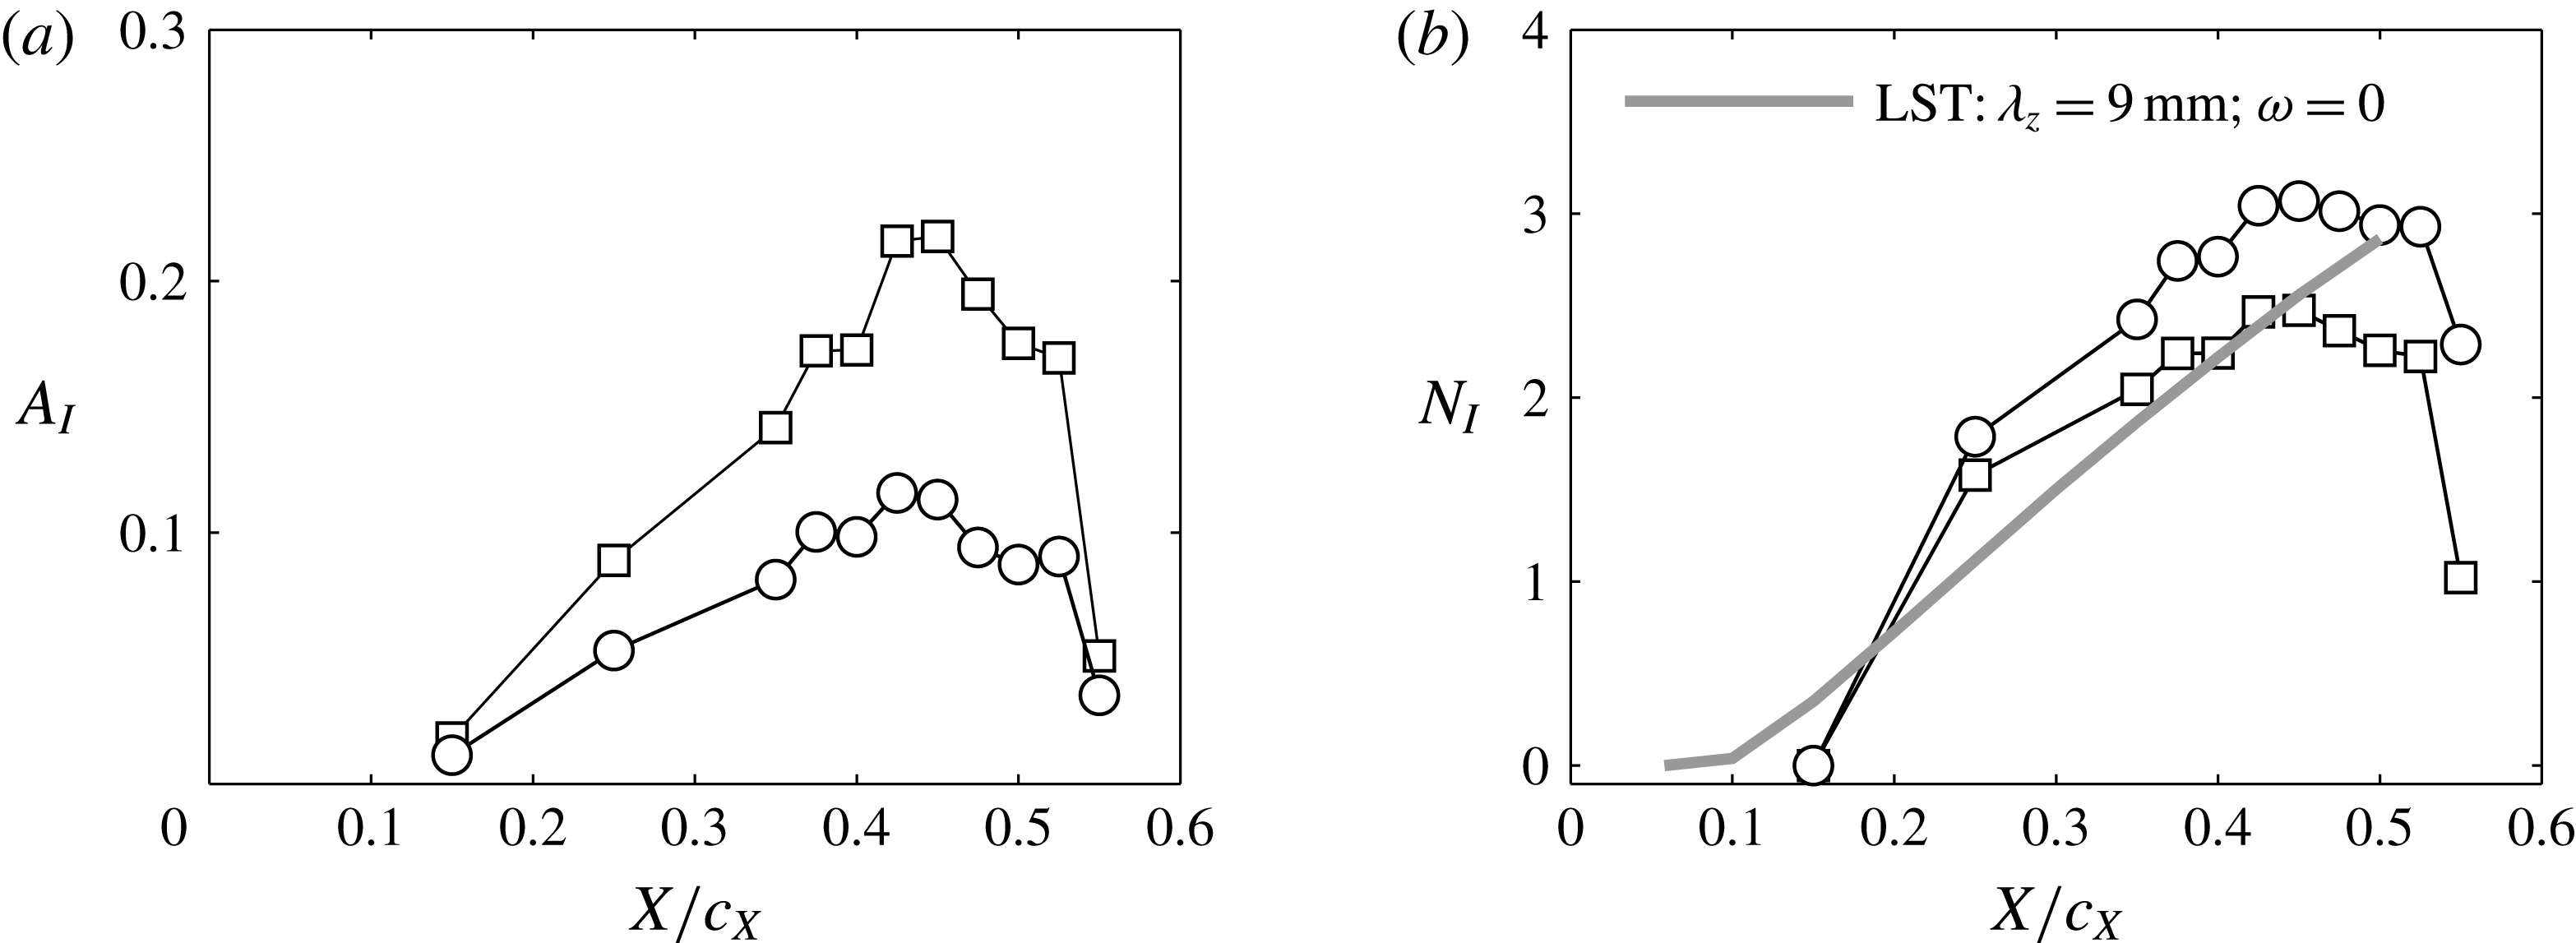
Figure 11. (a) Non-dimensional amplitudes and (b)
 $N$
-factors based on the maximum metric (
$N$
-factors based on the maximum metric (
 $A_{I}^{max}$
: ▫) and on the wall-normal integral metric (
$A_{I}^{max}$
: ▫) and on the wall-normal integral metric (
 $A_{I}^{int}$
: ○) of the mode shape profiles of figure 10(b), computed using (5.1), (5.2) and (5.3). The
$A_{I}^{int}$
: ○) of the mode shape profiles of figure 10(b), computed using (5.1), (5.2) and (5.3). The
 $N$
-factor curve of the 9 mm stationary mode from LST is shown by the grey solid line. The analysis refers to three full stationary vortices.
$N$
-factor curve of the 9 mm stationary mode from LST is shown by the grey solid line. The analysis refers to three full stationary vortices.

Figure 12. Contours of the velocity standard deviation non-dimensionalised with the time-averaged local external velocity (
 $|\bar{V}_{e}^{HWA}|$
) (10 levels from 0 to 0.1). The contours are stretched along the vertical direction for clarity and presented as seen from upstream.
$|\bar{V}_{e}^{HWA}|$
) (10 levels from 0 to 0.1). The contours are stretched along the vertical direction for clarity and presented as seen from upstream.
Additional to the mean flow distortion due to the primary CF mode, the developing boundary layer exhibits an intricate topology of velocity fluctuations. The standard deviation of the velocity fluctuations is computed and non-dimensionalised with the mean local external velocity. Contours of velocity fluctuations are shown in figure 12 for several streamwise stations. Fluctuations observed at
 $X/c_{X}=0.15$
are mainly associated with the existence of weak travelling CF modes (Deyhle & Bippes Reference Deyhle and Bippes1996). The relatively low free stream turbulence of the wind tunnel facility and the use of discrete roughness elements dictate the dominance of stationary CF instabilities. Nonetheless, the appearance of travelling modes cannot be avoided in an experimental framework (Deyhle & Bippes Reference Deyhle and Bippes1996; Högberg & Henningson Reference Högberg and Henningson1998; Downs & White Reference Downs and White2013).
$X/c_{X}=0.15$
are mainly associated with the existence of weak travelling CF modes (Deyhle & Bippes Reference Deyhle and Bippes1996). The relatively low free stream turbulence of the wind tunnel facility and the use of discrete roughness elements dictate the dominance of stationary CF instabilities. Nonetheless, the appearance of travelling modes cannot be avoided in an experimental framework (Deyhle & Bippes Reference Deyhle and Bippes1996; Högberg & Henningson Reference Högberg and Henningson1998; Downs & White Reference Downs and White2013).
Further downstream, at stations
 $X/c_{X}=0.25$
,
$X/c_{X}=0.25$
,
 $X/c_{X}=0.375$
and
$X/c_{X}=0.375$
and
 $X/c_{X}=0.45$
, the spatial topology of velocity fluctuations is strongly influenced by the mean flow distortion due to the primary CF mode (compare with figure 9). The saturation of the primary CF mode downstream of station
$X/c_{X}=0.45$
, the spatial topology of velocity fluctuations is strongly influenced by the mean flow distortion due to the primary CF mode (compare with figure 9). The saturation of the primary CF mode downstream of station
 $X/c_{X}=0.45$
signifies the onset of rapid growth of secondary instability. Similar observations have been established in previous studies (e.g. Högberg & Henningson Reference Högberg and Henningson1998; Kawakami et al.
Reference Kawakami, Kohama and Okutsu1999; Malik et al.
Reference Malik, Li, Choudhari and Chang1999; Haynes & Reed Reference Haynes and Reed2000; Wassermann & Kloker Reference Wassermann and Kloker2002; White & Saric Reference White and Saric2005). At wing mid-chord, the flow is undergoing turbulent breakdown. The contours of the r.m.s. fields show the rightmost wave experiencing a much higher level of fluctuations. Furthermore, the fluctuation maximum at
$X/c_{X}=0.45$
signifies the onset of rapid growth of secondary instability. Similar observations have been established in previous studies (e.g. Högberg & Henningson Reference Högberg and Henningson1998; Kawakami et al.
Reference Kawakami, Kohama and Okutsu1999; Malik et al.
Reference Malik, Li, Choudhari and Chang1999; Haynes & Reed Reference Haynes and Reed2000; Wassermann & Kloker Reference Wassermann and Kloker2002; White & Saric Reference White and Saric2005). At wing mid-chord, the flow is undergoing turbulent breakdown. The contours of the r.m.s. fields show the rightmost wave experiencing a much higher level of fluctuations. Furthermore, the fluctuation maximum at
 $z=20$
mm near the wall is indication of the apex of a turbulent wedge (White & Saric Reference White and Saric2005). At the most downstream measured station (
$z=20$
mm near the wall is indication of the apex of a turbulent wedge (White & Saric Reference White and Saric2005). At the most downstream measured station (
 $X/c_{X}=0.55$
), a fully turbulent boundary layer sets in and redistribution of the fluctuating energy and related dampening of the coherent structures are taking place.
$X/c_{X}=0.55$
), a fully turbulent boundary layer sets in and redistribution of the fluctuating energy and related dampening of the coherent structures are taking place.
In the region of stationary vortices saturation, the fluctuations are mainly observed in three distinct areas within the spatial domain occupied by a single CF wave (figure 13 a). These areas are associated with unsteady instabilities of a distinct nature (Högberg & Henningson Reference Högberg and Henningson1998; Malik et al. Reference Malik, Li, Choudhari and Chang1999; Wassermann & Kloker Reference Wassermann and Kloker2002; White & Saric Reference White and Saric2005).
One area of high fluctuation intensity can be identified as overlapping the outer side of the upwelling region of the CF vortex. This area is coincident with the local minimum of the spanwise gradient of the mean velocity (
 $\partial |\bar{V}^{HWA}|/\partial z$
) as presented in figure 13(c). Malik et al. (Reference Malik, Li, Choudhari and Chang1999) classified these fluctuations as z-mode secondary instability. These are defined as type-I modes in this paper, following White & Saric (Reference White and Saric2005). A second area of pronounced fluctuating velocity is evident on the top of the CF vortices. Inspecting the velocity shears (figure 13
b) this area overlaps with pronounced wall-normal velocity gradients (
$\partial |\bar{V}^{HWA}|/\partial z$
) as presented in figure 13(c). Malik et al. (Reference Malik, Li, Choudhari and Chang1999) classified these fluctuations as z-mode secondary instability. These are defined as type-I modes in this paper, following White & Saric (Reference White and Saric2005). A second area of pronounced fluctuating velocity is evident on the top of the CF vortices. Inspecting the velocity shears (figure 13
b) this area overlaps with pronounced wall-normal velocity gradients (
 $\partial |\bar{V}^{HWA}|/\partial y$
). Respectively, this can be identified as the y-mode of the secondary instability (Malik et al.
Reference Malik, Li, Choudhari and Chang1999), here defined as type-II mode (Wassermann & Kloker Reference Wassermann and Kloker2002). A third area of strong fluctuations is located at the inner side of the upwelling low momentum air where the
$\partial |\bar{V}^{HWA}|/\partial y$
). Respectively, this can be identified as the y-mode of the secondary instability (Malik et al.
Reference Malik, Li, Choudhari and Chang1999), here defined as type-II mode (Wassermann & Kloker Reference Wassermann and Kloker2002). A third area of strong fluctuations is located at the inner side of the upwelling low momentum air where the
 $z$
velocity gradients show a local maxima. The disturbances captured in this region are related to the interaction between travelling and stationary primary CF vortices and are named type-III mode (Janke & Balakumar Reference Janke and Balakumar2000; Wassermann & Kloker Reference Wassermann and Kloker2002; Bonfigli & Kloker Reference Bonfigli and Kloker2007). Finally, velocity fluctuations are also evident between the discrete CF vortices in the near-wall region. This area is characterised by the downwelling motion of high momentum flow due to the mean flow distortion induced by the primary CF mode. This results in the formation of a locally thin boundary layer with extremely high wall-normal shear as evident in figure 13(b).
$z$
velocity gradients show a local maxima. The disturbances captured in this region are related to the interaction between travelling and stationary primary CF vortices and are named type-III mode (Janke & Balakumar Reference Janke and Balakumar2000; Wassermann & Kloker Reference Wassermann and Kloker2002; Bonfigli & Kloker Reference Bonfigli and Kloker2007). Finally, velocity fluctuations are also evident between the discrete CF vortices in the near-wall region. This area is characterised by the downwelling motion of high momentum flow due to the mean flow distortion induced by the primary CF mode. This results in the formation of a locally thin boundary layer with extremely high wall-normal shear as evident in figure 13(b).

Figure 13. (a) Contours of velocity standard deviation (10 levels from 0 to 0.1), (b) gradient of time-averaged velocity in the wall-normal direction (10 levels from
 $-$
1.7 to 16.6) and (c) in spanwise direction (10 levels from
$-$
1.7 to 16.6) and (c) in spanwise direction (10 levels from
 $-$
3.6 to 2.7). The velocity fields, sampled at
$-$
3.6 to 2.7). The velocity fields, sampled at
 $X/c_{X}=0.45$
, are non-dimensionalised with the time-averaged local external velocity (
$X/c_{X}=0.45$
, are non-dimensionalised with the time-averaged local external velocity (
 $|\bar{V}_{e}^{HWA}|$
) and the lengths with
$|\bar{V}_{e}^{HWA}|$
) and the lengths with
 ${\it\lambda}_{z}^{F}$
. The contours are stretched along the vertical direction for clarity and are presented as seen from upstream.
${\it\lambda}_{z}^{F}$
. The contours are stretched along the vertical direction for clarity and are presented as seen from upstream.
5.3 Comparison between computed and measured boundary layers
As already described in § 4, the LST analysis is based on a laminar boundary layer mean flow, computed numerically using the pressure distribution of figure 2. At this point, a comparison between the computed velocity profiles and the HWA measurements can be performed. In figure 14, this is done for the three most upstream measured stations. The considered HWA profiles are the
 $z$
-mean of the time-averaged measured planes in order to average the effect of the developing stationary vortices. The computed boundary layer has a prescribed sweep angle of
$z$
-mean of the time-averaged measured planes in order to average the effect of the developing stationary vortices. The computed boundary layer has a prescribed sweep angle of
 $45^{\circ }$
while the computed velocity components are transformed to match the ones seen by the hot-wire probe.
$45^{\circ }$
while the computed velocity components are transformed to match the ones seen by the hot-wire probe.

Figure 14. Comparison between the computed boundary layer (BL) based on experimental pressure distribution (BL solver) and the hot-wire measurements (averaged along
 $z$
), at the most upstream stations. For clarity, only one out of two measured values is reported with a marker symbol.
$z$
), at the most upstream stations. For clarity, only one out of two measured values is reported with a marker symbol.

Figure 15. Time-averaged velocity magnitude along the stationary crossflow axis measured with tomo-PIV. The local origin at
 $X_{W}=Z_{W}=0$
coincides with
$X_{W}=Z_{W}=0$
coincides with
 $X/c_{X}=0.45$
and
$X/c_{X}=0.45$
and
 $Z=0$
. The semi-transparent isosurfaces relate to values of
$Z=0$
. The semi-transparent isosurfaces relate to values of
 $\bar{U}_{W}/\bar{U}_{We}=0.9$
and
$\bar{U}_{W}/\bar{U}_{We}=0.9$
and
 $\bar{U}_{W}/\bar{U}_{We}=0.8$
. The flow is presented as seen from upstream.
$\bar{U}_{W}/\bar{U}_{We}=0.8$
. The flow is presented as seen from upstream.
The velocity profiles appear similar for the first stations with a larger discrepancy at station
 $X/c_{X}=0.35$
where the measured velocity field is evidently distorted by the stationary CF vortices (see also figure 10
a). Instead, the satisfactory agreement at
$X/c_{X}=0.35$
where the measured velocity field is evidently distorted by the stationary CF vortices (see also figure 10
a). Instead, the satisfactory agreement at
 $X/c_{X}=0.15$
indicates that the curvature of the model, not modelled in the boundary layer solver, is not very relevant at this station. This comparison further corroborates the estimations of the LST for the most upstream regions of the studied flow.
$X/c_{X}=0.15$
indicates that the curvature of the model, not modelled in the boundary layer solver, is not very relevant at this station. This comparison further corroborates the estimations of the LST for the most upstream regions of the studied flow.
5.4 Tomographic PIV measurements
The analysis of the primary boundary layer instability is further expanded to the results of the tomo-PIV experiment. As mentioned in § 3, the measured velocity field is aligned with the coordinate system of the primary stationary vortices
 $(X_{W}Y_{W}Z_{W}\equiv X_{W}y_{t}Z_{W})$
. The time-averaged flow field of the velocity component along the stationary vortices axes, non-dimensionalised with the time-averaged external velocity, is presented in figure 15. Three
$(X_{W}Y_{W}Z_{W}\equiv X_{W}y_{t}Z_{W})$
. The time-averaged flow field of the velocity component along the stationary vortices axes, non-dimensionalised with the time-averaged external velocity, is presented in figure 15. Three
 $y_{t}$
–
$y_{t}$
–
 $Z_{W}$
planes, at the
$Z_{W}$
planes, at the
 $X_{W}$
locations corresponding to the most upstream end, to the most downstream end and to the centre of the measured domain, are shown with 10 contour levels. Additionally, two isosurfaces pertaining to levels of velocity of
$X_{W}$
locations corresponding to the most upstream end, to the most downstream end and to the centre of the measured domain, are shown with 10 contour levels. Additionally, two isosurfaces pertaining to levels of velocity of
 $\bar{U}_{W}/\bar{U}_{We}=0.9$
and
$\bar{U}_{W}/\bar{U}_{We}=0.9$
and
 $\bar{U}_{W}/\bar{U}_{We}=0.8$
are also plotted to facilitate the visualisation of the three-dimensional evolution of the vortical structures. The point at
$\bar{U}_{W}/\bar{U}_{We}=0.8$
are also plotted to facilitate the visualisation of the three-dimensional evolution of the vortical structures. The point at
 $X_{W}=0$
is at
$X_{W}=0$
is at
 $X/c_{X}=0.45$
while the
$X/c_{X}=0.45$
while the
 $Z_{W}=0$
is at
$Z_{W}=0$
is at
 $Z=0$
(wing mid-span). The position of the wall is linearly extrapolated from the measured velocity profiles. Almost five stationary waves are captured by this measurement. Their spacing is relatively constant, corresponding approximately to a wavelength along
$Z=0$
(wing mid-span). The position of the wall is linearly extrapolated from the measured velocity profiles. Almost five stationary waves are captured by this measurement. Their spacing is relatively constant, corresponding approximately to a wavelength along
 $Z_{W}$
of 6.9 mm. A wavelength of 6.9 mm in the
$Z_{W}$
of 6.9 mm. A wavelength of 6.9 mm in the
 $X_{W}Y_{W}Z_{W}$
coordinate system corresponds to 9 mm in the
$X_{W}Y_{W}Z_{W}$
coordinate system corresponds to 9 mm in the
 $xyz$
domain, consistent with the spacing of the discrete roughness elements at the leading edge. A small discrepancy is observed regarding the position of the rightmost wave at approximately
$xyz$
domain, consistent with the spacing of the discrete roughness elements at the leading edge. A small discrepancy is observed regarding the position of the rightmost wave at approximately
 $Z_{W}=17$
mm. This could be attributed to non-uniformities of the discrete roughness elements or to occasional debris depositing on the model surface, slightly displacing this vortex.
$Z_{W}=17$
mm. This could be attributed to non-uniformities of the discrete roughness elements or to occasional debris depositing on the model surface, slightly displacing this vortex.
The unprecedented application of tomo-PIV for the measurement of transitional swept wing boundary layers necessitates the rigorous comparison of the measurements against established techniques such as HWA. This requires some care given the different reference systems and velocity components measured by the two techniques. Towards this goal, a plane aligned with
 $y_{t}$
–
$y_{t}$
–
 $z$
is extracted at
$z$
is extracted at
 $X/c_{X}=0.45$
from the volume presented in figure 15, thus coinciding with the hot-wire measured plane. The velocity components are then transformed such to match the signal measured by the hot-wire (
$X/c_{X}=0.45$
from the volume presented in figure 15, thus coinciding with the hot-wire measured plane. The velocity components are then transformed such to match the signal measured by the hot-wire (
 $|V^{HWA}|=(U^{2}+V^{2})^{1/2}$
). The result of such comparison is presented in figure 16 for the time-averaged velocity. The values of the velocities are non-dimensionalised with the time-averaged local external velocity while the wall position is linearly extrapolated from the measured data. The agreement between the two measurement techniques is striking.
$|V^{HWA}|=(U^{2}+V^{2})^{1/2}$
). The result of such comparison is presented in figure 16 for the time-averaged velocity. The values of the velocities are non-dimensionalised with the time-averaged local external velocity while the wall position is linearly extrapolated from the measured data. The agreement between the two measurement techniques is striking.
At the upper-left corner of the two contours three (
 $+$
) symbols are plotted to show the spatial
$+$
) symbols are plotted to show the spatial
 $y_{t}$
-
$y_{t}$
-
 $z$
resolution of the two experiments. (Note that the contours are stretched along the
$z$
resolution of the two experiments. (Note that the contours are stretched along the
 $y_{t}$
direction.) In spite of the higher wall-normal resolution of the hot-wire measurements compared to tomo-PIV, the latter appears to be capturing the strong shears due to the modulated flow with the same accuracy. A further comparison of the two velocity fields is presented in terms of velocity profiles in figure 16(c). The velocity distribution across the wall-normal direction, at the two spanwise stations denoted with the same markers on figure 16(a) and 16(b) and pertaining respectively to regions of reduced and strong wall-normal shears, is measured by the two techniques with good agreement, showing a maximum discrepancy of
$y_{t}$
direction.) In spite of the higher wall-normal resolution of the hot-wire measurements compared to tomo-PIV, the latter appears to be capturing the strong shears due to the modulated flow with the same accuracy. A further comparison of the two velocity fields is presented in terms of velocity profiles in figure 16(c). The velocity distribution across the wall-normal direction, at the two spanwise stations denoted with the same markers on figure 16(a) and 16(b) and pertaining respectively to regions of reduced and strong wall-normal shears, is measured by the two techniques with good agreement, showing a maximum discrepancy of
 $0.058|\bar{V_{e}}^{HWA}|$
.
$0.058|\bar{V_{e}}^{HWA}|$
.

Figure 16. Contours of time-averaged velocity magnitude, non-dimensionalised with the mean local external velocity (10 levels from 0 to
 $|\bar{V}_{e}^{HWA}|$
) from (a) HWA and (b) tomo-PIV. The spatial resolution along
$|\bar{V}_{e}^{HWA}|$
) from (a) HWA and (b) tomo-PIV. The spatial resolution along
 $z$
and
$z$
and
 $y_{t}$
of the two measurements is presented with the (
$y_{t}$
of the two measurements is presented with the (
 $+$
) symbols at the upper-left corner of the contours (note that the contours are stretched along the
$+$
) symbols at the upper-left corner of the contours (note that the contours are stretched along the
 $y_{t}$
direction). (c) Velocity profiles at the stations indicated with identical symbols on contours (a) and (b). For clarity only one out of four measured values is reported with a marker symbol.
$y_{t}$
direction). (c) Velocity profiles at the stations indicated with identical symbols on contours (a) and (b). For clarity only one out of four measured values is reported with a marker symbol.
It now becomes important to further establish a comparison between the two experiments in measuring the statistical quantities of the unsteady field. This comparison is presented in figure 17 where the r.m.s. of the velocity fluctuations, non-dimensionalised with the external velocity, is shown. A notable feature of the fluctuation field captured by tomo-PIV is the elevated level measured in the free stream. This effect is attributed to the inherent limits associated with PIV in general and tomo-PIV specifically. The background r.m.s. level has an average value of
 $0.015\bar{V}_{e}^{HWA}$
that corresponds to the error estimated in § 3.6.
$0.015\bar{V}_{e}^{HWA}$
that corresponds to the error estimated in § 3.6.
Despite the elevated fluctuation levels in the free stream, the tomo-PIV measurement captures the local maxima associated with type-I, type-II and type-III instabilities in both magnitude and location. Both inner and outer upwelling regions, as well as the top region, are in relative agreement to the hot-wire measurements. Unfortunately, the same cannot be said for the near-wall portion of the downwelling region (centred at
 $z\approx 0,9,18$
mm in figure 17). At this region, the inherent downwelling action of the primary CF instability results in elevated shear near the wall, as showed in figure 13(b). Such high shears are beyond the measurable threshold of
$z\approx 0,9,18$
mm in figure 17). At this region, the inherent downwelling action of the primary CF instability results in elevated shear near the wall, as showed in figure 13(b). Such high shears are beyond the measurable threshold of
 $0.5~\text{px}~\text{px}^{-1}$
reported by Scarano (Reference Scarano2002) for PIV measurements. It is believed that the pronounced errors are not deemed disruptive to the conclusions of this study because they appear in a region not associated with a particular instability mode. For the remainder of the analysis of the unsteady flow features, the near-wall region of the tomo-PIV fields (
$0.5~\text{px}~\text{px}^{-1}$
reported by Scarano (Reference Scarano2002) for PIV measurements. It is believed that the pronounced errors are not deemed disruptive to the conclusions of this study because they appear in a region not associated with a particular instability mode. For the remainder of the analysis of the unsteady flow features, the near-wall region of the tomo-PIV fields (
 $y_{t}<0.95$
mm indicated with the dotted line on the contour) will not be taken into account. The r.m.s. maximum of the inner upwelling region, pertaining to the type-III mode, appears also partially affected by the described measurement error. This is again disregarded to be influencing the analysis of § 6.3 as POD allows the identification of spatially coherent structures, thus filtering out most of the measurement noise (Raiola, Discetti & Ianiro Reference Raiola, Discetti and Ianiro2015).
$y_{t}<0.95$
mm indicated with the dotted line on the contour) will not be taken into account. The r.m.s. maximum of the inner upwelling region, pertaining to the type-III mode, appears also partially affected by the described measurement error. This is again disregarded to be influencing the analysis of § 6.3 as POD allows the identification of spatially coherent structures, thus filtering out most of the measurement noise (Raiola, Discetti & Ianiro Reference Raiola, Discetti and Ianiro2015).

Figure 17. Contours of the velocity standard deviation, non-dimensionalised with the mean local external velocity (12 levels from 0 to
 $0.12|\bar{V}_{e}^{HWA}|$
) from (a) HWA and (b) tomo-PIV. The black dotted line at
$0.12|\bar{V}_{e}^{HWA}|$
) from (a) HWA and (b) tomo-PIV. The black dotted line at
 $y_{t}=0.95$
mm in the tomo-PIV contour indicates the region disregarded in the unsteady flow analysis of § 6.3.
$y_{t}=0.95$
mm in the tomo-PIV contour indicates the region disregarded in the unsteady flow analysis of § 6.3.
A slice at
 $X/c_{X}=0.45$
of the volume shown in figure 15 is presented in figure 18 for all the three velocity components. Additionally, the velocity components are presented in the primary CF vortices coordinate system (
$X/c_{X}=0.45$
of the volume shown in figure 15 is presented in figure 18 for all the three velocity components. Additionally, the velocity components are presented in the primary CF vortices coordinate system (
 $U_{W}V_{W}W_{W}$
). The
$U_{W}V_{W}W_{W}$
). The
 $\bar{U}_{W}$
component dominates over the two in-plane components (
$\bar{U}_{W}$
component dominates over the two in-plane components (
 $\bar{V_{W}}$
and
$\bar{V_{W}}$
and
 $\bar{W_{W}}$
) by two orders of magnitude. The relative magnitude of the three velocity components reveals the effectiveness of the in-plane components in modifying the mean boundary layer and thus the out-of-plane velocity. The wall-normal velocity maxima at
$\bar{W_{W}}$
) by two orders of magnitude. The relative magnitude of the three velocity components reveals the effectiveness of the in-plane components in modifying the mean boundary layer and thus the out-of-plane velocity. The wall-normal velocity maxima at
 $z=5.0$
mm and 14.0 mm are responsible for the upwelling of the low momentum flow from the lower regions of the boundary layer. The minimum at
$z=5.0$
mm and 14.0 mm are responsible for the upwelling of the low momentum flow from the lower regions of the boundary layer. The minimum at
 $z=9$
mm is instead the effect of the downwelling motion with the consequent transport of higher momentum flow from the boundary layer outer edge towards the wing surface. At
$z=9$
mm is instead the effect of the downwelling motion with the consequent transport of higher momentum flow from the boundary layer outer edge towards the wing surface. At
 $z=2.8$
mm and
$z=2.8$
mm and
 $z=11.8$
mm a second local minimum of the wall-normal velocity is observed. This is located in a region where Malik et al. (Reference Malik, Li and Chang1994), Wassermann & Kloker (Reference Wassermann and Kloker2002) and Bonfigli & Kloker (Reference Bonfigli and Kloker2007) reported a second stationary vortex, the effect of which was found to be not relevant in the transition scenario. The spanwise velocity (
$z=11.8$
mm a second local minimum of the wall-normal velocity is observed. This is located in a region where Malik et al. (Reference Malik, Li and Chang1994), Wassermann & Kloker (Reference Wassermann and Kloker2002) and Bonfigli & Kloker (Reference Bonfigli and Kloker2007) reported a second stationary vortex, the effect of which was found to be not relevant in the transition scenario. The spanwise velocity (
 $\bar{W_{W}}$
) contour reveals the crossflow velocity in the regions near the wall. The non-zero value of
$\bar{W_{W}}$
) contour reveals the crossflow velocity in the regions near the wall. The non-zero value of
 $\bar{W_{W}}$
at the outer edge is instead dictated by the chosen coordinate system. As the stationary CF axis is not exactly aligned with the inviscid flow, what is plotted contains the projection of the streamwise velocity along the
$\bar{W_{W}}$
at the outer edge is instead dictated by the chosen coordinate system. As the stationary CF axis is not exactly aligned with the inviscid flow, what is plotted contains the projection of the streamwise velocity along the
 $Z_{W}$
direction.
$Z_{W}$
direction.
Summarising, although the primary waves are manifested as relatively weak spanwise perturbations of the
 $V_{W}$
and
$V_{W}$
and
 $W_{W}$
components, the change they induce in the axial velocity component is dramatically larger. Although this is a known feature of CF instability, the simultaneous characterisation of all three components of velocity was so far possible only in the realm of numerical simulations (Wassermann & Kloker Reference Wassermann and Kloker2002; Bonfigli & Kloker Reference Bonfigli and Kloker2007). The experimental measurement of such features indicates the merits of tomo-PIV as a diagnostic tool for this type of flow.
$W_{W}$
components, the change they induce in the axial velocity component is dramatically larger. Although this is a known feature of CF instability, the simultaneous characterisation of all three components of velocity was so far possible only in the realm of numerical simulations (Wassermann & Kloker Reference Wassermann and Kloker2002; Bonfigli & Kloker Reference Bonfigli and Kloker2007). The experimental measurement of such features indicates the merits of tomo-PIV as a diagnostic tool for this type of flow.

Figure 18. Non-dimensional time-averaged velocity components sampled along a constant chordwise plane at
 $X/c_{X}=0.45$
. (a)
$X/c_{X}=0.45$
. (a)
 $\bar{U}_{W}/\bar{U}_{We}$
(10 levels, from 0 to 1) and vectors of
$\bar{U}_{W}/\bar{U}_{We}$
(10 levels, from 0 to 1) and vectors of
 $(\bar{V}_{W}^{2}+\bar{W}_{W}^{2})^{1/2}/\bar{U}_{We}$
(reference vector at the upper-left corner). For clarity, only one in three vectors is plotted along
$(\bar{V}_{W}^{2}+\bar{W}_{W}^{2})^{1/2}/\bar{U}_{We}$
(reference vector at the upper-left corner). For clarity, only one in three vectors is plotted along
 $z$
. (b)
$z$
. (b)
 $\bar{V}_{W}/\bar{U}_{We}$
,
$\bar{V}_{W}/\bar{U}_{We}$
,
 $\bar{W}_{W}/\bar{U}_{We}$
.
$\bar{W}_{W}/\bar{U}_{We}$
.
6 Secondary instability
While the role of primary stationary crossflow instability in low free stream turbulence environments typically dominates the transition scenario, travelling CF waves are also destabilised. Their interaction with the stationary modes results in characteristic flow structures of primary relevance for the final breakdown of the transitional boundary layer. Furthermore, in the high shear regions of the flow caused by the primary stationary instability, high-frequency secondary modes are also observed. This section presents measurements of the unsteady modes and their interaction with the primary stationary waves. Hot-wire measurements are subjected to spectral analysis and selective bandpass filtering in order to reveal the statistical properties of the various modes of the velocity fluctuations. Additionally, POD analysis is applied on the instantaneous tomo-PIV fields in order to identify the development, topology and features of spatially coherent structures in the unsteady flow field.
6.1 Spectral characteristics
As discussed in the previous section, the fluctuation field features three local maxima, corresponding to the location of the velocity gradients (see figure 13). At these locations, the time series of the velocity fluctuations were used to compute the power spectral density (
 ${\it\Phi}_{V^{\prime }}$
) using the average periodogram method introduced by Welch (Reference Welch1967). A single-point HWA measurement consists of
${\it\Phi}_{V^{\prime }}$
) using the average periodogram method introduced by Welch (Reference Welch1967). A single-point HWA measurement consists of
 $2\times 10^{5}$
instantaneous readings. The spectra were computed for segments of 5000 samples, with a relative overlap of 50 %, averaged together. All the presented spectra feature a frequency resolution of
$2\times 10^{5}$
instantaneous readings. The spectra were computed for segments of 5000 samples, with a relative overlap of 50 %, averaged together. All the presented spectra feature a frequency resolution of
 ${\it\delta}_{f}=10$
Hz.
${\it\delta}_{f}=10$
Hz.

Figure 19. Non-dimensional spectra of the velocity fluctuations, for six chordwise stations, at the locations indicated by the (○) markers in the inset figure (coded with the corresponding colours). Inset: contour of the time-averaged velocity field (black lines, 10 levels from 0 to 1) and velocity fluctuations field (grey scale, 10 levels from 0 to 0.084) non-dimensionalised with the mean local external velocity
 $|\bar{V}_{e}^{HWA}|$
, at
$|\bar{V}_{e}^{HWA}|$
, at
 $X/c_{X}=0.475$
.
$X/c_{X}=0.475$
.
The non-dimensional spectra (
 $({\it\Phi}_{V^{\prime }}\cdot {\it\delta}_{f}/U_{\infty }^{2})^{1/2}$
) are plotted in figure 19 for several chordwise stations. The lines are coded with the same colours of the bullet markers of the contour, presented in the inset, where the velocity signals are sampled. The analysis of the three fluctuation regions shows respective dominance of significantly disparate spectral content and diverse streamwise evolution. At the first considered station,
$({\it\Phi}_{V^{\prime }}\cdot {\it\delta}_{f}/U_{\infty }^{2})^{1/2}$
) are plotted in figure 19 for several chordwise stations. The lines are coded with the same colours of the bullet markers of the contour, presented in the inset, where the velocity signals are sampled. The analysis of the three fluctuation regions shows respective dominance of significantly disparate spectral content and diverse streamwise evolution. At the first considered station,
 $X/c_{X}=0.375$
(first panel of figure 19), the inner upwelling region (marked by the light grey colour as in the inset) is characterised by pronounced spectral energy in a band of low Strouhal numbers between
$X/c_{X}=0.375$
(first panel of figure 19), the inner upwelling region (marked by the light grey colour as in the inset) is characterised by pronounced spectral energy in a band of low Strouhal numbers between
 $St=15$
(
$St=15$
(
 $f=300$
Hz) and
$f=300$
Hz) and
 $St=25$
(
$St=25$
(
 $f=550$
Hz). At higher frequencies, the spectral energy significantly drops to the level of background noise. Several narrow spikes appear above
$f=550$
Hz). At higher frequencies, the spectral energy significantly drops to the level of background noise. Several narrow spikes appear above
 $St=250$
which can be attributed to electronic noise. Additionally, a low power frequency band from
$St=250$
which can be attributed to electronic noise. Additionally, a low power frequency band from
 $St=150$
and
$St=150$
and
 $St=500$
is present which is traced to inherent characteristics of the hot-wire bridge and does not correspond to physical events (Saddoughi & Veeravalli Reference Saddoughi and Veeravalli1996). The low frequencies dominating the inner upwelling region are consistent with observations of Deyhle & Bippes (Reference Deyhle and Bippes1996), Malik et al. (Reference Malik, Li, Choudhari and Chang1999) and White & Saric (Reference White and Saric2005) and are attributed to primary travelling crossflow instabilities which initially develop in the boundary layer independently of the primary standing modes. Later, when the stationary vortices reach a considerable amplitude, these travelling waves undergo the spanwise modulation imposed on the boundary layer by the steady modes (Fischer & Dallmann Reference Fischer and Dallmann1991; Högberg & Henningson Reference Högberg and Henningson1998; Janke & Balakumar Reference Janke and Balakumar2000; Bonfigli & Kloker Reference Bonfigli and Kloker2007). This is further confirmed by the predictions of LST which identified amplified modes around
$St=500$
is present which is traced to inherent characteristics of the hot-wire bridge and does not correspond to physical events (Saddoughi & Veeravalli Reference Saddoughi and Veeravalli1996). The low frequencies dominating the inner upwelling region are consistent with observations of Deyhle & Bippes (Reference Deyhle and Bippes1996), Malik et al. (Reference Malik, Li, Choudhari and Chang1999) and White & Saric (Reference White and Saric2005) and are attributed to primary travelling crossflow instabilities which initially develop in the boundary layer independently of the primary standing modes. Later, when the stationary vortices reach a considerable amplitude, these travelling waves undergo the spanwise modulation imposed on the boundary layer by the steady modes (Fischer & Dallmann Reference Fischer and Dallmann1991; Högberg & Henningson Reference Högberg and Henningson1998; Janke & Balakumar Reference Janke and Balakumar2000; Bonfigli & Kloker Reference Bonfigli and Kloker2007). This is further confirmed by the predictions of LST which identified amplified modes around
 $St=15$
(
$St=15$
(
 $f=300$
Hz) (figure 7
a).
$f=300$
Hz) (figure 7
a).
The fluctuations in the outer region of the upwelling flow (indicated with the black colour) are instead characterised by a pronounced band of Strouhal numbers between
 $St=124$
(
$St=124$
(
 $f=2.5$
kHz) and
$f=2.5$
kHz) and
 $St=348$
(
$St=348$
(
 $f=7$
kHz). Such high frequencies have been typically associated with secondary instability of the Kelvin–Helmholtz type (Bonfigli & Kloker Reference Bonfigli and Kloker2007) arising as a nonlinear perturbation of the primary stationary CF mode (cf. Malik et al.
Reference Malik, Li, Choudhari and Chang1999; Janke & Balakumar Reference Janke and Balakumar2000; White & Saric Reference White and Saric2005).
$f=7$
kHz). Such high frequencies have been typically associated with secondary instability of the Kelvin–Helmholtz type (Bonfigli & Kloker Reference Bonfigli and Kloker2007) arising as a nonlinear perturbation of the primary stationary CF mode (cf. Malik et al.
Reference Malik, Li, Choudhari and Chang1999; Janke & Balakumar Reference Janke and Balakumar2000; White & Saric Reference White and Saric2005).
Moving downstream, the energy content of the associated frequency bands is drastically increased indicating growth of all unsteady modes. The spectra at
 $X/c_{X}=0.425$
show that both the low-frequency band associated with the inner side of the upwelling region of the CF vortex and the high-frequency hump occurring in the outer side, exhibit large amplitude growth. Moreover the spectrum of fluctuations in the top region of the primary wave (marked in dark grey), coinciding with a maximum of the velocity gradient along
$X/c_{X}=0.425$
show that both the low-frequency band associated with the inner side of the upwelling region of the CF vortex and the high-frequency hump occurring in the outer side, exhibit large amplitude growth. Moreover the spectrum of fluctuations in the top region of the primary wave (marked in dark grey), coinciding with a maximum of the velocity gradient along
 $y_{t}$
(see figure 13
b), shows also a band of high energy centred at
$y_{t}$
(see figure 13
b), shows also a band of high energy centred at
 $St=373$
(
$St=373$
(
 $f=7.5$
kHz). This indicates destabilisation of the type-II mode as well (Malik et al.
Reference Malik, Li, Choudhari and Chang1999; White & Saric Reference White and Saric2005).
$f=7.5$
kHz). This indicates destabilisation of the type-II mode as well (Malik et al.
Reference Malik, Li, Choudhari and Chang1999; White & Saric Reference White and Saric2005).
At
 $X/c_{X}=0.45$
the type-III mode (light grey line), sampled in the inner side of the upwelling region, further amplifies. Additionally, the two higher harmonics of this mode (at approximately
$X/c_{X}=0.45$
the type-III mode (light grey line), sampled in the inner side of the upwelling region, further amplifies. Additionally, the two higher harmonics of this mode (at approximately
 $St=46$
(
$St=46$
(
 $f=925$
Hz) and
$f=925$
Hz) and
 $St=65$
(
$St=65$
(
 $f=1300$
Hz)) become evident at this station. At this station, the type-I high-frequency mode greatly enhances its magnitude compared to the previous chord station. It features a larger growth than that experienced by the low-frequency travelling waves, suggesting a stronger growth rate for this secondary instability (cf. Högberg & Henningson Reference Högberg and Henningson1998). Sudden growth occurs as well to the higher-frequency type-II mode (dark grey line) sampled in the top region of the primary vortex, reaching a comparable amplitude to the type-I mode just discussed.
$f=1300$
Hz)) become evident at this station. At this station, the type-I high-frequency mode greatly enhances its magnitude compared to the previous chord station. It features a larger growth than that experienced by the low-frequency travelling waves, suggesting a stronger growth rate for this secondary instability (cf. Högberg & Henningson Reference Högberg and Henningson1998). Sudden growth occurs as well to the higher-frequency type-II mode (dark grey line) sampled in the top region of the primary vortex, reaching a comparable amplitude to the type-I mode just discussed.
Further downstream, at
 $X/c_{X}=0.475$
, the low-frequency fluctuations in the vortex inner upwelling region and those in the top region are further enhanced, although the magnitude of the background neighbouring frequencies is also increased. The type-II mode on the upper region of the primary vortex shows a steep increase, overcoming, at this location, the magnitude of the type-I instability. The last two stations, where the spectral analysis is performed, are located at
$X/c_{X}=0.475$
, the low-frequency fluctuations in the vortex inner upwelling region and those in the top region are further enhanced, although the magnitude of the background neighbouring frequencies is also increased. The type-II mode on the upper region of the primary vortex shows a steep increase, overcoming, at this location, the magnitude of the type-I instability. The last two stations, where the spectral analysis is performed, are located at
 $X/c_{X}=0.50$
and
$X/c_{X}=0.50$
and
 $X/c_{X}=0.525$
. The two high-frequency type-I and type-II modes appear to peak in energy but they also appear to be almost overtaken by the broadband fluctuations pertaining to a more turbulent boundary layer. The low-frequency mode instead does not show any appreciable change between
$X/c_{X}=0.525$
. The two high-frequency type-I and type-II modes appear to peak in energy but they also appear to be almost overtaken by the broadband fluctuations pertaining to a more turbulent boundary layer. The low-frequency mode instead does not show any appreciable change between
 $X/c_{X}=0.45$
and
$X/c_{X}=0.45$
and
 $X/c_{X}=0.525$
. This further suggests the independence of the type-III mode from the growth of secondary instability although the growth of all three modes appears to be related to the saturation of the stationary vortices, as will be described later.
$X/c_{X}=0.525$
. This further suggests the independence of the type-III mode from the growth of secondary instability although the growth of all three modes appears to be related to the saturation of the stationary vortices, as will be described later.
6.2 Streamwise evolution
The analysis of the spectra presented so far pertains to rigorous amplification of the three unsteady modes in the region between primary mode amplitude saturation (
 $X/c_{X}\approx 0.45$
) and turbulent onset (
$X/c_{X}\approx 0.45$
) and turbulent onset (
 $X/c_{X}\approx 0.50$
). A way to track this evolution is presented by White & Saric (Reference White and Saric2005) and Downs & White (Reference Downs and White2013) and consists of computing the growth rates of the unsteady modes. To do this, the velocity fields are bandpass filtered, by means of zero phase shift fourth-order digital filtering, in the respective frequency bands. Root-mean-square contours of the bandpass filtered fields are presented in figure 20 for stations
$X/c_{X}\approx 0.50$
). A way to track this evolution is presented by White & Saric (Reference White and Saric2005) and Downs & White (Reference Downs and White2013) and consists of computing the growth rates of the unsteady modes. To do this, the velocity fields are bandpass filtered, by means of zero phase shift fourth-order digital filtering, in the respective frequency bands. Root-mean-square contours of the bandpass filtered fields are presented in figure 20 for stations
 $X/c_{X}=0.45$
,
$X/c_{X}=0.45$
,
 $X/c_{X}=0.475$
and
$X/c_{X}=0.475$
and
 $X/c_{X}=0.50$
. Additionally the time-averaged velocity field respective to the station is superimposed. The contours on the first column on the left and indicated with band 1, refer to the band
$X/c_{X}=0.50$
. Additionally the time-averaged velocity field respective to the station is superimposed. The contours on the first column on the left and indicated with band 1, refer to the band
 $17.4\leqslant St\leqslant 27.3$
(
$17.4\leqslant St\leqslant 27.3$
(
 $350~\text{Hz}\leqslant f\leqslant 550~\text{Hz}$
) pertaining to the type-III instability (not to be confused with the type-I mode). Contours indicated with band 2 correspond to the range
$350~\text{Hz}\leqslant f\leqslant 550~\text{Hz}$
) pertaining to the type-III instability (not to be confused with the type-I mode). Contours indicated with band 2 correspond to the range
 $248.0\leqslant St\leqslant 298$
(
$248.0\leqslant St\leqslant 298$
(
 $5~\text{kHz}\leqslant f\leqslant 6~\text{kHz}$
) related to the type-I mode. Band 3 relates to the range
$5~\text{kHz}\leqslant f\leqslant 6~\text{kHz}$
) related to the type-I mode. Band 3 relates to the range
 $348\leqslant St\leqslant 397$
(
$348\leqslant St\leqslant 397$
(
 $7~\text{kHz}\leqslant f\leqslant 8~\text{kHz}$
), pertaining to the type-II mode. The contours are non-dimensionalised with the free stream velocity (
$7~\text{kHz}\leqslant f\leqslant 8~\text{kHz}$
), pertaining to the type-II mode. The contours are non-dimensionalised with the free stream velocity (
 $U_{\infty }$
). Note that the band 1 contours attain larger values than the ones of bands 2 and 3.
$U_{\infty }$
). Note that the band 1 contours attain larger values than the ones of bands 2 and 3.

Figure 20. Bandpass filtered velocity fluctuation fields (grey scale) and time-averaged velocity fields (black lines, 10 levels from 0 to
 $U_{\infty }$
). Frequency band 1:
$U_{\infty }$
). Frequency band 1:
 $17.4\leqslant St\leqslant 27.3$
(
$17.4\leqslant St\leqslant 27.3$
(
 $350~\text{Hz}\leqslant f\leqslant 550~\text{Hz}$
) (10 levels from 0 to
$350~\text{Hz}\leqslant f\leqslant 550~\text{Hz}$
) (10 levels from 0 to
 $0.24U_{\infty }$
), band 2:
$0.24U_{\infty }$
), band 2:
 $248.0\leqslant St\leqslant 298.3$
(
$248.0\leqslant St\leqslant 298.3$
(
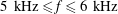 $5~\text{kHz}\leqslant f\leqslant 6~\text{kHz}$
) (10 levels from 0 to
$5~\text{kHz}\leqslant f\leqslant 6~\text{kHz}$
) (10 levels from 0 to
 $0.6U_{\infty }$
) and band 3:
$0.6U_{\infty }$
) and band 3:
 $348.0\leqslant St\leqslant 397.8$
(
$348.0\leqslant St\leqslant 397.8$
(
 $7~\text{kHz}\leqslant f\leqslant 8~\text{kHz}$
) (10 levels from 0 to
$7~\text{kHz}\leqslant f\leqslant 8~\text{kHz}$
) (10 levels from 0 to
 $0.6U_{\infty }$
).
$0.6U_{\infty }$
).
It becomes evident that the three modes possess characteristic topological arrangement and streamwise development. The spatial locations, with respect to the primary vortices, pertaining to the three modes are revealed, confirming previous observations by e.g. Högberg & Henningson (Reference Högberg and Henningson1998), Malik et al. (Reference Malik, Li, Choudhari and Chang1999) and White & Saric (Reference White and Saric2005). Moving past the wing trailing edge, it can be seen how the high-frequency modes grow strongly passing from
 $X/c_{X}=0.45$
to
$X/c_{X}=0.45$
to
 $X/c_{X}=0.50$
. The low-frequency mode, although having a larger amplitude, does not show such a steep growth, as already commented.
$X/c_{X}=0.50$
. The low-frequency mode, although having a larger amplitude, does not show such a steep growth, as already commented.
Although the absolute magnitude of r.m.s. intensity reveals the overall growth of each mode, a more robust evaluation of the growth rates is sought. To this end the disturbances amplitude expressed by (6.1) (as defined by White & Saric (Reference White and Saric2005) and Downs & White (Reference Downs and White2013)) is introduced, pertaining to a spatial average, along
 $z$
and
$z$
and
 $y_{t}$
, of the r.m.s. of the bandpass filtered velocity fluctuations. Here
$y_{t}$
, of the r.m.s. of the bandpass filtered velocity fluctuations. Here
 $t_{rms}\{|V_{BP}^{HWA}|/|\bar{V}_{e}^{HWA}|\}$
represents the r.m.s. of the time series of the non-dimensional bandpass filtered velocity field,
$t_{rms}\{|V_{BP}^{HWA}|/|\bar{V}_{e}^{HWA}|\}$
represents the r.m.s. of the time series of the non-dimensional bandpass filtered velocity field,
 ${\it\delta}_{99}^{z}$
is again the spanwise-averaged boundary layer thickness and
${\it\delta}_{99}^{z}$
is again the spanwise-averaged boundary layer thickness and
 $z_{max}$
denotes the spanwise integration length chosen to accommodate three primary crossflow waves (
$z_{max}$
denotes the spanwise integration length chosen to accommodate three primary crossflow waves (
 $z_{max}=3{\it\lambda}_{z}^{F}=27$
mm)
$z_{max}=3{\it\lambda}_{z}^{F}=27$
mm)
 $$\begin{eqnarray}A_{II}^{BP}=\frac{1}{{\it\delta}_{99}^{z}}\frac{1}{z_{max}}\int _{0}^{{\it\delta}_{99}^{z}}\int _{0}^{z_{max}}t_{rms}\left\{\frac{|V_{BP}^{HWA}|}{|\bar{V}_{e}^{HWA}|}\right\}\,\text{d}z\,\text{d}y_{t}.\end{eqnarray}$$
Using the computed amplitudes,
 $N$
-factors of the unsteady modes can be estimated based on the reference amplitude at
$N$
-factors of the unsteady modes can be estimated based on the reference amplitude at
 $x_{0}=0.35c_{X}$
 $$\begin{eqnarray}N_{II}^{BP}=\ln \frac{A_{II}^{BP}}{A_{II}^{BP}(x_{0})}.\end{eqnarray}$$
The computed amplitudes (
 $A_{II}$
) are presented in figure 21(a), while the
$A_{II}$
) are presented in figure 21(a), while the
 $N$
-factors (
$N$
-factors (
 $N_{II}$
) of the unsteady modes are shown in figure 21(b). The need to present both the curves resides in the observation that the choice of the initial normalising amplitudes for the different modes is not trivial and can lead to misleading conclusions. The low-frequency mode exhibits the strongest and earliest growth. Indeed, within only 20 % of the chord, spanning from
$N_{II}$
) of the unsteady modes are shown in figure 21(b). The need to present both the curves resides in the observation that the choice of the initial normalising amplitudes for the different modes is not trivial and can lead to misleading conclusions. The low-frequency mode exhibits the strongest and earliest growth. Indeed, within only 20 % of the chord, spanning from
 $X/c_{X}=0.35$
to
$X/c_{X}=0.35$
to
 $X/c_{X}=0.55$
, the amplitude of fluctuations attributed to the low-frequency mode increases by approximately two orders of magnitude. Moreover, it can be seen that this mode grows monotonically in the considered range, with a steeper slope between
$X/c_{X}=0.55$
, the amplitude of fluctuations attributed to the low-frequency mode increases by approximately two orders of magnitude. Moreover, it can be seen that this mode grows monotonically in the considered range, with a steeper slope between
 $X/c_{X}=0.45$
and
$X/c_{X}=0.45$
and
 $X/c_{X}=0.475$
.
$X/c_{X}=0.475$
.
It is important to note here that since travelling crossflow modes essentially sweep the measurement plane, their fluctuation intensity would be expected not to significantly vary in the
 $z$
direction. It is evident from figure 20(a) that this is not the case as the low-frequency band is only dominant in the inner upwelling region of the standing CF vortex. As discussed, this is caused by the interaction with the stationary CF vortices. Moreover, since this is a primary instability mechanism (Fischer & Dallmann Reference Fischer and Dallmann1991; Högberg & Henningson Reference Högberg and Henningson1998; Janke & Balakumar Reference Janke and Balakumar2000; Bonfigli & Kloker Reference Bonfigli and Kloker2007), its growth along the streamwise direction is expected to not show the explosive nature of the secondary modes. After the saturation of the steady modes however, the amplitude of this mode shows larger values. The two high-frequency modes instead show the previously reported (Wassermann & Kloker Reference Wassermann and Kloker2002; White & Saric Reference White and Saric2005) sudden growth from
$z$
direction. It is evident from figure 20(a) that this is not the case as the low-frequency band is only dominant in the inner upwelling region of the standing CF vortex. As discussed, this is caused by the interaction with the stationary CF vortices. Moreover, since this is a primary instability mechanism (Fischer & Dallmann Reference Fischer and Dallmann1991; Högberg & Henningson Reference Högberg and Henningson1998; Janke & Balakumar Reference Janke and Balakumar2000; Bonfigli & Kloker Reference Bonfigli and Kloker2007), its growth along the streamwise direction is expected to not show the explosive nature of the secondary modes. After the saturation of the steady modes however, the amplitude of this mode shows larger values. The two high-frequency modes instead show the previously reported (Wassermann & Kloker Reference Wassermann and Kloker2002; White & Saric Reference White and Saric2005) sudden growth from
 $X/c_{X}=0.45$
and, within only the 10 % of the wing chord, they amplify to 30 (type-I) and 20 (type-II) times their initial amplitude.
$X/c_{X}=0.45$
and, within only the 10 % of the wing chord, they amplify to 30 (type-I) and 20 (type-II) times their initial amplitude.
It can also be seen that the three inspected frequency bands drive the amplitude of the full-spectrum fluctuations, which also shows a sudden enhancement after station
 $X/c_{X}=0.45$
. At the last considered station
$X/c_{X}=0.45$
. At the last considered station
 $X/c_{X}=0.55$
, turbulent breakdown occurs, as seen in figure 9 and is further indicated by the steeper slope of all the curves. The three bands show comparable amplitudes, reaching approximately 60 % of the total fluctuation amplitude. At this station, the bands cannot be related any more to the instability modes.
$X/c_{X}=0.55$
, turbulent breakdown occurs, as seen in figure 9 and is further indicated by the steeper slope of all the curves. The three bands show comparable amplitudes, reaching approximately 60 % of the total fluctuation amplitude. At this station, the bands cannot be related any more to the instability modes.


6.3 Spatial organisation
The large disparity of length scales and time scales associated with the instability modes in a swept wing boundary layer necessitate the deployment of robust and objective mode identification techniques. One such technique is POD, originally introduced by Lumley (Reference Lumley, Yaglom and Tatarsky1967) for identification of coherent turbulent structures. This is a powerful technique which capitalises on the spatial coherence of orthogonal modes in order to identify and prioritise them with respect to their energy content.
In this experiment, POD was applied on the full set of 500 instantaneous tomo-PIV flow fields using the snapshot technique introduced by Sirovich (Reference Sirovich1987). Furthermore, the investigated volume was cropped compared to the full tomo-PIV domain of figure 15. This was done for several reasons: firstly, POD inherently identifies spatially coherent unsteady modes within a given flow field. In the case of CF instability-dominated boundary layers, these would effectively be the primary travelling waves and secondary instability vortices. Additionally, these modes exhibit strong nonlinear behaviour with respect to the standing CF mode (see § 6.2 and work of Malik et al. (Reference Malik, Li and Chang1994)) but not with the high-frequency instabilities developing on a neighbouring stationary CF vortex, as reported by Bonfigli & Kloker (Reference Bonfigli and Kloker2007). These observations bring specific considerations regarding the application of POD to a flow field encompassing multiple standing CF vortices. The instability modes developing within each standing CF vortex will be directly associated with the strength and topology of their respective carrier CF wave. Although, the primary waves have been forced with identical roughness elements, total similarity cannot be guaranteed in an experimental framework. Any slight disparity between individual standing CF vortices and in their secondary destabilisation would consequently introduce discrepancies between sets of unsteady modes in terms of amplitude and spatial coherence which would degrade the ability of POD to identify them. Based on this, a domain encompassing a single standing CF vortex was selected for POD analysis by cropping the full tomo-PIV volume in the spanwise range of
 $0~\text{mm}\leqslant z\leqslant 6~\text{mm}$
. A second consideration is the apparent failure of tomo-PIV to capture the near-wall region, as evident by the discrepancies in figure 17. As discussed, this is due to inherent limits of PIV in regions of high shear. Fortunately, the bandpass filtered fluctuation distributions presented in figure 20 indicate little modal content in the near-wall region, other than a fraction of the type-III mode. Following this, the considered domain for POD was further cropped to dismiss the near wall-region (
$0~\text{mm}\leqslant z\leqslant 6~\text{mm}$
. A second consideration is the apparent failure of tomo-PIV to capture the near-wall region, as evident by the discrepancies in figure 17. As discussed, this is due to inherent limits of PIV in regions of high shear. Fortunately, the bandpass filtered fluctuation distributions presented in figure 20 indicate little modal content in the near-wall region, other than a fraction of the type-III mode. Following this, the considered domain for POD was further cropped to dismiss the near wall-region (
 $y_{t}<0.95$
mm).
$y_{t}<0.95$
mm).

Figure 22. Relative turbulent kinetic energy distribution of the first 20 POD modes.
The relative turbulent kinetic energy distribution (TKE) of the first twenty POD modes is shown in figure 22. The first POD mode clearly dominates in the unsteady flow field with approximately 16 % of the total fluctuation kinetic energy. The energy content of the following modes diminishes rapidly. At this point, some notes are necessary regarding the interpretation of POD modes. In typical application cases such as bluff body aerodynamics (Nati et al. Reference Nati, Kotsonis, Ghaemi and Scarano2013) or turbulent breakdown of free jets (Violato & Scarano Reference Violato and Scarano2013), the inherent ability of POD to prioritise spatially coherent modes according to their energy content is rather straightforward. In contrast, in highly multiscale, nonlinear problems such as transitional boundary layers, POD modal energy is weakly coupled to the importance of the respective mode in the transition process. In the present study, spatially coherent modes corresponding to the developing instabilities within the standing CF vortex are sought. It is already known from the existing hot-wire measurements (cf. § 6.2) and previous investigations (Wassermann & Kloker Reference Wassermann and Kloker2002) that these modes are rather weak compared to the free stream velocity, and hence prone to be overshadowed by other sources such as measurement noise. Finally, it must be stressed that the exact sorting of these modes is additionally dependent on the domain of the flow field considered for POD.
Considering the previous points, it becomes important to identify the modes relevant to the transition process based on features other than their energy content. One such feature is the expected spatial wavelength associated with the mode, which can be derived using the Taylor hypothesis from the previously described hot-wire measurements. A second feature stems from the fact that the sought instability modes are inherently convective (Kawakami et al.
Reference Kawakami, Kohama and Okutsu1999; Wassermann & Kloker Reference Wassermann and Kloker2002; Bonfigli & Kloker Reference Bonfigli and Kloker2007). As such, the POD procedure will generate a harmonically coupled pair of POD modes, shifted by
 ${\rm\pi}/2$
, for each physical convecting coherent structure (Van Oudheusden et al.
Reference Van Oudheusden, Scarano, Van Hinsberg and Watt2005). Both these features have been used as selection criteria in this study in order to identify the POD modes corresponding to the relevant instability modes in the transitional boundary layer. Following this approach, four modes (
${\rm\pi}/2$
, for each physical convecting coherent structure (Van Oudheusden et al.
Reference Van Oudheusden, Scarano, Van Hinsberg and Watt2005). Both these features have been used as selection criteria in this study in order to identify the POD modes corresponding to the relevant instability modes in the transitional boundary layer. Following this approach, four modes (
 ${\it\Phi}_{6}$
,
${\it\Phi}_{6}$
,
 ${\it\Phi}_{7}$
,
${\it\Phi}_{7}$
,
 ${\it\Phi}_{9}$
and
${\it\Phi}_{9}$
and
 ${\it\Phi}_{10}$
) have been selected and are presented in §§ 6.3.2 and 6.3.3. Before moving to the analysis of the secondary instability modes, the first POD mode (
${\it\Phi}_{10}$
) have been selected and are presented in §§ 6.3.2 and 6.3.3. Before moving to the analysis of the secondary instability modes, the first POD mode (
 ${\it\Phi}_{1}$
) is inspected due to its considerably high energy content and particular spatial topology (§ 6.3.1).
${\it\Phi}_{1}$
) is inspected due to its considerably high energy content and particular spatial topology (§ 6.3.1).

Figure 23. Isosurfaces of
 $U_{W}/\bar{U}_{We}=\pm 0.086$
of POD mode
$U_{W}/\bar{U}_{We}=\pm 0.086$
of POD mode
 ${\it\Phi}_{1}$
. Three contours of
${\it\Phi}_{1}$
. Three contours of
 $\bar{U}_{W}/\bar{U}_{We}$
at
$\bar{U}_{W}/\bar{U}_{We}$
at
 $X_{W}-15,0$
and 15 mm (10 levels from 0 to 1).
$X_{W}-15,0$
and 15 mm (10 levels from 0 to 1).
6.3.1 Quasi-stationary crossflow vortices
The first POD mode (
 ${\it\Phi}_{1}$
) is presented in figure 23, in terms of isosurfaces of
${\it\Phi}_{1}$
) is presented in figure 23, in terms of isosurfaces of
 $U_{W}/\bar{U}_{We}=\pm 0.086$
, together with three cross-cut contours of the
$U_{W}/\bar{U}_{We}=\pm 0.086$
, together with three cross-cut contours of the
 $\bar{U}_{W}/\bar{U}_{We}$
velocity field pertaining to the standing CF vortex. The isosurfaces appear aligned with the spanwise (
$\bar{U}_{W}/\bar{U}_{We}$
velocity field pertaining to the standing CF vortex. The isosurfaces appear aligned with the spanwise (
 $z$
) shear of the mean velocity field (compare with figure 13
c). In addition, no streamwise variation of the mode can be identified. The spatial topology of the mode suggests a slow velocity fluctuation which occurs mainly in the
$z$
) shear of the mean velocity field (compare with figure 13
c). In addition, no streamwise variation of the mode can be identified. The spatial topology of the mode suggests a slow velocity fluctuation which occurs mainly in the
 $Z_{W}$
direction. Finally, the mode is not harmonically coupled to any of the remaining POD modes, suggesting a global and not convective structure. In order to further aid understanding of this phenomenon, a flow field reconstruction based on the sum of the mean flow and mode
$Z_{W}$
direction. Finally, the mode is not harmonically coupled to any of the remaining POD modes, suggesting a global and not convective structure. In order to further aid understanding of this phenomenon, a flow field reconstruction based on the sum of the mean flow and mode
 ${\it\Phi}_{1}$
is performed. This is presented in figure 24(a), where the locus of the isoline at
${\it\Phi}_{1}$
is performed. This is presented in figure 24(a), where the locus of the isoline at
 $\bar{U}_{W}/\bar{U}_{We}=0.9$
is shown for the mean field (black line) against all instantaneous realisations of the reconstructed field (grey scatter symbols). The characteristic grid pattern stemming from the interpolation of the selected isoline on the discrete vector spacing of the tomo-PIV measurement is evident. Despite this, it can be clearly affirmed that POD mode
$\bar{U}_{W}/\bar{U}_{We}=0.9$
is shown for the mean field (black line) against all instantaneous realisations of the reconstructed field (grey scatter symbols). The characteristic grid pattern stemming from the interpolation of the selected isoline on the discrete vector spacing of the tomo-PIV measurement is evident. Despite this, it can be clearly affirmed that POD mode
 ${\it\Phi}_{1}$
pertains to a global shift of the stationary CF vortices mainly along the
${\it\Phi}_{1}$
pertains to a global shift of the stationary CF vortices mainly along the
 $Z_{W}$
direction. The positions of the rightmost locus of the instantaneous isolines (indicated with the ○ symbol in figure 24
a) have been fed into a normal probability density function distribution (PDF) to inspect the displacements along
$Z_{W}$
direction. The positions of the rightmost locus of the instantaneous isolines (indicated with the ○ symbol in figure 24
a) have been fed into a normal probability density function distribution (PDF) to inspect the displacements along
 $Z_{W}$
(
$Z_{W}$
(
 ${\rm\Delta}Z_{W}$
) in terms of magnitude and occurrence. The result is shown in figure 24(b). The sparsity of the PDF is again related to the discreteness of the measurements. The mean position of the isoline (plotted with a black solid line) pertains to the value of
${\rm\Delta}Z_{W}$
) in terms of magnitude and occurrence. The result is shown in figure 24(b). The sparsity of the PDF is again related to the discreteness of the measurements. The mean position of the isoline (plotted with a black solid line) pertains to the value of
 ${\it\mu}=-0.015$
mm while the standard deviation (dotted lines) is
${\it\mu}=-0.015$
mm while the standard deviation (dotted lines) is
 ${\it\sigma}=0.12$
mm.
${\it\sigma}=0.12$
mm.

Figure 24. (a) Contour of the isoline at
 $\bar{U}_{W}/\bar{U}_{We}=0.9$
for the time-averaged field (black line) and the isolines of instantaneous realisations of the reconstructed field from POD mode
$\bar{U}_{W}/\bar{U}_{We}=0.9$
for the time-averaged field (black line) and the isolines of instantaneous realisations of the reconstructed field from POD mode
 ${\it\Phi}_{1}$
(grey symbols). (b) Normal distribution of the realisations (
${\it\Phi}_{1}$
(grey symbols). (b) Normal distribution of the realisations (
 ${\rm\Delta}Z_{W}$
) of the
${\rm\Delta}Z_{W}$
) of the
 $U_{W}/\bar{U}_{We}=0.9$
isoline at the location of the bullet symbol in (a). The black line indicates the mean (
$U_{W}/\bar{U}_{We}=0.9$
isoline at the location of the bullet symbol in (a). The black line indicates the mean (
 ${\it\mu}=-0.015$
mm) and the dotted lines indicate the standard deviation (
${\it\mu}=-0.015$
mm) and the dotted lines indicate the standard deviation (
 ${\it\sigma}=0.12$
mm).
${\it\sigma}=0.12$
mm).
As previously mentioned, the origin of the first mode cannot be immediately interpreted. The appearance of such global spanwise oscillation of the flow field could be caused by a small shift, along
 $Z_{W}$
, of the PIV cameras and/or of the wing model (shaking of the laser light has no detrimental effect in tomo-PIV measurements). While the model and the cameras were mounted on stiff supports, the time series of the PIV images were inspected in order to identify equipment vibrations. Indeed, no such movement was detected within the accuracy of a single pixel (about 0.03 mm), thus excluding a relative motion of the cameras and the model.
$Z_{W}$
, of the PIV cameras and/or of the wing model (shaking of the laser light has no detrimental effect in tomo-PIV measurements). While the model and the cameras were mounted on stiff supports, the time series of the PIV images were inspected in order to identify equipment vibrations. Indeed, no such movement was detected within the accuracy of a single pixel (about 0.03 mm), thus excluding a relative motion of the cameras and the model.
Based on the previous analysis it becomes apparent that mode
 ${\it\Phi}_{1}$
is physical and pertains to a low-frequency spanwise shift of the stationary structures. This further justifies the extremely high energy content of this mode, since it is essentially a mean flow distortion. The source of such movement can currently only be conjectured. A possible cause is a low-frequency modulation of the free stream flow due to unsteadiness inherent to the wind tunnel or other environmental factors. Such an effect would eventually modulate the local Reynolds number and consequently the stability characteristics of the boundary layer, including the wavenumber angle of the 9 mm CF mode. An alternative explanation would be a vortex self-induction oscillatory movement due to the presence of the wall. Fluctuations of the stagnation line or stemming from the wind tunnel walls turbulent boundary layer could also cause similar structures. Independent of the source, the described motion is minuscule. One must keep in mind that the observed CF vortices shift of
${\it\Phi}_{1}$
is physical and pertains to a low-frequency spanwise shift of the stationary structures. This further justifies the extremely high energy content of this mode, since it is essentially a mean flow distortion. The source of such movement can currently only be conjectured. A possible cause is a low-frequency modulation of the free stream flow due to unsteadiness inherent to the wind tunnel or other environmental factors. Such an effect would eventually modulate the local Reynolds number and consequently the stability characteristics of the boundary layer, including the wavenumber angle of the 9 mm CF mode. An alternative explanation would be a vortex self-induction oscillatory movement due to the presence of the wall. Fluctuations of the stagnation line or stemming from the wind tunnel walls turbulent boundary layer could also cause similar structures. Independent of the source, the described motion is minuscule. One must keep in mind that the observed CF vortices shift of
 ${\it\sigma}=\pm 0.12$
mm at
${\it\sigma}=\pm 0.12$
mm at
 $X=0.45c_{X}$
(figure 24
a) would be caused by a change of wavenumber angle of just
$X=0.45c_{X}$
(figure 24
a) would be caused by a change of wavenumber angle of just
 ${\it\delta}{\it\Psi}=\tan ^{-1}({\it\sigma}/X)=\pm 0.011^{\circ }$
(assuming the stationary CF vortices stem from the discrete roughness elements). Additionally, it is likely that such behaviour has not been reported so far in the literature due to the lack of spatially correlated, low-frequency measurements. In the numerical simulations, a perfect spanwise uniformity is usually prescribed, which although desired, cannot be fully achieved in experimental frameworks. In order to better show the effect of this mode on the stationary waves, a flow field reconstruction based on the mean flow and on the first POD mode has been performed. This is presented in movie 1 provided as supplementary material available at http://dx.doi.org/10.1017/jfm.2016.379.
${\it\delta}{\it\Psi}=\tan ^{-1}({\it\sigma}/X)=\pm 0.011^{\circ }$
(assuming the stationary CF vortices stem from the discrete roughness elements). Additionally, it is likely that such behaviour has not been reported so far in the literature due to the lack of spatially correlated, low-frequency measurements. In the numerical simulations, a perfect spanwise uniformity is usually prescribed, which although desired, cannot be fully achieved in experimental frameworks. In order to better show the effect of this mode on the stationary waves, a flow field reconstruction based on the mean flow and on the first POD mode has been performed. This is presented in movie 1 provided as supplementary material available at http://dx.doi.org/10.1017/jfm.2016.379.
To assess whether the fluctuations pertaining to this mode are captured also by the hot-wire experiment, the same procedure of bandpass filtering the measured time series done in § 6.2 is repeated, considering one single CF vortex and using second-order Butterworth filters. The signal is therefore filtered in bands of 20 Hz width, ranging from 1 Hz to 100 Hz (
 $0.05\leqslant St\leqslant 4.97$
). Comparison between the several bands is made applying (6.1). Strong fluctuations are revealed only by the lower-frequency band, spanning between
$0.05\leqslant St\leqslant 4.97$
). Comparison between the several bands is made applying (6.1). Strong fluctuations are revealed only by the lower-frequency band, spanning between
 $St=0.05$
and
$St=0.05$
and
 $St=0.99$
(
$St=0.99$
(
 $1~\text{Hz}\leqslant f\leqslant 20~\text{Hz}$
). This band features almost 55 % of the total full-spectrum amplitude (
$1~\text{Hz}\leqslant f\leqslant 20~\text{Hz}$
). This band features almost 55 % of the total full-spectrum amplitude (
 $A_{II}^{tot}$
). For comparison, referring to the definitions given in § 6.2, the band 1, pertaining to the type-III mode, encompasses at this station
$A_{II}^{tot}$
). For comparison, referring to the definitions given in § 6.2, the band 1, pertaining to the type-III mode, encompasses at this station
 $0.30A_{II}^{tot}$
. The high-frequency band 2 (type-I mode) and band 3 (type-II mode) pertain to
$0.30A_{II}^{tot}$
. The high-frequency band 2 (type-I mode) and band 3 (type-II mode) pertain to
 $0.031A_{II}^{tot}$
and
$0.031A_{II}^{tot}$
and
 $0.035A_{II}^{tot}$
, respectively (it must be noted that because of leakage through the digital filters, the sum of all bands’ amplitudes will be larger than the full-spectrum one. As such, these results are to be considered as a qualitative relative comparison among the different bands).
$0.035A_{II}^{tot}$
, respectively (it must be noted that because of leakage through the digital filters, the sum of all bands’ amplitudes will be larger than the full-spectrum one. As such, these results are to be considered as a qualitative relative comparison among the different bands).

Figure 25. Non-dimensional fluctuation fields (a) from the reconstructed POD mode 1 and from the hot-wire measurement bands: (b)
 $0.05\leqslant St\leqslant 0.99$
(
$0.05\leqslant St\leqslant 0.99$
(
 $1~\text{Hz}\leqslant f\leqslant 20~\text{Hz}$
) and (c)
$1~\text{Hz}\leqslant f\leqslant 20~\text{Hz}$
) and (c)
 $0.99\leqslant St\leqslant 1.99$
(
$0.99\leqslant St\leqslant 1.99$
(
 $20~\text{Hz}\leqslant f\leqslant 40~\text{Hz}$
) (10 levels between 0 and
$20~\text{Hz}\leqslant f\leqslant 40~\text{Hz}$
) (10 levels between 0 and
 $0.08|\bar{V}_{e}^{HWA}|$
). Cross-cut fields at
$0.08|\bar{V}_{e}^{HWA}|$
). Cross-cut fields at
 $X/c_{X}=0.45$
.
$X/c_{X}=0.45$
.
The fluctuation field, reconstructed from the POD mode
 ${\it\Phi}_{1}$
, is presented in figure 25 together with the r.m.s. fields of bands
${\it\Phi}_{1}$
, is presented in figure 25 together with the r.m.s. fields of bands
 $0.05\leqslant St\leqslant 0.99$
(
$0.05\leqslant St\leqslant 0.99$
(
 $1~\text{Hz}\leqslant f\leqslant 20~\text{Hz}$
) and
$1~\text{Hz}\leqslant f\leqslant 20~\text{Hz}$
) and
 $0.99\leqslant St\leqslant 1.99$
(
$0.99\leqslant St\leqslant 1.99$
(
 $20~\text{Hz}\leqslant f\leqslant 40~\text{Hz}$
). The POD r.m.s. field features similar structures compared to the lowest-frequency field, thus suggesting that the fluctuations pertaining to the POD mode 1 occur at frequencies contained in the
$20~\text{Hz}\leqslant f\leqslant 40~\text{Hz}$
). The POD r.m.s. field features similar structures compared to the lowest-frequency field, thus suggesting that the fluctuations pertaining to the POD mode 1 occur at frequencies contained in the
 $0.05\leqslant St\leqslant 0.99$
(
$0.05\leqslant St\leqslant 0.99$
(
 $1~\text{Hz}\leqslant f\leqslant 20~\text{Hz}$
) band. The high energy level of this unsteady phenomenon was also captured by the POD energy distribution (figure 22).
$1~\text{Hz}\leqslant f\leqslant 20~\text{Hz}$
) band. The high energy level of this unsteady phenomenon was also captured by the POD energy distribution (figure 22).
Despite the theoretically interesting aspects regarding the origin of mode
 ${\it\Phi}_{1}$
, the rather low-frequency oscillation of the stationary CF vortices is unlikely to be related to other unsteady transition modes or to play any appreciable role in the transition process. Nevertheless, this low-frequency mode should be taken into account in experimental investigations as it features high energy levels, especially when compared to the energies of the arising secondary instability modes.
${\it\Phi}_{1}$
, the rather low-frequency oscillation of the stationary CF vortices is unlikely to be related to other unsteady transition modes or to play any appreciable role in the transition process. Nevertheless, this low-frequency mode should be taken into account in experimental investigations as it features high energy levels, especially when compared to the energies of the arising secondary instability modes.
6.3.2 Type-III instability
POD modes
 ${\it\Phi}_{6}$
and
${\it\Phi}_{6}$
and
 ${\it\Phi}_{7}$
are the most energetic modes which are harmonically coupled and feature a wavelength relevant to the transition process. Respective isosurfaces to the ones presented for mode
${\it\Phi}_{7}$
are the most energetic modes which are harmonically coupled and feature a wavelength relevant to the transition process. Respective isosurfaces to the ones presented for mode
 ${\it\Phi}_{1}$
are presented in figure 26(a) for mode
${\it\Phi}_{1}$
are presented in figure 26(a) for mode
 ${\it\Phi}_{7}$
(mode
${\it\Phi}_{7}$
(mode
 ${\it\Phi}_{6}$
is physically similar and phase shifted by
${\it\Phi}_{6}$
is physically similar and phase shifted by
 ${\rm\pi}/2$
). The isosurfaces reveal an elongated low-speed/high-speed pair forming in the inner upwelling region of the stationary CF vortex. The orientation of these structures with respect to the primary stationary waves can be quantified by defining an azimuthal angle (
${\rm\pi}/2$
). The isosurfaces reveal an elongated low-speed/high-speed pair forming in the inner upwelling region of the stationary CF vortex. The orientation of these structures with respect to the primary stationary waves can be quantified by defining an azimuthal angle (
 ${\it\chi}$
) and an elevation angle (
${\it\chi}$
) and an elevation angle (
 ${\it\gamma}$
), as indicated in the schematic of figure 26(b). The secondary structures axis is denoted by the grey line and the angles are considered positive in the direction shown by the arrows. For the structures pertaining to this mode, the respective angles are:
${\it\gamma}$
), as indicated in the schematic of figure 26(b). The secondary structures axis is denoted by the grey line and the angles are considered positive in the direction shown by the arrows. For the structures pertaining to this mode, the respective angles are:
 ${\it\chi}=-0.8^{\circ }$
and
${\it\chi}=-0.8^{\circ }$
and
 ${\it\gamma}=3.5^{\circ }$
. In the investigation of the swept flat plate with streamwise pressure gradient, Bonfigli & Kloker (Reference Bonfigli and Kloker2007) describe similar structures whose spinning direction is the same as the one of the primary stationary vortices. They report a null azimuthal angle considering the vortices orientation at their centroid, whereas the estimation of the elevation is not clear (refer to figure 33 of Bonfigli & Kloker Reference Bonfigli and Kloker2007).
${\it\gamma}=3.5^{\circ }$
. In the investigation of the swept flat plate with streamwise pressure gradient, Bonfigli & Kloker (Reference Bonfigli and Kloker2007) describe similar structures whose spinning direction is the same as the one of the primary stationary vortices. They report a null azimuthal angle considering the vortices orientation at their centroid, whereas the estimation of the elevation is not clear (refer to figure 33 of Bonfigli & Kloker Reference Bonfigli and Kloker2007).

Figure 26. (a) Isosurfaces of
 $U_{W}/\bar{U}_{We}=\pm 0.086$
for POD mode
$U_{W}/\bar{U}_{We}=\pm 0.086$
for POD mode
 ${\it\Phi}_{7}$
. Three contours of
${\it\Phi}_{7}$
. Three contours of
 $\bar{U}_{W}/\bar{U}_{We}$
at
$\bar{U}_{W}/\bar{U}_{We}$
at
 $X_{W}=-15$
, 0 and 15 mm (10 levels from 0 to 1). (b) Definition of elevation angle (
$X_{W}=-15$
, 0 and 15 mm (10 levels from 0 to 1). (b) Definition of elevation angle (
 ${\it\gamma}$
) and azimuthal angle (
${\it\gamma}$
) and azimuthal angle (
 ${\it\chi}$
). The grey line represents the vortex axis and the angles are defined positive by the arrows.
${\it\chi}$
). The grey line represents the vortex axis and the angles are defined positive by the arrows.
The spatial phase shift of the mode pair can be better assessed by extracting a single plane from the presented volume. This is done at
 $Z_{W}=2.5$
mm, where the structure attain to higher values, and the resulting contours are plotted in figure 27(a) for mode
$Z_{W}=2.5$
mm, where the structure attain to higher values, and the resulting contours are plotted in figure 27(a) for mode
 ${\it\Phi}_{6}$
and figure 27(c) for mode
${\it\Phi}_{6}$
and figure 27(c) for mode
 ${\it\Phi}_{7}$
. Moreover, the measured velocity along a line at constant
${\it\Phi}_{7}$
. Moreover, the measured velocity along a line at constant
 $y_{t}$
is further extracted from these planes, at the location of the white dotted line of figure 27(a,c), and plotted in figure 27(b,d).
$y_{t}$
is further extracted from these planes, at the location of the white dotted line of figure 27(a,c), and plotted in figure 27(b,d).

Figure 27. Contour of
 $U_{W}/\bar{U}_{We}$
(10 levels between
$U_{W}/\bar{U}_{We}$
(10 levels between
 $\pm 0.39$
) in planes extracted at
$\pm 0.39$
) in planes extracted at
 $Z_{W}=2.5$
mm from the volume of figure 26(a) pertaining to POD modes
$Z_{W}=2.5$
mm from the volume of figure 26(a) pertaining to POD modes
 ${\it\Phi}_{6}$
(a) and
${\it\Phi}_{6}$
(a) and
 ${\it\Phi}_{7}$
(c). (b), (d) Velocity sampled along the white dotted line of (a) and (c), respectively.
${\it\Phi}_{7}$
(c). (b), (d) Velocity sampled along the white dotted line of (a) and (c), respectively.
The phase shift of the two modes is
 ${\rm\pi}/2$
, establishing the convective nature of these structures. Furthermore, the extracted velocity at constant
${\rm\pi}/2$
, establishing the convective nature of these structures. Furthermore, the extracted velocity at constant
 $Z_{W}$
and
$Z_{W}$
and
 $y_{t}$
provides the wavelength of the structures, which turns out to be
$y_{t}$
provides the wavelength of the structures, which turns out to be
 ${\it\lambda}_{X_{W}}^{6-7}\approx 25$
mm. Inspecting the isosurfaces of figure 26(a), it can be commented that these structures are located in the inner side of the upwelling region of the stationary CF vortices, where the low-frequency fluctuation field has a local maximum (compare with figure 20). The spectral analysis of the hot-wire signal at this location revealed notable energy in the frequency band of
${\it\lambda}_{X_{W}}^{6-7}\approx 25$
mm. Inspecting the isosurfaces of figure 26(a), it can be commented that these structures are located in the inner side of the upwelling region of the stationary CF vortices, where the low-frequency fluctuation field has a local maximum (compare with figure 20). The spectral analysis of the hot-wire signal at this location revealed notable energy in the frequency band of
 $17.4\leqslant St\leqslant 27.3$
(
$17.4\leqslant St\leqslant 27.3$
(
 $350~\text{Hz}\leqslant f\leqslant 550~\text{Hz}$
) (figure 19). The measured mean out-of-plane velocity at this location is
$350~\text{Hz}\leqslant f\leqslant 550~\text{Hz}$
) (figure 19). The measured mean out-of-plane velocity at this location is
 $\bar{U}_{W}\approx 0.65\bar{U}_{We}$
. This can be directly associated with the phase velocity of the convective structure (
$\bar{U}_{W}\approx 0.65\bar{U}_{We}$
. This can be directly associated with the phase velocity of the convective structure (
 $u_{c}^{6-7}$
) (Chernoray et al.
Reference Chernoray, Dovgal, Kozlov and Löfdahl2005; Bonfigli & Kloker Reference Bonfigli and Kloker2007). Kawakami et al. (Reference Kawakami, Kohama and Okutsu1999) report a value of 0.47 times the local external velocity for the convecting velocity of these structures. Applying Taylor’s hypothesis, which entails that the convective velocity and structure wavelength do not change appreciably within the considered spatial domain, yields the temporal frequency that would be measured at a fixed point in the boundary layer intersected by this mode as
$u_{c}^{6-7}$
) (Chernoray et al.
Reference Chernoray, Dovgal, Kozlov and Löfdahl2005; Bonfigli & Kloker Reference Bonfigli and Kloker2007). Kawakami et al. (Reference Kawakami, Kohama and Okutsu1999) report a value of 0.47 times the local external velocity for the convecting velocity of these structures. Applying Taylor’s hypothesis, which entails that the convective velocity and structure wavelength do not change appreciably within the considered spatial domain, yields the temporal frequency that would be measured at a fixed point in the boundary layer intersected by this mode as
 $St\approx 24.9$
(
$St\approx 24.9$
(
 $f\approx 500$
Hz). The estimated frequency and the pertaining boundary layer region affirm that the structures captured by the harmonically coupled POD modes
$f\approx 500$
Hz). The estimated frequency and the pertaining boundary layer region affirm that the structures captured by the harmonically coupled POD modes
 ${\it\Phi}_{6}$
and
${\it\Phi}_{6}$
and
 ${\it\Phi}_{7}$
are the effect on the primary stationary crossflow waves of type-III instability. These conclusions agree with the description of this instability mode presented in previous studies (Högberg & Henningson Reference Högberg and Henningson1998; Kawakami et al.
Reference Kawakami, Kohama and Okutsu1999; Janke & Balakumar Reference Janke and Balakumar2000; Wassermann & Kloker Reference Wassermann and Kloker2003; Bonfigli & Kloker Reference Bonfigli and Kloker2007). It should be noted that the isosurfaces in figure 26(a) do not show appreciable growth within the presented domain, consistent with HWA measurements of figure 21(a,b). A composite visualisation of this mode can be performed by reconstructing the two pertinent POD modes (
${\it\Phi}_{7}$
are the effect on the primary stationary crossflow waves of type-III instability. These conclusions agree with the description of this instability mode presented in previous studies (Högberg & Henningson Reference Högberg and Henningson1998; Kawakami et al.
Reference Kawakami, Kohama and Okutsu1999; Janke & Balakumar Reference Janke and Balakumar2000; Wassermann & Kloker Reference Wassermann and Kloker2003; Bonfigli & Kloker Reference Bonfigli and Kloker2007). It should be noted that the isosurfaces in figure 26(a) do not show appreciable growth within the presented domain, consistent with HWA measurements of figure 21(a,b). A composite visualisation of this mode can be performed by reconstructing the two pertinent POD modes (
 ${\it\Phi}_{6}$
and
${\it\Phi}_{6}$
and
 ${\it\Phi}_{7}$
) multiplied respectively with artificial sinusoidal signals, in phase quadrature, at the estimated frequency of
${\it\Phi}_{7}$
) multiplied respectively with artificial sinusoidal signals, in phase quadrature, at the estimated frequency of
 $St\approx 24.9$
(
$St\approx 24.9$
(
 $f\approx 500$
Hz). This is presented in movie 2, provided as supplementary material.
$f\approx 500$
Hz). This is presented in movie 2, provided as supplementary material.
6.3.3 Type-I instability
Following an approach similar to that for the POD modes
 ${\it\Phi}_{6}$
and
${\it\Phi}_{6}$
and
 ${\it\Phi}_{7}$
,
${\it\Phi}_{7}$
,
 ${\it\Phi}_{9}$
and
${\it\Phi}_{9}$
and
 ${\it\Phi}_{10}$
are identified as the second harmonically coupled pair of POD modes. Velocity isosurfaces of mode
${\it\Phi}_{10}$
are identified as the second harmonically coupled pair of POD modes. Velocity isosurfaces of mode
 ${\it\Phi}_{9}$
are presented in figure 28. The structures revealed here (isosurfaces at
${\it\Phi}_{9}$
are presented in figure 28. The structures revealed here (isosurfaces at
 $U_{W}/\bar{U}_{We}=\pm 0.086$
) are significantly different to the ones pertaining to modes
$U_{W}/\bar{U}_{We}=\pm 0.086$
) are significantly different to the ones pertaining to modes
 ${\it\Phi}_{6}$
and
${\it\Phi}_{6}$
and
 ${\it\Phi}_{7}$
, appearing as a more narrowly spaced sequence of high-speed/low-speed fingers. The axis of these structures is tilted at a notable angle with respect to the stationary CF axis and pointing towards the upper bound of the domain, leading to azimuthal and elevation angles of
${\it\Phi}_{7}$
, appearing as a more narrowly spaced sequence of high-speed/low-speed fingers. The axis of these structures is tilted at a notable angle with respect to the stationary CF axis and pointing towards the upper bound of the domain, leading to azimuthal and elevation angles of
 ${\it\chi}=-18.2^{\circ }$
and
${\it\chi}=-18.2^{\circ }$
and
 ${\it\gamma}=21^{\circ }$
, respectively. Bonfigli & Kloker (Reference Bonfigli and Kloker2007) report, for their flat plate flow, angles of
${\it\gamma}=21^{\circ }$
, respectively. Bonfigli & Kloker (Reference Bonfigli and Kloker2007) report, for their flat plate flow, angles of
 ${\it\chi}=-18.2^{\circ }$
and
${\it\chi}=-18.2^{\circ }$
and
 ${\it\gamma}=12^{\circ }$
; Janke & Balakumar (Reference Janke and Balakumar2000) and Wassermann & Kloker (Reference Wassermann and Kloker2002) report, for similar flow cases, the azimuthal inclination for this type of mode to be
${\it\gamma}=12^{\circ }$
; Janke & Balakumar (Reference Janke and Balakumar2000) and Wassermann & Kloker (Reference Wassermann and Kloker2002) report, for similar flow cases, the azimuthal inclination for this type of mode to be
 ${\it\chi}=-29.9^{\circ }$
and
${\it\chi}=-29.9^{\circ }$
and
 ${\it\chi}=-20^{\circ }$
, respectively. Despite the differences in the estimated orientation of these secondary vortices, it is clear from all the reported studies that they are inclined at a relevant angle with respect to the axis of the primary vortices. The orientation of these structures is a direct cause of their topology. In fact, by spanning almost all the boundary layer thickness, they are advected with different velocities pertaining to the different wall-normal regions, thus showing the reported helicoidal shape.
${\it\chi}=-20^{\circ }$
, respectively. Despite the differences in the estimated orientation of these secondary vortices, it is clear from all the reported studies that they are inclined at a relevant angle with respect to the axis of the primary vortices. The orientation of these structures is a direct cause of their topology. In fact, by spanning almost all the boundary layer thickness, they are advected with different velocities pertaining to the different wall-normal regions, thus showing the reported helicoidal shape.

Figure 28. Isosurfaces of
 $U_{W}/\bar{U}_{We}=\pm 0.086$
for POD mode
$U_{W}/\bar{U}_{We}=\pm 0.086$
for POD mode
 ${\it\Phi}_{10}$
. Three contours of
${\it\Phi}_{10}$
. Three contours of
 $\bar{U}_{W}/\bar{U}_{We}$
at
$\bar{U}_{W}/\bar{U}_{We}$
at
 $X_{W}=-15$
, 0 and 15 mm (10 levels from 0 to 1).
$X_{W}=-15$
, 0 and 15 mm (10 levels from 0 to 1).
Additionally, the structures are located in the outer side of the upwelling region of the primary vortices and are, on average, further away from the wall than modes
 ${\it\Phi}_{6}$
and
${\it\Phi}_{6}$
and
 ${\it\Phi}_{7}$
. This is the location of the type-I secondary instability (e.g. Deyhle & Bippes Reference Deyhle and Bippes1996; Högberg & Henningson Reference Högberg and Henningson1998; Malik et al.
Reference Malik, Li, Choudhari and Chang1999; Wassermann & Kloker Reference Wassermann and Kloker2002; White & Saric Reference White and Saric2005). The general topological features revealed by modes
${\it\Phi}_{7}$
. This is the location of the type-I secondary instability (e.g. Deyhle & Bippes Reference Deyhle and Bippes1996; Högberg & Henningson Reference Högberg and Henningson1998; Malik et al.
Reference Malik, Li, Choudhari and Chang1999; Wassermann & Kloker Reference Wassermann and Kloker2002; White & Saric Reference White and Saric2005). The general topological features revealed by modes
 ${\it\Phi}_{9}$
and
${\it\Phi}_{9}$
and
 ${\it\Phi}_{10}$
are similar to those presented in cross-cut planes, by Högberg & Henningson (Reference Högberg and Henningson1998), Kawakami et al. (Reference Kawakami, Kohama and Okutsu1999), Malik et al. (Reference Malik, Li, Choudhari and Chang1999) and Janke & Balakumar (Reference Janke and Balakumar2000) and to those described, in their three-dimensional organisation, by Wassermann & Kloker (Reference Wassermann and Kloker2002, Reference Wassermann and Kloker2003), Bonfigli & Kloker (Reference Bonfigli and Kloker2007) and by Chernoray et al. (Reference Chernoray, Dovgal, Kozlov and Löfdahl2005).
${\it\Phi}_{10}$
are similar to those presented in cross-cut planes, by Högberg & Henningson (Reference Högberg and Henningson1998), Kawakami et al. (Reference Kawakami, Kohama and Okutsu1999), Malik et al. (Reference Malik, Li, Choudhari and Chang1999) and Janke & Balakumar (Reference Janke and Balakumar2000) and to those described, in their three-dimensional organisation, by Wassermann & Kloker (Reference Wassermann and Kloker2002, Reference Wassermann and Kloker2003), Bonfigli & Kloker (Reference Bonfigli and Kloker2007) and by Chernoray et al. (Reference Chernoray, Dovgal, Kozlov and Löfdahl2005).

Figure 29. Contour of
 $U_{W}/\bar{U}_{We}$
(10 levels between
$U_{W}/\bar{U}_{We}$
(10 levels between
 $\pm 0.39$
) in planes extracted at
$\pm 0.39$
) in planes extracted at
 $Z_{W}=2$
mm from the volume of figure 28 pertaining to POD modes
$Z_{W}=2$
mm from the volume of figure 28 pertaining to POD modes
 ${\it\Phi}_{9}$
(a) and
${\it\Phi}_{9}$
(a) and
 ${\it\Phi}_{10}$
(c). (b), (d) Velocity sampled along the white dotted line of (a) and (c), respectively.
${\it\Phi}_{10}$
(c). (b), (d) Velocity sampled along the white dotted line of (a) and (c), respectively.
The constant plane velocity contours, extracted at
 $Z_{W}=2.0$
mm, and the velocity sampled along a line, at constant
$Z_{W}=2.0$
mm, and the velocity sampled along a line, at constant
 $Z_{W}$
and
$Z_{W}$
and
 $y_{t}$
, are shown in figure 29 for POD modes
$y_{t}$
, are shown in figure 29 for POD modes
 ${\it\Phi}_{9}$
and
${\it\Phi}_{9}$
and
 ${\it\Phi}_{10}$
. The phase quadrature of the POD modes is again evident, thus confirming the convecting nature of the reported structures. The inferred wavelength (
${\it\Phi}_{10}$
. The phase quadrature of the POD modes is again evident, thus confirming the convecting nature of the reported structures. The inferred wavelength (
 ${\it\lambda}_{X_{W}}^{9-10}$
) is approximately 4.6 mm. The structures are on average located further from the wall than the primary travelling crossflow and thus are subject to a higher average convective velocity of
${\it\lambda}_{X_{W}}^{9-10}$
) is approximately 4.6 mm. The structures are on average located further from the wall than the primary travelling crossflow and thus are subject to a higher average convective velocity of
 $u_{c}^{9-10}\approx 0.8\bar{U}_{We}$
(Malik et al. (Reference Malik, Li, Choudhari and Chang1999) report
$u_{c}^{9-10}\approx 0.8\bar{U}_{We}$
(Malik et al. (Reference Malik, Li, Choudhari and Chang1999) report
 $0.84U_{\infty }$
; Kawakami et al. (Reference Kawakami, Kohama and Okutsu1999) find 78 % of the local external velocity). Considering the Taylor hypothesis, a temporal frequency of approximately
$0.84U_{\infty }$
; Kawakami et al. (Reference Kawakami, Kohama and Okutsu1999) find 78 % of the local external velocity). Considering the Taylor hypothesis, a temporal frequency of approximately
 $St=248.0$
(
$St=248.0$
(
 $f=5000$
Hz) is estimated. This frequency is within the dominant band measured with the hot-wire on the outer side of the upwelling region of the boundary layer (figure 20).
$f=5000$
Hz) is estimated. This frequency is within the dominant band measured with the hot-wire on the outer side of the upwelling region of the boundary layer (figure 20).
Moreover the strong spatial growth along
 $X_{W}$
of these modes is evident as their initial appearance occurs around
$X_{W}$
of these modes is evident as their initial appearance occurs around
 $X_{W}=0$
which coincides to the wing
$X_{W}=0$
which coincides to the wing
 $X/c_{X}=0.45$
station. This further justifies the position of these modes in the POD energy distribution (figure 22) and demonstrates the insufficiency of modal energy as a selection criterion for relevant modes related to secondary instability phenomena. Modal decompositions based instead on modes spatial amplification, such as dynamic mode decomposition (DMD), would be more effective for these investigations but unfortunately would require spatio-temporal correlated measurements. The
$X/c_{X}=0.45$
station. This further justifies the position of these modes in the POD energy distribution (figure 22) and demonstrates the insufficiency of modal energy as a selection criterion for relevant modes related to secondary instability phenomena. Modal decompositions based instead on modes spatial amplification, such as dynamic mode decomposition (DMD), would be more effective for these investigations but unfortunately would require spatio-temporal correlated measurements. The
 $X/c_{X}=0.45$
station has been shown to be the location where primary stationary CF vortices saturate (figure 11). Additionally, this corresponds to the location where the sudden growth of the high-frequency secondary instability modes occurs (figure 21
a). These considerations lead to the conclusion that what is captured by POD modes
$X/c_{X}=0.45$
station has been shown to be the location where primary stationary CF vortices saturate (figure 11). Additionally, this corresponds to the location where the sudden growth of the high-frequency secondary instability modes occurs (figure 21
a). These considerations lead to the conclusion that what is captured by POD modes
 ${\it\Phi}_{9}$
and
${\it\Phi}_{9}$
and
 ${\it\Phi}_{10}$
is the footprint, in terms of
${\it\Phi}_{10}$
is the footprint, in terms of
 $U_{W}$
modulation, of the type-I secondary instability. Similar to what was done for the type-III mode, a time evolution visualisation of this instability mode is performed by reconstructing the two pertinent POD modes (
$U_{W}$
modulation, of the type-I secondary instability. Similar to what was done for the type-III mode, a time evolution visualisation of this instability mode is performed by reconstructing the two pertinent POD modes (
 ${\it\Phi}_{9}$
and
${\it\Phi}_{9}$
and
 ${\it\Phi}_{10}$
) multiplied respectively with artificial sinusoidal signals at the estimated frequency of
${\it\Phi}_{10}$
) multiplied respectively with artificial sinusoidal signals at the estimated frequency of
 $St=248.0$
(
$St=248.0$
(
 $f=5000$
Hz) and presented in movie 3, provided as supplementary material.
$f=5000$
Hz) and presented in movie 3, provided as supplementary material.
6.3.4 Some considerations on the current experiment and future PIV applications
The spatial organisation of the low-frequency type-III mode and the type-I high-frequency secondary instability has been captured by POD of the tomo-PIV fields. The derived properties of the coupled POD modes related to type-III and type-I modes described in this section are summarised in table 1.
Table 1. Properties of POD modes related to secondary instability modes.

These results offer the first three-dimensional experimental measurement of these structures under natural flow conditions, offering an important comparison to the outcomes of e.g. Högberg & Henningson (Reference Högberg and Henningson1998), Malik et al. (Reference Malik, Li, Choudhari and Chang1999), Koch (Reference Koch2002), Wassermann & Kloker (Reference Wassermann and Kloker2002, Reference Wassermann and Kloker2003) and Bonfigli & Kloker (Reference Bonfigli and Kloker2007) regarding the spatial organisation and the convecting nature of these modes, although the experiments performed by Kawakami et al. (Reference Kawakami, Kohama and Okutsu1999) and Chernoray et al. (Reference Chernoray, Dovgal, Kozlov and Löfdahl2005) forcing the unsteady modes gave already illuminating outcomes in this regard.
Few other POD modes showed similar structures to the ones presented in figure 28. This is expected given the broad spectral band of the type-I secondary instability seen in the previous section. Nonetheless, they did not feature a clear relative phase shift and therefore are not considered. No modes in the domain investigated by POD showed structures related to the type-II secondary vortices and hence no comparison with the hot-wire results presented in § 6.2 can be performed. It is likely that having a more extended domain in the downstream region would lead to the capturing of the type-II mode as well as its interaction with the other instability modes until the turbulent breakdown.
To conclude, a comment regarding future directions for particle velocimetry techniques for measurement of CF instability-dominated flows can be given here. Due to the low sampling rate of the performed tomo-PIV experiment, the temporal evolution of the unsteady flow structures cannot be directly measured. The latter has been estimated by evaluating their spatial wavelength and convective nature using the POD analysis. This has been achieved assuming the convective velocity to be the local average flow velocity and by comparing the estimated frequency with the HWA measurements. Nevertheless, it would be desirable to directly measure the full spatio-temporal development of this type of structure, especially in the area of turbulent breakdown, where spatial and temporal coherency are low. Furthermore, it would allow the application of more suited decomposition analyses of the unsteady field as, for instance, DMD. To this end, time-resolved tomo-PIV experiments (at sampling rates of the order of 20 kHz, for the present flow case) could be attempted, although several limitations reduce considerably the feasibility of such an approach. The main limitation appears to be the light intensity of modern high-speed lasers, which is further limited when volume illumination is necessary. Moreover, even for the most advanced CMOS cameras, these frequencies are extremely challenging for the acquisition bandwidth. As such, the active portion of the sensor would be severely reduced, with the consequent limitations on available resolution/domain size. With current technology, an intermediate approach, although restricted to the investigation of cross-cut planes, based on high-speed planar PIV measurements can instead be chosen.
7 Conclusions
This study considered the boundary layer on the pressure side of a
 $45^{\circ }$
swept wing operated at
$45^{\circ }$
swept wing operated at
 $Re=2.17\times 10^{6}$
and
$Re=2.17\times 10^{6}$
and
 $M=0.075$
at
$M=0.075$
at
 $3^{\circ }$
angle of attack. The stability characteristics of this flow were first inferred by means of linear stability theory. This analysis indicated growth of stationary and travelling CF waves, within the band of
$3^{\circ }$
angle of attack. The stability characteristics of this flow were first inferred by means of linear stability theory. This analysis indicated growth of stationary and travelling CF waves, within the band of
 $0\leqslant St\leqslant 15$
(
$0\leqslant St\leqslant 15$
(
 $0~\text{Hz}\leqslant f\leqslant 300~\text{Hz}$
). Furthermore, the wavelength pertaining to the most amplified stationary instability was predicted at
$0~\text{Hz}\leqslant f\leqslant 300~\text{Hz}$
). Furthermore, the wavelength pertaining to the most amplified stationary instability was predicted at
 ${\it\lambda}_{z}=9.10$
mm. Preliminary surface flow visualisation studies (Serpieri & Kotsonis Reference Serpieri and Kotsonis2015a
,Reference Serpieri and Kotsonis
b
) partially confirmed the outcomes of the LST analysis. For the current study, the wavelength of the stationary modes was fixed to 9 mm applying micron-sized discrete roughness elements at the wing leading edge (following the work of Reibert et al. (Reference Reibert, Saric, Carrillo and Chapman1996), Radeztsky et al. (Reference Radeztsky, Reibert and Saric1999), White & Saric (Reference White and Saric2005)).
${\it\lambda}_{z}=9.10$
mm. Preliminary surface flow visualisation studies (Serpieri & Kotsonis Reference Serpieri and Kotsonis2015a
,Reference Serpieri and Kotsonis
b
) partially confirmed the outcomes of the LST analysis. For the current study, the wavelength of the stationary modes was fixed to 9 mm applying micron-sized discrete roughness elements at the wing leading edge (following the work of Reibert et al. (Reference Reibert, Saric, Carrillo and Chapman1996), Radeztsky et al. (Reference Radeztsky, Reibert and Saric1999), White & Saric (Reference White and Saric2005)).
The developing stationary waves were inspected qualitatively through a flow visualisation experiment making use of fluorescent oil. This visualisation showed the effectiveness of the leading edge forcing in locking the stationary modes wavelength and indicated the turbulent breakdown front. The latter showed the typical jagged pattern previously reported (Saric et al. Reference Saric, Reed and White2003) with a spanwise-averaged onset at approximately the 50 % of the chord.
The organisation of the stationary CF vortices was quantified by hot-wire measurements at several constant-chord planes. Their streamwise evolution was evaluated in terms of amplitudes and
 $N$
-factors of the mode shape profiles. The primary stationary mode grows downstream until reaching a given saturation amplitude, after which it starts decaying (downstream of
$N$
-factors of the mode shape profiles. The primary stationary mode grows downstream until reaching a given saturation amplitude, after which it starts decaying (downstream of
 $X/c_{X}=0.45$
). Concurrently, unsteady fluctuations undergo sudden growth at this location. This phenomenon has been observed and related to the destabilisation of secondary high-frequency instability, superimposed on the primary stationary CF vortices (e.g. Högberg & Henningson Reference Högberg and Henningson1998; Kawakami et al.
Reference Kawakami, Kohama and Okutsu1999; Malik et al.
Reference Malik, Li, Choudhari and Chang1999; Wassermann & Kloker Reference Wassermann and Kloker2002; White & Saric Reference White and Saric2005) of Kelvin–Helmholtz nature (Bonfigli & Kloker Reference Bonfigli and Kloker2007).
$X/c_{X}=0.45$
). Concurrently, unsteady fluctuations undergo sudden growth at this location. This phenomenon has been observed and related to the destabilisation of secondary high-frequency instability, superimposed on the primary stationary CF vortices (e.g. Högberg & Henningson Reference Högberg and Henningson1998; Kawakami et al.
Reference Kawakami, Kohama and Okutsu1999; Malik et al.
Reference Malik, Li, Choudhari and Chang1999; Wassermann & Kloker Reference Wassermann and Kloker2002; White & Saric Reference White and Saric2005) of Kelvin–Helmholtz nature (Bonfigli & Kloker Reference Bonfigli and Kloker2007).
The hot-wire scans have been used as well to inspect the spectral content of the flow at several chord stations by means of single-point spectra and bandpass filtered r.m.s. contours. Travelling CF waves are contained within a band of
 $17.4\leqslant St\leqslant 27.3$
(
$17.4\leqslant St\leqslant 27.3$
(
 $350~\text{Hz}\leqslant f\leqslant 550~\text{Hz}$
), similar to that predicted by LST, and appear confined in the inner side of the upwelling region of the stationary vortices. The amplitude of the travelling CF vortices strongly increases throughout the inspected domain. Downstream of the stationary CF mode saturation, the growth of the travelling CF mode shows a steeper slope, suggesting an enhanced interaction with the stationary waves (Bippes Reference Bippes1999; Bonfigli & Kloker Reference Bonfigli and Kloker2007).
$350~\text{Hz}\leqslant f\leqslant 550~\text{Hz}$
), similar to that predicted by LST, and appear confined in the inner side of the upwelling region of the stationary vortices. The amplitude of the travelling CF vortices strongly increases throughout the inspected domain. Downstream of the stationary CF mode saturation, the growth of the travelling CF mode shows a steeper slope, suggesting an enhanced interaction with the stationary waves (Bippes Reference Bippes1999; Bonfigli & Kloker Reference Bonfigli and Kloker2007).
The high-frequency instability can be divided into two modes by the spectral content as well as by the boundary layer regions of pertinence. A mode centred in the band
 $248.0\leqslant St\leqslant 298.3$
(
$248.0\leqslant St\leqslant 298.3$
(
 $5~\text{kHz}\leqslant f\leqslant 6~\text{kHz}$
) occurs in the outer part of the upwelling region of the stationary CF vortices, overlapping to the local minimum of the mean velocity spanwise gradient. The observed fluctuations correspond to the type-I secondary instability (Högberg & Henningson Reference Högberg and Henningson1998; White & Saric Reference White and Saric2005; Wassermann & Kloker Reference Wassermann and Kloker2002) described by Malik et al. (Reference Malik, Li, Choudhari and Chang1999) as z-mode. From the location of stationary CF saturation, at
$5~\text{kHz}\leqslant f\leqslant 6~\text{kHz}$
) occurs in the outer part of the upwelling region of the stationary CF vortices, overlapping to the local minimum of the mean velocity spanwise gradient. The observed fluctuations correspond to the type-I secondary instability (Högberg & Henningson Reference Högberg and Henningson1998; White & Saric Reference White and Saric2005; Wassermann & Kloker Reference Wassermann and Kloker2002) described by Malik et al. (Reference Malik, Li, Choudhari and Chang1999) as z-mode. From the location of stationary CF saturation, at
 $X/c_{X}=0.45$
, this mode shows sudden abrupt growth.
$X/c_{X}=0.45$
, this mode shows sudden abrupt growth.
A second high-frequency mode is detected and quantified. It features higher-frequency content but reduced amplitude and growth rates compared to the type-I mode. This mode is contained within the band
 $348.0\leqslant St\leqslant 397.8$
(
$348.0\leqslant St\leqslant 397.8$
(
 $7~\text{kHz}\leqslant f\leqslant 8~\text{kHz}$
). From the filtered r.m.s. contours, it appears evolving in the top region of the stationary vortices. This instability was identified as the type-II mode (y-mode by Malik et al.
Reference Malik, Li, Choudhari and Chang1999) pertaining to regions of high-velocity shear in the wall-normal direction (White & Saric Reference White and Saric2005).
$7~\text{kHz}\leqslant f\leqslant 8~\text{kHz}$
). From the filtered r.m.s. contours, it appears evolving in the top region of the stationary vortices. This instability was identified as the type-II mode (y-mode by Malik et al.
Reference Malik, Li, Choudhari and Chang1999) pertaining to regions of high-velocity shear in the wall-normal direction (White & Saric Reference White and Saric2005).
In this study, the chordwise evolution of the primary stationary CF waves in the near proximity to their saturation location has been measured for the first time with tomographic PIV. This is a state-of-art flow diagnostic experimental technique allowing the simultaneous measurement of volumetric, three-component velocity fields. Compared to hot-wire scans, tomo-PIV time-averaged fields showed striking agreement.
Simultaneous volume measurements led to the analysis of the unsteady fluctuation field based on their spatial coherence. Proper orthogonal decomposition of the tomo-PIV flow fields led to the individuation of two pairs of modes in clear relative phase quadrature. Inspection of the spatial organisation of these two pairs of modes, in terms of wavelength and location with respect to the stationary CF vortices, was used to infer their correspondence to the secondary instability modes. The higher energy pair of POD modes refers to the type-III instability mode arising from the interaction between the travelling and the stationary CF waves (Fischer & Dallmann Reference Fischer and Dallmann1991; Högberg & Henningson Reference Högberg and Henningson1998; Janke & Balakumar Reference Janke and Balakumar2000; Bonfigli & Kloker Reference Bonfigli and Kloker2007). The lower energy pair is instead related to the high-frequency secondary type-I mode. The results are in good agreement with the dedicated studies of Högberg & Henningson (Reference Högberg and Henningson1998), Malik et al. (Reference Malik, Li, Choudhari and Chang1999), Kawakami et al. (Reference Kawakami, Kohama and Okutsu1999), Koch et al. (Reference Koch, Bertolotti, Stolte and Hein2000), Wassermann & Kloker (Reference Wassermann and Kloker2002), White & Saric (Reference White and Saric2005) and Bonfigli & Kloker (Reference Bonfigli and Kloker2007). Applying a convection velocity, based on the Taylor hypothesis and justified by the works of Kawakami et al. (Reference Kawakami, Kohama and Okutsu1999), Malik et al. (Reference Malik, Li, Choudhari and Chang1999), Wassermann & Kloker (Reference Wassermann and Kloker2002), Chernoray et al. (Reference Chernoray, Dovgal, Kozlov and Löfdahl2005), Bonfigli & Kloker (Reference Bonfigli and Kloker2007), these structures were indeed verified as modes type-III and type-I, respectively. The estimated frequencies correlated with the hot-wire measurements.
The most energetic mode identified by the POD analysis is of particular interest. It pertains alone to a much higher level of energy compared to all subsequent POD modes (approximately four times larger than the first pair of advecting modes) and presents structures aligned with the spanwise velocity shear. The mode appears as a low-frequency spanwise oscillation of the stationary CF vortices. Comparison with the hot-wire measurements suggests spectral features in the band of
 $0.05\leqslant St\leqslant 0.99$
(
$0.05\leqslant St\leqslant 0.99$
(
 $1~\text{Hz}\leqslant f\leqslant 20~\text{Hz}$
). The exact source of this mode cannot be established in this study. It appears that in an experimental framework, the stationary CF vortices, despite being fixed by the roughness elements at the leading edge, undergo an oscillatory position shift. The high energy pertaining to this mode is hence ascribed to a mean flow distortion which should be accounted for in experimental investigations.
$1~\text{Hz}\leqslant f\leqslant 20~\text{Hz}$
). The exact source of this mode cannot be established in this study. It appears that in an experimental framework, the stationary CF vortices, despite being fixed by the roughness elements at the leading edge, undergo an oscillatory position shift. The high energy pertaining to this mode is hence ascribed to a mean flow distortion which should be accounted for in experimental investigations.
The use of tomo-PIV allowed the detailed investigation of the steady and unsteady modes developing in a swept wing boundary layer subject to crossflow instability providing information that spatially uncorrelated measurements cannot infer. This led to the description of the three-dimensional spatial organisation and evolution of the unsteady modes. The measurements presented in this study offer an experimental comparison with the results of previous numerical and theoretical studies (e.g. Malik et al. Reference Malik, Li and Chang1994, Reference Malik, Li, Choudhari and Chang1999; Högberg & Henningson Reference Högberg and Henningson1998; Janke & Balakumar Reference Janke and Balakumar2000; Wassermann & Kloker Reference Wassermann and Kloker2002, Reference Wassermann and Kloker2003 and Bonfigli & Kloker Reference Bonfigli and Kloker2007). Despite this, the tomo-PIV investigation did not capture the last stages of the transition process and the turbulent breakdown due to limitations in domain size. A more downstream investigation is hence envisioned and will be a challenge for upcoming experimental work by the authors.
Acknowledgements
This research is funded by the Netherlands Organisation for Scientific Research NWO-STW under the Veni grant. The authors express their gratitude to Drs D. Ragni, S. Pröbsting and K. Lynch for sharing their expertise on tomo-PIV and to Mr L. Moelenwijck and Mr S. Bernardy for technical support. The contribution to the LST analysis of Mr J. Boersma and support and advice of Professor F. Scarano are greatly appreciated. The authors are thankful to the laboratory of Aero- and Hydro-Dynamics at the Faculty of Mechanical Engineering of TU Delft for provision of experimental equipment. The anonymous referees are acknowledged for their valuable comments.
Supplementary movies
Supplementary movies are available at http://dx.doi.org/10.1017/jfm.2016.379.