


Introduction
Barley belongs to genus Hordeum, which has more than 32 species (Terzi et al., Reference Terzi, Pecchioni, Faccioli, Kucera and Stanca2001). Cultivated barley (Hordeum vulgare ssp. vulgare, hereafter HVU) and its progenitor known as ‘wild barley’ (H. vulgare ssp. spontaneum, hereafter HSP) are two subspecies of H. vulgare, a diploid species with seven chromosome pairs (2n = 2x = 14) (Brown et al., Reference Brown, Nevo, Zohary and Dagan1978). Other wild barley species of genus Hordeum, which form the secondary and tertiary gene pool of barley, are diploid (2n = 2x = 14), autotetraploid (2n = 4x = 28) and autohexaploid (2n = 6x = 42) grass species. The natural distribution of wild species of barley ranges from the Mediterranean portion of the Middle East, across the Zagros Mountains (Iran), and into adjacent Southwest Asia (Morrell and Clegg, Reference Morrell, Clegg and Kole2011). From the wild species of genus Hordeum, H. murinum (HMU) and H. marinum (HMA) are more abundant in Iran and are known as typical weeds in the farms. Many of the wild Hordeum species including H. bogdanii, H. secalinum, H. depressum, H. patagonicum, H. bulbosum, HMA, H. euclaston, H. pusillum and H. arizonicum were found in drought and salt-affected dryland habitats, and therefore could be a useful source of tolerance to salt and drought stress (Mano and Takeda, Reference Mano and Takeda1998).
Wild barley species have many desirable traits, including tolerance for drought stress, which could be used for barley improvement (Johnston et al., Reference Johnston, Timmerman-Vaughan, Farnden and Pickering2009). In the past years, genetic diversity and drought stress response of HVU and HSP genotypes belonging to different geographic zones were investigated, and high importance of wild barley was mentioned for agro-morphological traits (Ivandic et al., Reference Ivandic, Hackett, Zhang, Staub, Nevo, Thomas and Forster2000; Shakhatreh et al., Reference Shakhatreh, Haddad, Alrababah, Grando and Ceccarelli2010; Zhao et al., Reference Zhao, Sun, Dai, Zhang and Wu2010) and root-related traits (Barati et al., Reference Barati, Majidi, Mirlohi, Pirnajmodini and Sharif-Moghaddam2015). Although some wild barley species have large distribution in west of Iran, only a few studies are performed on these germplasm. Little information is also available about the response of wild barley species to drought stress and their comparison with HVU and HSP genotypes. Therefore, the objectives of this research were: (1) to assess genetic diversity of morphological traits and response to different water stress environments among and between different species of genus Hordeum; (2) to compare Iranian genotypes with non-native ones in response to drought stress; and (3) to identify wild barley accessions which have favourable characters and could be utilized in genetic studies and breeding programmes to improve yield and stability of the crop under stressed environmental conditions.
Materials and methods
Plant material
Eighty barley genotypes were used in this study (Table 1, online Supplementary Table S1). In order to simplify the study of the germplasm, these genotypes were divided into the following five groups: 5 genotypes belong to HVU group, 11 wild barley genotypes belong to HSP group, 16 genotypes belong to HMA group, 26 genotypes belong to HMU group and finally 22 wild genotypes belong to other species of genus Hordeum (OWBS group). The cultivated genotypes were all originated from Iran. The wild barley genotypes originated from different countries; however, most of them were from Iran. Fifty-three accessions were provided by Leibniz-Institute of Plant Genetics and Crop Plant Research (IPK) gene bank (Germany) and 27 were collected from west of Iran in 2011. The seeds of all genotypes were space-planted in the field and propagated by selfing during March–June 2012.
Table 1. Information on 80 genotypes belonged to 15 wild and 1 cultivated species of genus Hordeum used in this study during 2 years (2012–2013 and 2013–2014); the species of the genotypes are presented below the table

Numbers 1–2, Hordeum arizonicum; numbers 3–4, H. brachyantherum; numbers 5–6, H. bulbosum; number 7, H. capense; numbers 8–9, H. cordobense; numbers 10–11, H. depressum; number 12, H. euclaston; number 13, H. parodii; numbers 14–15, H. patagonicum; number 16, H. procerum; numbers 17–18, H. pusillum; numbers 19–21, H. secalinum; number 22, H. stenostachys; numbers 23–38, H. marainum; numbers 39–64, H. murinum; numbers 65–75, H. vulgare ssp. spontaneum; numbers 76–80, H. vulgare ssp. vulgare.
The other information of the species are presented in the online Supplementary Table S1.
Experimental design and imposed water stress
The experiment was performed in Isfahan University of Technology research farm, 32°30ʹN, 51°20ʹE, Isfahan, Iran. The soil was silty clay loam, based on the soil test, containing 370 g/kg Ca-carbonate equivalent, 5.0 g/kg organic C and 0.75 g/kg total N, with pH 8.3. The soil was non-saline and non-sodic. The electrical conductivity and the sodium adsorption ratio of the soil-saturated extract were 1.6 dS/m and 1.4 (mmol/l) 0.5, respectively. The mean annual temperature and precipitation are 14.5°C and 140 mm, respectively. The experiment had six environments; the non-orthogonal combination of three irrigation treatments, which were named control, mild drought stress (MDS) and intense drought stress (IDS); and 2 years (2012–2013 and 2013–2014). All the genotypes were grown in a three-replicate randomized complete block design for each year and treatment combination. Each plot contained of two 1.5 m rows, with 20 cm between the rows and 2 cm between the plants in each row. The seeds of all 80 genotypes were planted by hand on mid-November in the farm.
From the beginning of the experiment (sowing date) to the start of growing season (when all of the genotypes are completely established; this time was equal to start of stem elongation for most of the genotypes, this happens at the beginning of February at Isfahan) all of the plots, including those from stress conditions and no-stress conditions were irrigated normally. Then the water treatments were applied until harvest (May 20). For the IDS environment, the irrigation was totally stopped at the start of growing season (first February). Control and MDS environment were irrigated when 50 and 80% of the total available water was depleted from the root zone, respectively (Allen et al., Reference Allen, Pereira and Smith1998). Therefore, the irrigation interval (number of days between two irrigations) during the growing season was variable because the evapotranspiration was variable. The irrigation amount was determined according to the following equation:
 $$I = \left[ {({\rm FC} - \theta )/100} \right]D \times B,$$
where I is the irrigation depth (cm), FC is the soil gravimetric moisture per cent at field capacity, θ is the soil gravimetric moisture per cent at irrigating time, D is the root zone depth and B is the soil bulk density at root zone (1.4 g/cm3). The water was applied by using a basin irrigation system, the most common form of surface irrigation in regions with small fields. In this system, each plot is level and encompassed by a dyke (Walker, Reference Walker1989). Water was delivered from a pumping station via pipe and the water volumes applied were measured with a volumetric counter. The depth of irrigation (I g) was calculated according to the following equation:
 $$I_{\rm g} = I \times 100/E_{\rm a}, $$
where I is the irrigation depth and E a is the irrigation efficiency (%) assumed as 75% during the growing season.
Evaluation of barley and wild barley genotypes and statistical analysis
Days to heading (DH, number of days to heading of 50% of the plants in the plot) and days to ripening (DR, days to physiological ripening of the seeds in each plot) were recorded for each plot from the planting date, which are equal to 49 and 93 decimal code according to Zadoks et al. (Reference Zadoks, Chang and Konzak1974), respectively. Plant height (PH), spike length (SPL), number of fertile tillers (TN) and number of seed per plant (NSP) were measured on 10 plants of each plot at the beginning of grain filling stage. The traits PH, SPL and NSP were recorded only on the primary tillers of the plants. After physiological ripening of each plot, 10 plants were removed from 5 cm above ground, dried 48 h at 70°C and total above ground biomass yield (BY) was measured and expressed as the mean of single plant. To prevent seed shattering of the wild genotypes, the plants were harvested after physiological ripening of the first seeds, when most of the seeds were completely filled, but they are still green and the rachis is not broken. Then the grains were separated and the means of grain yield (GY) per plant and hundred kernel weight (HKW) were measured. Finally, harvest index (HI) was calculated for each plot with the formula HI = GY/BY.
The data were entered to Excel software and the descriptive statistics (minimum, maximum and means) were obtained. Then analysis of variance (ANOVA) were performed after normality test using the procedure generalized linear model of SAS (SAS Institute, 2008) to determine difference among years, water environments and genotypes for each trait. Least significant differences test was used for mean comparisons. Multivariate statistical analysis including principal component analysis (PCA) was performed on the standardized data and using correlation matrix. Biplots were prepared using Statgraphics centurion XVI (http://www.statgraphics.com).
Results
The results of ANOVA (online Supplementary Table S2) showed that the difference between 2 years (Y) was significant for all of the traits with the exception of SPL. The differences between three water environments (E) were significant for all of the traits. The interaction between year and water environment (Y × E) was significant only for DR and NSP. Genotype (G) and its interactions with water environment (G × E) were significant for all of the traits. The interaction between genotype and year (G × Y) was significant for NSP, HKW, GY and HI. Interaction between genotype, environment and year (G × E × Y) was significant just for GY. The results of mean comparison between three water environments (Table 2) showed that the means of DH, DR, PH, SPL, HI and HKW were reduced under MDS and IDS compared with control environment. With regard to GY and NSP, means of MDS were higher than other environments and means of control and IDS did not have significant differences. Means of TN under MDS and IDS were highest and lowest, respectively. Total means of BY in MDS were higher than the two other environments; however, for the HVU genotypes separately, control had the highest and IDS had the lowest GY.
Table 2. Mean of five genotypic groups and standard errors within each water environment and mean comparison of three water environments

MDS, mild drought stress; IDS, intense drought stress; DH, days to heading; DR, days to ripening; PH, plant height; TN, number of fertile tiller; SPL, spike length; NSP, number of seed per plant; HKW, hundred kernel weight; GY, grain yield; BY, total above ground biomass yield; HI, harvest index; HSP, Hordeum vulgare ssp. spontaneum; HVU, Hordeum vulgare ssp. vulgare; HMA, Hordeum marainum; HMU, Hordeum murinum; OWBS, other wild barley species; LSD, least significant differences.
Total means of three in environments in each row, followed by similar letter(s), are not significantly different at 5% probability level, using LSD test.
Significant differences were observed between the five groups (HVU, HSP, HMU, HMA and OWBS) for all of the traits with the exception of HI (online Supplementary Table S2). The differences between genotypes within HSP, HMU, HMA and OWBS groups for all of the traits were also significant; however, genotypes within HVU group were significantly different only for DH, DR, GY and HI (online Supplementary Table S2). The comparison between HVU and HMA groups showed significant differences for all of the traits exception of DH. Comparison between HVU and HMU groups showed significant differences for most of the traits but not DR, SPL and HI. The differences between HSP and HMA groups were significant for all of the traits with the exception HI. Differences between HSP and HMU groups were significant for most of the traits with the exception of DR and BY. The comparison between HMA and HMU groups was significantly different for all of the traits.
The ranges of trait for genotypes within each group (online Supplementary Table S3), and the means of genotypes within each group were obtained for each water environment separately (Table 2). The results revealed high variation within each group, as well as between the groups for all traits, especially for yield and yield components. The highest means of DH, NSP, GY, BY and HI were observed for HVU group. HSP group had the highest means of PH, SPL and HKW. HMA group had the highest means of DR and NSP. The lowest means of PH, SPL, HKW and BY were observed for HMA group. HMU group had the lowest means of DH and NSP, and HVU group had the lowest means of DR and TN. The lowest means of HI were observed for HSP.
Based on the results of mean comparisons (results are not shown), genotypes 10 and 11 were identified from H. depressum with extremely low DH. Genotypes 11 and 59 (from HMU) were identified with the lowest DR (the most earliness). genotype 6 from H. bulbosum had the highest values of PH and SPL. Genotypes with highest TN (genotype 36) and HI (genotype 29) were identified within OWBS group, but the highest NSP (genotype 78) and GY (genotype 77) were observed within HVU group. Higher HKW (genotype 67) and BY (genotype 72) were observed within HSP genotypes. Based on the GY of genotypes in three water environments, which are presented in Fig. 1(a) and (b) and online Supplementary Fig. S1, genotypes from the HVU and HSP groups had higher GY under three water environments. The genotypes 76, 77 and 78 were identified with high yield in control condition. Under mild drought stress, genotypes 72, 77, 78 and 80 and under intense drought stress genotypes 72 and 73 had high GY. The genotypes 69, 70, 72, 74, 76, 77, 78, 79 and 80 were revealed with relatively high yield in three environments. With regard to other genotypes belonging to HMU, HMA and OWBS groups, genotypes 26, 29, 37 and 44 had higher GY under control conditions. The genotypes 3, 4, 40, 42, 44, 45 and 47 were identified with higher GY under MDS, and finally under IDS, genotypes 3, 40 and 44 had higher GY. Genotypes 40 and 44 had relatively high GY under the three environments. In the other hand, genotypes 72 and 79 from first group and genotypes 1, 15, 32, 36, 41, 51, 55 and 44 from second group were identified as stable genotypes, which could keep their yield within all environments.
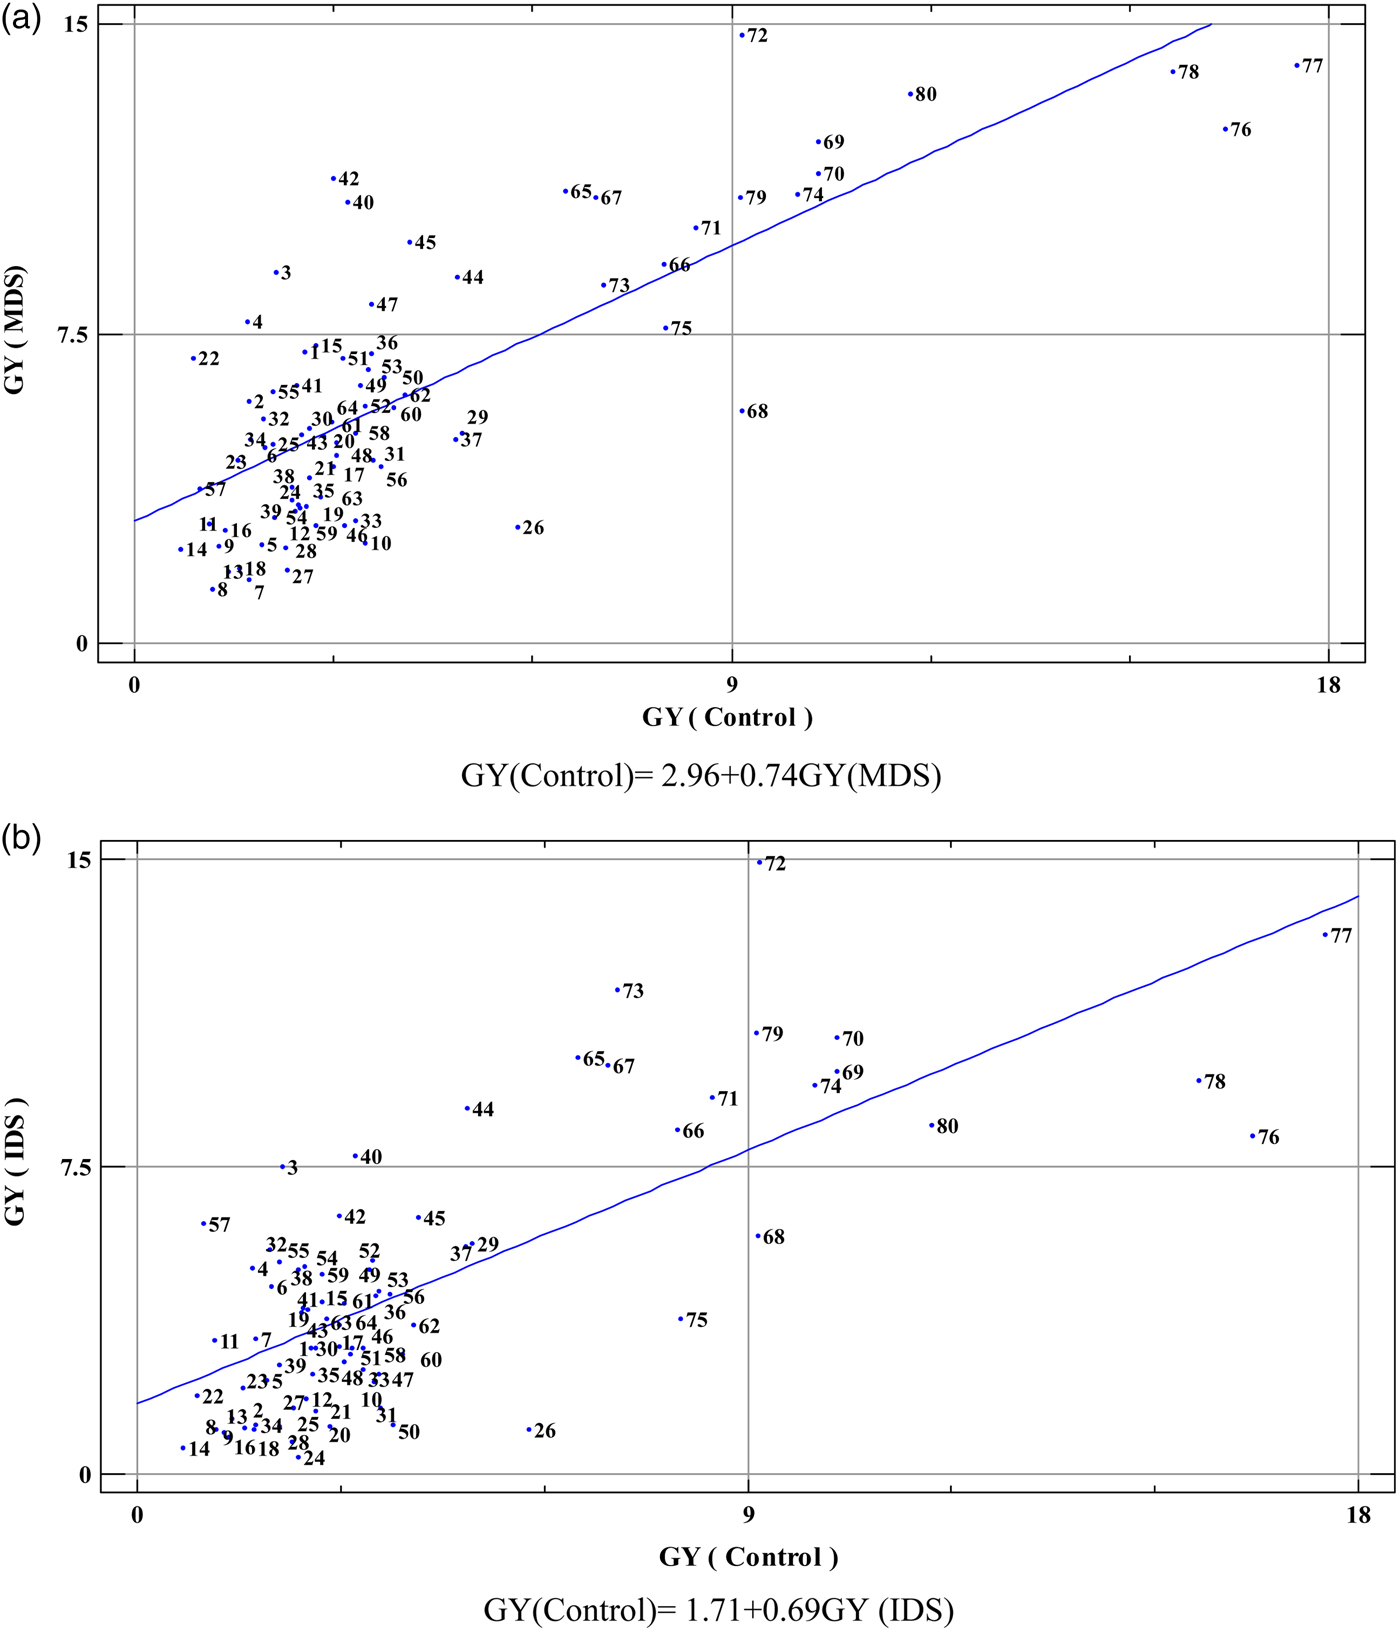
Fig. 1. The biplot of the grain yield (GY) under control to GY under mild drought stress (MDS) (a), the biplot of GY under control to GY under intense drought stress (IDS) (b) and the biplot of GY under MDS to GY under IDS (c). Definition of origin of the genotypes can be seen in Table 1.
PCA was performed on the data of control, MDS and IDS environments separately. Under control environment (online Supplementary Fig. S2), the first two components explained 61.2% of total variation. With regard to MDS (Fig. 2(a)), two first components explained 60.8% of total variation. Under IDS condition (Fig. 2(b)), the first two components explained 63.6% of total variation. The correlation between the traits based on the angles between the vectors of traits in the biplot of PC1 versus PC2 (Fig. 2) indicated that under control environment, the traits GY, NSP, HKW and BY were highly and positively correlated to each other and negatively correlated to TN. Under MDS environment, GY, PH, NSP, SPL, HKW and BY had positive correlation to each other and negative correlation with TN. Under IDS environment, GY had positive correlation with PH, SPL, NSP, HKW, BY and HI and negative correlation with DR and TN. These results were confirmed with the correlations between the traits (results are not shown). Based on the scatter plot of the genotypes within PC1 versus PC2 biplot in control environment (online Supplementary Fig. S2), HVU and HSP genotypes were completely separated from other genotypes. With regard to the results of MDS and IDS, not only HVU and HSP genotypes were completely separated from other genotypes, but also other wild genotypes were slightly separated in three groups [which has been shown with the red lines in Fig. 2(a) and (b), respectively], e.g. the group, which mostly consists HMA genotypes (low PC1 and moderate PC2 under MDS, high PC1 and moderate PC2 under IDS), the group with most of HMU genotypes together with some genotypes from other wild species (moderate PC1 and low PC2 under MDS, moderate PC1 and high PC2 under IDS), and finally, the group mostly from the OWBS group (moderate PC1 and PC2 for both MDS and IDS).

Fig. 2. Biplot of PC1 versus PC2, under control (a), mild drought stress (MDS) (b) and intense drought stress (IDS) (c) obtained from principal component analysis. The means of 2 years for each environment have been used. DH, days to heading; DR, days to ripening; PH, plant height; TN, number of fertile tiller; SPL, spike length; NSP, number of seed per plant; HKW, hundred kernel weight; GY, grain yield; BY, total above ground biomass yield; HI, harvest index. Definition of origin of the genotypes can be seen in Table 1.
Discussion
Previous studies of genetic diversity on the HVU and HSP have shown that moisture environments influence morphological traits, yield and yield components (Ivandic et al., Reference Ivandic, Hackett, Zhang, Staub, Nevo, Thomas and Forster2000; El Madidi et al., Reference El Madidi, Diani and Aameur2005). In this experiment, the effect of moisture environments also was significant on all of the measured traits; however, genotypes responded differently to moisture environments. In previous studies, drought stress (mild and intense) reduced the mean for most of the traits (DH, DR, PH, SPL, HKW and HI) (Volis et al., Reference Volis, Mendlinger, Olsvig-Whittaker, Safriel and Orlovsky1998; Yazdchi, Reference Yazdchi2008; Lakew et al., Reference Lakew, Eglinton, Henry, Baum, Grando and Ceccarelli2011). In regard to the most important trait, GY, higher GY was obtained under MDS; however, the GY of the cultivated genotypes (HVU group) was higher under control conditions. The higher GY of the wild barley genotypes under mild stress maybe because of the higher TN and number of seeds per plant under this condition. The lower GY of wild barley genotypes under no stress condition maybe because of higher vegetative growth and following lodging, which is influenced by morphological plant traits (inadequate standing power of the plant) as well as environmental conditions (such as rain, wind and/or hail) (Berry et al., Reference Berry, Sterling, Spink, Baker, Sylvester-Bradley, Mooney, Tams, Ennos and Sparks2004). Yield losses are greatest when a crop lodges during the 10 d following head emergence, which is equal to the windy weather in Isfahan during March–April. This maybe the main reason of higher numbers of fertile tillers and seeds per plant in mild drought stress. Therefore, seed yield, the most economically important trait in barley production, should be increased through an improvement in the efficiency of the reproductive system, where efficiency can be defined as the percentage of florets which produce seeds and the size to which these seeds develop, rather than as an increase in the size of the reproductive system (Bean, Reference Bean1972).
Systematic approaches to increase the level of abiotic stress tolerance require the evaluation of genetic variability in the barley gene pool, both within and among different populations and species (Ivandic et al., Reference Ivandic, Hackett, Zhang, Staub, Nevo, Thomas and Forster2000). In this study, large variation for water stress tolerance was found between HVU, HSP, HMU, HMA and OWBS groups of genotypes of genus Hordeum. Rich genetic variation was observed within all of these five groups. Genetic variation between wild accessions from species which are crossable with cultivated barley (HSP) highly guarantees the successful improvement of current barley cultivars from crossing with wild populations (Baum et al., Reference Baum, Grando, Backes, Jahoor, Sabbagh and Ceccarelli2003). However, identifying the superior genotypes of wild accessions which are not easily crossable with cultivated barley will be also important for genetic studies and characterization of the genes influencing the traits, which could be introgressed to the cultivated species through biotechnology approaches. Among the wild genotypes, some valuable genotypes were identified with lower DH (genotypes 11 and 59), earliness (genotype 58), longer SPL (genotypes 5 and 6), higher TN (genotype 36) and higher HI (genotype 29), which may contain useful genes for genetic improvement of barley. Most of these genotypes have been originated from Iran, which has been neglected in breeding programmes. In a recent study, importance of Iranian germplasm of HVU and HSP has also been reported for root-related traits (Barati et al., Reference Barati, Majidi, Mirlohi, Pirnajmodini and Sharif-Moghaddam2015).
Because of extensive variability, usually the fields in the target stress environments are inappropriate for selection work. The water shortage can be too severe in one year, causing complete loss of plant materials or too favourable to establish any stress pressure in another year. Water shortage in different seasons may also occur at different plant growth stages causing reduced efficiency in the breeding programme (Blum, Reference Blum2011). This is usually resolved to some extent by examining plant materials under different controlled water stress environments which gives a much better understanding of genotype by environment interactions, which is one of the most important factors to select the genotypes with higher levels of field drought tolerance. In this study, interaction of genotype by water environment was highly significant for all of the traits, especially GY. However, some of the genotypes such as 69, 70, 72, 74, 76, 77, 78, 79 and 80 from HVU and HSP groups and genotypes 40 and 44 from other groups had relatively high GY in all three moisture environments. Most of the wild barley genotypes had low GY in the three moisture environments, but in mild and intensive drought stress, some of them had relatively high GY (such as genotypes 3, 40 and 44). On the other hand, the genotypes that can keep their performance under stressed environments are preferred for some breeding purposes. In this study, genotype 72 from HSP and genotypes 1, 15, 32, 36, 41, 51, 55 and 44 of wild barley, which are mostly from HMU and HMA species, had more GY stability (GY under stressed to GY under control conditions), indicating the importance of using these wild genotypes in breeding barley for drought stress tolerance, similar to previous studies on salt tolerance (Mano and Takeda, Reference Mano and Takeda1998).
Groupings of genotypes using statistical methods such as PCA can provide an informal means for assessing dimensionality, identifying outliers and suggesting interesting hypotheses concerning relationships (Johnson and Wichern, Reference Johnson and Wichern2007). The biplots obtained from the PCA also provide a good picture of the relationships between variables. In this study for all three environments, GY was positively correlated with NSP and HKW and negatively correlated with TN, meaning that the high-yielding genotypes had higher NSP and HKW and lower TN. Negative correlation between TN with HKW, NSP and SPL indicates that under drought stress, lower TN is preferred, because the secondary tillers get damaged in heat leading to a lack of food supply at the end of plant development, resulting in waste of plant energy. Positive correlation between GYs with BY in this study may indicate that with increasing biomass (or vegetative organs), photosynthesis intensifies and as a result the GY will increase. In this study, GY had negative correlation with DR under drought stress condition, which indicates the higher yield in long-lived genotypes. However, when the correlation coefficients were calculated based on the data from control and MDS environments, the correlation between GY with DR was not high. Interestingly, under IDS environment, GY had negative correlation with DR. This indicates that drought escape via a short life cycle is one of the most important mechanisms of drought resistance, especially in the wild genotypes, which have been adapted to drought environments. This maybe because early maturing plants are less exposed to drought stress during grain filling (Van Oosterom and Acevedo, Reference Van Oosterom and Acevedo1992; Shakhatreh et al., Reference Shakhatreh, Kafawin, Ceccarelli and Saoub2001). Similar results were observed for wild genotypes of other crops (Hamdi and Erskine, Reference Hamdi and Erskine1996).
In this study, the results of PCA completely separated HVU–HSP from wild barley genotypes; however, other genotypes belonging to different wild species did not completely separate. The first PC in three environments was correlated with the yield and yield components, having a major role in separating cultivated and wild genotypes from each other. The second PC was correlated with DH, DR and HI. In addition, the Iranian and foreign genotypes did not completely separate from each other, because of high genetic diversity within both groups. The results of PCA also revealed that the best performing genotypes in term of highest GY, HKW, NSP and BY were from HVU–HSP group.
In conclusion, the results showed high level of variability for all of the morphological traits considered in this study. HVU genotypes had higher GY followed by HSP genotypes. The genotypes belong to wild barley species, especially those from HMU and HMA had lower GY, but relatively higher yield stability under different environments. The wild barley genotypes with favourable characters and high drought tolerance were identified. These genotypes can be used in future genetic studies and improvement of the barley crop, especially for drought stress. The sterility barriers between some wild Hordeum species and cultivated barley, which limits direct introduction of these valuable characters, may be overcome by gene transfer using recombinant DNA techniques.
Supplementary material
The view supplementary material for this article, please visit https://doi.org/10.1017/S1479262117000168.


