


I. INTRODUCTION
Mupirocin (trade name Bactroban) is an antibiotic of the monoxycarbolic acid class, used as a topical treatment for bacterial skin infections. Pseudomonic acid produced by Pseudomonas fluorescens was reported in 1971 (Fuller et al., Reference Fuller, Mellows, Woolford, Banks, Barrow and Chain1971). Subsequent investigations revealed the pseudomonic acid is a mixture of compounds with similar structures; these compounds were named as pseudomonic acids A, B, C, and D. The term mupirocin was adopted as the approved name for the main phase pseudomonic acid A (Sutherland et al., Reference Sutherland, Boon, Griffin, Masters, Slocombe and White1985). Three crystalline polymorphs of mupirocin are reported in U.S. Patent 5,594,026 (Greenway et al., Reference Greenway, Salt, Valder and Curzons1997). The systematic name (CAS Registry number 12650-69-0) is 9-[(E)-4-[(2S,3R,4R,5S)-3,4-dihydroxy-5-[[(2S,3S)-3-hydroxybutan-2-yl]oxiran-2-yl]methyl]oxan-2-yl]-3-methylbut-2-enoyl]oxynonanoic acid. A two-dimensional molecular diagram is shown in Figure 1.

Figure 1. The molecular structure of mupirocin.
The presence of high-quality reference powder patterns in the Powder Diffraction File (PDF; ICDD, 2014) is important for phase identification, particularly by pharmaceutical, forensic, and law enforcement scientists. The crystal structures of a significant fraction of the largest dollar volume pharmaceuticals have not been published, and thus calculated powder patterns are not present in the PDF-4 databases. Sometimes experimental patterns are reported, but they are generally of low quality. This structure is a result of collaboration among ICDD, Illinois Institute of Technology (IIT), Poly Crystallography Inc., and Argonne National Laboratory to measure high-quality synchrotron powder patterns of commercial pharmaceutical ingredients, include these reference patterns in the PDF, and determine the crystal structures of these active pharmaceutical ingredients (APIs).
Even when the crystal structure of an API is reported, the single-crystal structure was often determined at low temperature. Most powder measurements are performed at ambient conditions. Thermal expansion (often anisotropic) means that the peak positions calculated from a low-temperature single-crystal structure often differ significantly from those measured at ambient conditions. These peak shifts can result in failure of default search/match algorithms to identify a phase, even when it is present in the sample. High-quality reference patterns measured at ambient conditions are thus critical for easy identification of APIs using standard powder diffraction practices.
II. EXPERIMENTAL
Mupirocin was a commercial reagent, purchased from the United States Pharmacopeia (Lot G0M003), and was used as-received. The white powder was packed into a 1.5 mm diameter Kapton capillary, and rotated during the measurement at ~50 cycles s−1. The powder pattern was measured at 295 K at beam line 11-BM (Lee et al., Reference Lee, Shu, Ramanathan, Preissner, Wang, Beno, Von Dreele, Ribaud, Kurtz, Antao, Jiao and Toby2008; Wang et al., Reference Wang, Toby, Lee, Ribaud, Antao, Kurtz, Ramanathan, Von Dreele and Beno2008) of the Advanced Photon Source at Argonne National Laboratory using a wavelength of 0.413 685 Å from 0.5° to 50°2θ with a step size of 0.001° and a counting time of 0.1 s step−1. The pattern was indexed on a primitive monoclinic unit cell having a = 12.5659, b = 5.1036, c = 21.7147 Å, β = 100.913°, V = 1367.42 Å3, and Z = 2 using DICVOL06 (Louër and Boultif, Reference Louër and Boultif2007). Even given the presence of impurity phases, one unit cell was much better than the others [M/F(28) = 45.9/690.5], so it was selected and confirmed by the solution and refinement of the structure. An analysis of systematic absences using EXPO2013 (Altomare et al., Reference Altomare, Cuocci, Giacovazzo, Moliterni, Rizzi, Corriero and Falcicchio2013) suggested that the space group was P21 (#4), which was confirmed by successful solution and refinement of the structure. A reduced cell search in the Cambridge Structural Database (Allen, Reference Allen2002) yielded no hits.
A mupirocin molecule was built and its conformation optimized using Spartan ‘14 (Wavefunction, 2013), and saved as a mol2 file. This molecule (using the 1°–20° portion of the pattern) was used to solve the structure with DASH 3.3.2 (David et al., Reference David, Shankland, van de Streek, Pidcock, Motherwell and Cole2006). One of the 25 solutions was much better than the others. After preliminary refinement suggested that the conformation of the ring portion of the molecule was not correct, it was extracted from the crystal structure, re-optimized using Spartan ‘14, and saved as a new .mol2 file. Another structure solution using DASH yielded one solution which was much better than the other 24 and which was used for refinement. Ultimately, the result of the density functional theory (DFT) optimization was used as the starting model for the final refinement.
Rietveld refinement was carried out using GSAS (Larson and Von Dreele, Reference Larson and Von Dreele2004). Only the 1.5°–20.0° portion of the pattern was included in the refinement (d min = 1.19 Å). Although there were a few, very weak peaks at higher angles, the background between 20° and 25°2θ contained a feature which was difficult to fit. Adding more terms to either the diffuse scattering or shifted Chebyshev functions caused the background to start to follow the Bragg peaks, resulting in distortion of the structure. Since the purpose of the Rietveld refinement was to provide a starting model for the DFT calculation, we judged that it was better to neglect a small number of weak peaks to obtain a more chemically reasonable structural model. All non-H bond distances and angles were subjected to restraints, based on a Mercury/Mogul Geometry Check (Bruno et al., Reference Bruno, Cole, Kessler, Luo, Motherwell, Purkis, Smith, Taylor, Cooper, Harris and Orpen2004; Sykes et al., Reference Sykes, McCabe, Allen, Battle, Bruno and Wood2011) of the molecule. The Mogul average and standard deviation for each quantity were used as the restraint parameters. The restraints contributed 11.0% to the final χ 2. Isotropic displacement coefficients were refined and grouped by chemical similarity. The hydrogen atoms were included in calculated positions, which were recalculated during the refinement. The U iso of each hydrogen atom was constrained to be 1.3× that of the heavy atom to which it is attached. The peak profiles were described using profile function #4 (Thompson et al., Reference Thompson, Cox and Hastings1987; Finger et al., Reference Finger, Cox and Jephcoat1994), which includes the Stephens (Reference Stephens1999) anisotropic strain broadening model. The background was modeled using a three-term shifted Chebyshev polynomial, with a five-term diffuse scattering function to model the Kapton capillary and any amorphous component. The final refinement of 121 variables using 18 585 observations (18 501 data points and 84 restraints) yielded the residuals R wp = 0.1152, R p = 0.0844, and χ 2 = 4.884. A Le Bail fit yielded residuals R wp = 0.0788, R p = 0.0648, and χ 2 = 2.986. The largest peak (1.80 Å from C31) and hole (2.08 Å from C29) in the difference Fourier map were 0.52 and −0.50 e(Å−3), respectively. The Rietveld plot is included as Figure 2. The largest errors are peaks unaccounted for by this structure, and indicate the presence of a minor amount of an unidentified impurity.

Figure 2. (Color online) The Rietveld plot for the refinement of mupirocin Form I. The red crosses represent the observed data points, and the green line is the calculated pattern. The magenta curve is the difference pattern, plotted at the same vertical scale as the other patterns. The vertical scale has been multiplied by a factor of 5 for 2θ > 7.0° and by a factor of 20 for 2θ > 17.0°.
A density functional geometry optimization (fixed experimental unit cell) was carried out using CRYSTAL09 (Dovesi et al., Reference Dovesi, Orlando, Civalleri, Roetti, Saunders and Zicovich-Wilson2005). The basis sets for the H, C, and O atoms were those of Gatti et al. (Reference Gatti, Saunders and Roetti1994). The calculation used eight k-points and the B3LYP functional, and took ~17 days on a 3.0 GHz PC.
III. RESULTS AND DISCUSSION
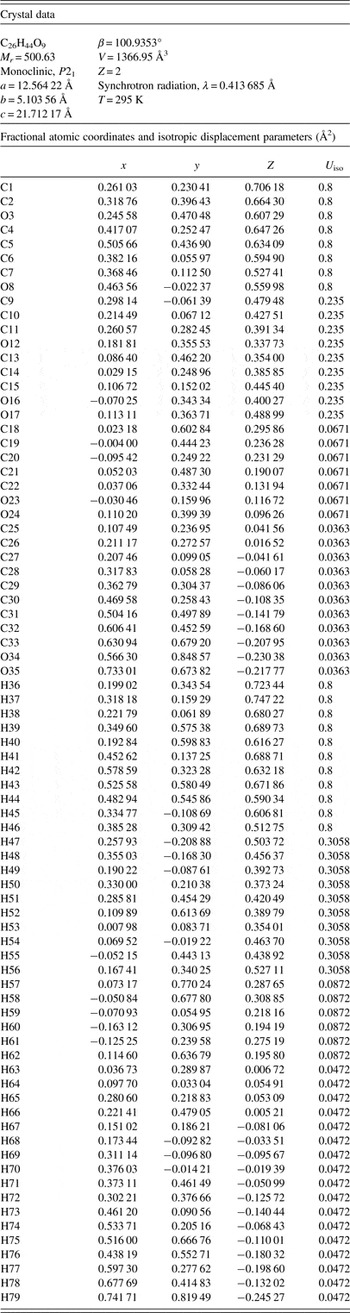
The powder pattern corresponds to that of Form I of mupirocin, as described by Greenway et al. (Reference Greenway, Salt, Valder and Curzons1997), so the crystal structure reported here is that of Form I. The refined atom coordinates of mupirocin Form I are reported in Table I, and the coordinates from the DFT optimization in Table II. The U iso of the atoms at the C1–O8 end of the molecule refined to very large values, and were fixed at 0.80 Å2. This molecule is pseudomonic acid A, which normally constitutes >90% of mupirocin; pseudomonic acids B and C are different in this end of the molecule, and these differences in co-crystallized impurities may explain the large displacement coefficients. The difference Fourier maps provided no indication of another conformation, and eliminating these atoms from the model did not result in their appearance in a difference Fourier map. Because the DFT calculation needs an ordered model, we choose to accept the very large displacement coefficients.
Table I. Rietveld refined crystal structure of mupirocin Form I.

Table II. DFT-optimized (CRYSTAL09) crystal structure of mupirocin Form I.
The root-mean-square deviation of the non-H atoms in the refined and optimized structures is 1.02 Å (Figure 3), suggesting that there are problems with the experimental structure (van de Streek and Neumann, Reference van de Streek and Neumann2014). The most notable differences are in the conformation of the nonyl chain and the interchange of the methyl group C1 and the hydroxyl group O16. There is a too-close intermolecular C1–O16 contact in the refined structure. We believe that the DFT structure is correct, as it results in a more reasonable geometry and hydrogen-bonding pattern. The discussion of the geometry uses the DFT-optimized structure. The asymmetric unit (with atom numbering) is illustrated in Figure 4, and the crystal structure is presented in Figure 5.

Figure 3. (Color online) Comparison of the refined and optimized structures of mupirocin. The Rietveld refined structure is colored red, and the DFT-optimized structure is blue.

Figure 4. (Color online) The molecular structure of mupirocin, with the atom numbering. The atoms are represented by 50% probability spheroids.

Figure 5. (Color online) The crystal structure of mupirocin Form I, viewed down the b-axis. The hydrogen bonds are shown as dashed lines.
All of the bond distances fall within the normal ranges indicated by a Mercury Mogul Geometry Check (Macrae et al., Reference Macrae, Bruno, Chisholm, Edington, McCabe, Pidcock, Rodriguez-Monge, Taylor, van de Streek and Wood2008). Only the C18–C13–C14 angle of 119.1° falls outside the normal range of 113(1)° (Z-score = 6.89). The C5–C4–C2–C1 torsion angle is flagged as unusual, but it lies in the tail of the normal distribution. The C5–C4–C6–C7 torsion lies within a very broad distribution, and the O8–C6–C4–C5 torsion lies in the tail of the normal trans/±gauche distribution. Only the O3–C2–C4–C5 torsion seems to be truly unusual (Figure 6).

Figure 6. (Color online) The O3–C2–C4–C5 torsion angle compared to the distribution of similar torsions in the CSD. Although the value of 84.4° is closer to a gauche conformation, it is unusual.
A quantum mechanical conformational examination (DFT/B3LYP functional/6-31G* basis set/water) using Spartan ‘14 indicated that the observed conformation is ~6 kcal mole−1 higher in energy than a local minimum. A molecular mechanics (MMFF) sampling of conformational space indicated that the observed solid-state conformation is 48.4 kcal mole−1 higher in energy than the minimum energy conformation, which has the carboxylic acid end of the nonyl chain curled back toward the rest of the molecule. The energy difference indicates that van der Waals forces contribute significantly to the crystal energy.
An analysis of the contributions to the total crystal energy using the Forcite module of Materials Studio (Accelrys, 2013) suggests that the crystal energy is dominated by angle deformation contributions. The intermolecular energy appears to be dominated by van der Waals and electrostatic contributions, which in this force-field-based analysis include hydrogen bonds. The hydrogen bonds are better analyzed using the results of the DFT calculation.
As expected, the three hydroxyl groups O17–H56, O16–H55, and O3–H40, as well as the carboxylic acid hydrogen H79, participate in hydrogen bonds (Table III). The hydroxyl group O17–H56 makes an intramolecular hydrogen bond to the hydroxyl oxygen O3, with a graph set S1,1(10) (Etter, Reference Etter1990; Bernstein et al., Reference Bernstein, Davis, Shimoni and Chang1995; Shields et al., Reference Shields, Raithby, Allen and Motherwell2000). This hydrogen bond is fairly strong (Rammohan and Kaduk, 2015, unpublished results). The hydroxyl group O16–H55 makes a weaker intramolecular hydrogen bond to O17, with graph set S1,1(5). The hydroxyl group O3–H40 makes a hydrogen bond to hydroxyl oxygen O16, with graph set C1,1(11). The result is a helical hydrogen bond chain parallel to the b-axis. The carboxylic acid makes a fairly weak hydrogen bond to the ether oxygen O12. An additional weak intermolecular C–H⋯O hydrogen bond also contributes to the crystal packing. The resulting hydrogen bond network is three-dimensional.
Table III. Hydrogen bonds in the DFT-optimized structure of mupirocin Form I.

The volume of the Hirshfeld surface (Figure 7; Hirshfeld, Reference Hirshfeld1977; McKinnon et al., Reference McKinnon, Spackman and Mitchell2004; Spackman and Jayatilaka, Reference Spackman and Jayatilaka2009; Wolff et al., Reference Wolff, Grimwood, McKinnon, Turner, Jayatilaka and Spackman2012) is 672.78 Å3, 98.44% of half the unit-cell volume. The molecules are thus not tightly packed. The only significant close contacts (red in Figure 7) involve the hydrogen bonds.

Figure 7. (Color online) The Hirshfeld surface of mupirocin. Intermolecular contacts longer than the sums of the van der Waals radii are colored blue, and contacts shorter than the sums of the radii are colored red. Contacts equal to the sums of the radii are white.
The Bravais–Friedel–Donnay–Harker (Bravais, Reference Bravais1866; Friedel, Reference Friedel1907; Donnay and Harker, Reference Donnay and Harker1937) morphology suggests that we might expect a needle-like morphology for mupirocin Form I, with 〈010〉 as the long axis. A tenth-order spherical harmonic preferred orientation model was included in the refinement; the texture index was 1.214, indicating that preferred orientation was significant in this rotated capillary specimen.
The powder pattern of mupirocin Form I has been submitted to ICDD for inclusion in the PDF. The pattern was based on a Le Bail fit to the pattern, so it is independent of any imperfection in the structural model.
SUPPLEMENTARY MATERIAL
To view supplementary material for this article, please visit http://dx.doi.org/10.1017/S088571561600004X
ACKNOWLEDGEMENTS
The use of the Advanced Photon Source at Argonne National Laboratory was supported by the U. S. Department of Energy, Office of Science, Office of Basic Energy Sciences, under Contract No. DE-AC02-06CH11357. This work was partially supported by the International Centre for Diffraction Data. We thank Lynn Ribaud for his assistance in data collection.


