INTRODUCTION
The extent of mountain glacier fluctuations may be affected by climate change and local topographic variations (Yi et al., Reference Yi, Chen, Yang, Liu, Fu, Liu and Li2008; Davis et al., Reference Davis, Menounos and Osborn2009; Seong et al., Reference Seong, Owen, Yi and Finkel2009; Zhao et al., Reference Zhao, Song, King, Liu, Wang and Wu2010; Xu et al., Reference Xu, Ou, Lai, Zhou, Wang and Fu2010). To understand the relationship between glacial change and climate, it is essential to understand the temporal and spatial variability of glaciers in the past. Determining the ages of moraines helps to refine chronologies of glacier fluctuations at key sites and to identify key factors that force the glacial fluctuations. Recently, cosmogenic nuclide exposure dating has been widely used to constrain glacial chronologies in China (Li et al., Reference Li, Liu, Chen, Li, Harbor, Stroeven, Caffee, Zhang, Li and Cui2014; Dong et al., Reference Dong, Huang, Yi, Liu, Zhou and Caffee2016; Liu et al., Reference Liu, Yi, Li, Bi, Zhang and Hu2017), allowing for the comparison between the timing of glacial advance and climatic change (Zhou et al., Reference Zhou, Wang, Xu, Wang, Colgan and Mickelson2010; Xu et al., Reference Xu, Hu and Qiao2013; Li et al., Reference Li, Li, Harbor, Liu, Yi and Caffee2016; Zhang et al., Reference Zhang, Chen, Li and Liu2016a).
This study is focused on Mount Xuebaoding, an area containing distinctive glacial landforms, which have been studied since the 1980s (Luo, Reference Luo1983; Li et al., Reference Li, Wang and Chen1989; Zheng et al., Reference Zheng, Li and Wang1995). Previous studies divided the glacial sequences of this area into four glacial stages based on local names and/or occurrence times (oldest to youngest): the Xuebaoding stage (the penultimate glaciation); the Huanglongsi stage (the last glaciation); the Xuebaoding Neoglaciation; and the Little Ice Age. Shi et al. (Reference Shi, Cui and Su2006) also published a map of the glacial landforms in this area. Cao and Guo (Reference Cao and Guo2001) used the electron spin resonance method to date glacial tills to 406, 181, 123, and 86 ka in the Sancha and Taojin valleys, but no specific details of the sampling locations nor dating procedures were provided. In this study, we aimed to use 10Be surface exposure dating of moraines to determine the glacial chronology in this area and facilitate a comparison with ages from other regions on the eastern Tibetan Plateau (TP). We focused on two research questions: first, what is the chronology of glacial advances on Mount Xuebaoding; and, second, what mechanisms drove the glacial fluctuations?
REGIONAL SETTING
Mount Xuebaoding, with an altitude of 5588 m above sea level (asl), is the main peak of Min Shan on the eastern margins of the TP (Fig. 1). Five contemporary hanging glaciers are distributed around this peak between 4764 and 5398 m asl, with an area of ~0.84 km2 (Guo et al., Reference Guo, Xu, Liu, Shangguan, Wu, Yao, Zhao, Liu, Jiang and Li2014). The lithology of this area is mainly composed of limestone, slate, and sandstone. Three faults control the tectonic movement of this area. Two north-south trending strike-slip thrust faults (the Minjiang and Huya faults) pass along the eastern and western sides of the mountain respectively. Another east-west trending normal fault (the Xueshan Fault) is on the north of the massif (Yang et al., Reference Yang, Deng, Wang and Wen1979; Qian et al., Reference Qian, Ma and Gong1995). These three faults are believed to form the Xuebaoding massif.

Figure 1 (color online) Digital elevation model (DEM) map of the eastern Tibetan Plateau (TP), showing the location of the Mount Xuebaoding massif and of other mountain ranges in the region which have yielded 10Be ages.
The nearest meteorological station is the Songpan Station (32.39°N, 103.34°E, 2850 m asl). Records from 1951 to 2007 show that the mean annual temperature and mean annual precipitation were 5.9°C and 718 mm, respectively, and the mean summer temperature reached 13.7°C at this station. This area is located in the climate transition zone between the Indian and East Asian monsoons (Wang et al., Reference Wang, Clemens and Liu2003) and receives the precipitation from both systems. About 90% of the precipitation falls between April and October (http://data.cma.cn/site/index.html [accessed November 2017]) and falls as snow at high altitudes, leading to a positive glacial mass balance.
Sample sites
We investigated glacial landforms in the Yanjin, Sancha, Rijiu and Nami Valleys. Several sets of moraines were observed within each valley (Figs 2 and 3). No geomorphic evidence suggests that ice advanced beyond the valleys. We sampled nine boulders in the Yanjin Valley, ten boulders in the Sancha Valley and four boulders in the Rijiu Valley for 10Be surface exposure dating (Table 1 and Supplementary Table 1).
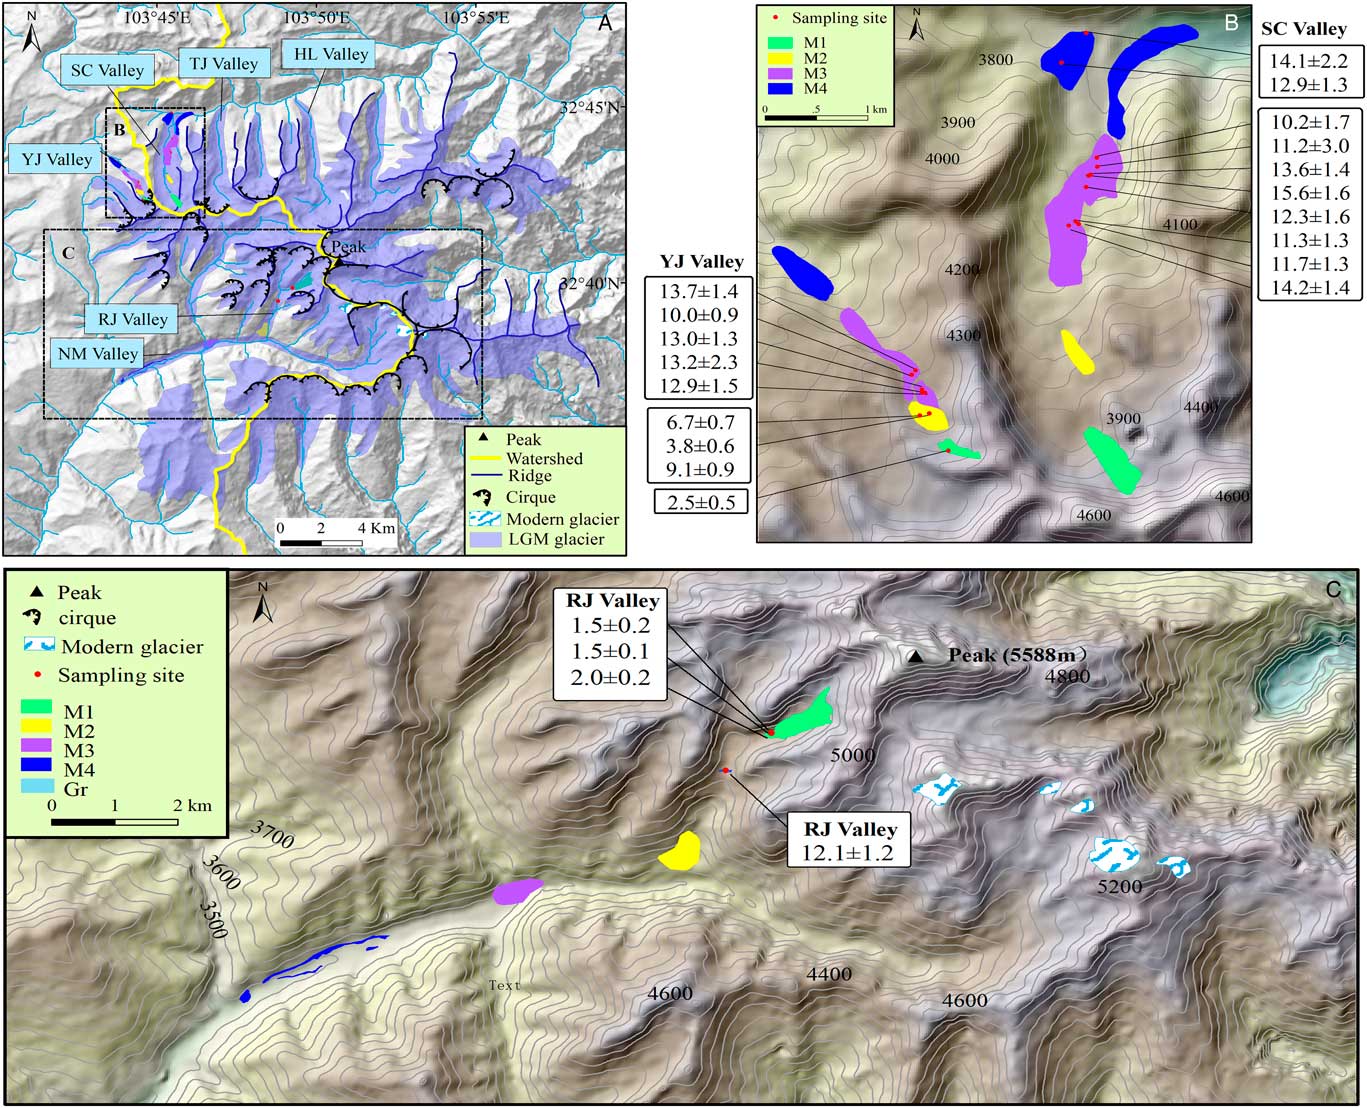
Figure 2 (color online) (A) Digital elevation model (DEM) map of glacier distribution on the Mount Xuebaoding massif as modified by Shi et al. (Reference Shi, Cui and Su2006). YJ Valley, Yanjin Valley; SC Valley, Sancha Valley; TJ Valley, Taojin Valley; HL Valley, Huanglong Valley; RJ Valley, Rijiu Valley; and NM Valley, Nami Valley. (B) DEM showing the glacial landforms and sampling sites yielding 10Be data in the Yanjin and Sancha valleys shown in (A). (C) DEM illustrating the glacial landforms and sampling sites recording 10Be data in the Rijiu and Nami valleys shown in (A). All ages are in Ka.

Figure 3 Representative photographs taken in the field. (A) Pyramidal main peak. (B) M1 in the Rijiu Valley (green dashed line showing its extent). (C) Sampled erratic boulders XBDS-05/06/07 on M1 in the Rijiu Valley. (D) Glacially striated boulder in Nami Valley. (E) M2 in the Sancha Valley. (F) M2 in the Yanjin Valley and sampled boulder XBDN-25 on M3 in the same valley. (G) View of the lateral moraine (M4) in the Sancha Valley from upstream (the oldest moraine found). (H) M4 in the Nami Valley, contemporary with M4 in the Yanjin Valley. (I) Rock step (Gr) in the Rijiu Valley, indicating a rapid glacial retreat. (For interpretations of the references to color in this figure legend, the reader is referred to the web version of this article.)
Table 1 Sampling numbers, locations, 10Be concentration, and related parameters and 10Be ages for all samples from Xuebaoding.

The Yanjin Valley is ~4 km long. We identified four major sets of moraines, named from M1 to M4 from the youngest to the oldest. The youngest set of moraines (M1) extends 0.25 km from the valley head to ~4285 m asl. The surface contains meter-sized angular to sub-angular boulders with no significant evidence of weathering. We sampled one boulder from M1. The next set of moraines, M2, is distributed between 4260 and 4210 m asl, about 0.95 km down-valley, and is composed of multiple moraines. We collected three samples from M2: two from boulders and one from quartz pebbles. Frost weathering has broken quartz veins, resulting in quartz pebbles scattered on the ground. The M3 set of moraines is symmetrically distributed downstream from M2, and dissected by fluvial erosion. It extends for ~2.2 km down-valley between 4215and 3950 m asl. We collected five samples from M3. The outermost moraine set, M4, extends ~3.2 km downstream from 3920 to 3780 m asl. It is covered by shrubby vegetation.
The Sancha Valley is ~5 km long and is characterized by extensive and uneven moraines. Based on the relative geomorphic position and the distribution of glacial boulders, we grouped them into four sets comparable with those observed in the Yanjin Valley. We sampled two of the four sets of moraines: M3 and M4. The M1 set of moraines is distributed at 4,300–4,200 m asl; these moraines are characterized by a distinctive rock glacier on their side walls. The M2 set of moraines extends for 2.2 km from the valley head. The M3 set of moraines extends for ~4.2 km from the valley head, with a height of ~20 m above the valley floor. The moraine surfaces are flat and covered with abundant meter-sized boulders. Many boulders have slightly weathered pits. We collected eight samples from M3. An outermost lateral and terminal set of moraines (M4) is preserved at the mountain front from 3720 to 3600 m asl. The moraines exhibit more rounded ridges and are comprised of massive matrix-supported till. They frequently contain heavily pitted and weathered boulders >4 m in diameter, with detritus of weathering evident within each moraine. This set of moraines probably underwent some denudation. We collected two samples from M4.
We identified two groups of moraines in the Rijiu Valley, and two in the Nami Valley, and named them M1, M2, M3 and M4 based on their altitudes, from the highest/youngest (M1) to the lowest/oldest (M4). The Rijiu Valley is a typical U-shaped tributary valley hanging above the main valley. The M1 set of moraines is the youngest in this valley, ranging from 4575 to 4330 m asl. It is defined by a clear glacier tongue covered by seasonal snow, and includes an end moraine with fresh and sharp-crested ridges. The frontal slope of this moraine exhibits a steep gradient of >30º. We sampled three boulders from this moraine for 10Be exposure dating. The moraine set M2 is located from 3900 to 3660 m asl. A rock step (Fig. 2; Gr) exists between M1 and M2 at 4247 m asl. A few glacial boulders lie atop Gr. We collected one sample from the rock step. The moraine set M3 is located at ~3430 m asl, where a tributary valley enters the main (Nami) valley from its northern side. The moraine set M4 consists of two lateral moraines and one end moraine covered with glacially striated boulders. The two lateral moraines are distributed on the two sides of the river between 3340 and 3270 m asl. The end moraine is cut through by the river.
METHODS
Fieldwork and sampling
We conducted geomorphic mapping based on the interpretation of 1:50,000 topographic maps, Google Earth imagery, and a 30-m ASTER Global Digital Elevation Model (GDEM; http://www.gscloud.cn). The moraine samples were chosen from the flat top surface of large (>1 m) and stable boulders embedded in moraine ridges. Lithologies sampled were generally metamorphic rocks with quartz veins. In total, 23 samples were collected in 2013. We used a handheld GPS unit to determine the latitude, longitude and altitude of the sampled boulders and recorded their lithology and moraine set. We then chiselled off a layer of rock fragments <3 cm thick from the flat surface. We also took photographs of each sample site.
Laboratory methods
Nineteen samples collected from the northern slopes of Mount Xuebaoding were prepared in the Key Laboratory of Tibetan Environment Changes and Land Surface Processes, Institute of Tibetan Plateau Research, Chinese Academy of Sciences. Four samples collected from the southern slopes of the massif were processed at the Institute of Crustal Dynamics, China Seismological Bureau. The physical and chemical analyses follow the modified procedure of Nishiizumi et al. (Reference Nishiizumi, Elmore, Ma and Arnold1984), Kohl and Nishiizumi (Reference Kohl and Nishiizumi1992), and Dortch et al. (Reference Dortch, Owen, Haneberg, Caffee, Dietsch and Kamp2009). The samples were crushed and sieved and the 125–250 μm fraction was used to separate purified quartz. Magnetic separation was used to remove magnetic minerals and then the sample was dissolved in a mixture of concentrated HNO3 and HCL to eliminate carbonate and organic materials. The sample was repeatedly etched in a dilute solution of HF to dissolve other minerals and remove the outer rim of the quartz crystals. Heavy liquid separation was used to purify the quartz. After cleaning an ICP test was conducted to verify quartz purity. Next, a 9Be carrier of ~0.3 g was added to each purified quartz in a Teflon cup, and dissolved with a HF and HNO3 solution with heating. After that, a HClO4 solution was added to the Teflon cup for heating to remove the F- ions. The 10Be separation and purification was achieved using anion and cation ion exchange chromatography. A NH4OH solution was added into the 10Be for generating Be(OH)2 colloids. Then the Be(OH)2 colloid was oxidized into BeO after dehydration with heating to 750°C for 5 min. The BeO powder mixed with Nb was then loaded in stainless steel targets. Accelerator mass spectrometry (AMS) measurements of the 10Be/9Be were carried out in the Purdue Rare Isotope Measurement Laboratory (PRIME Lab) based on revised TCN 10Be standards (Nishiizumi et al., Reference Nishiizumi, Imamura, Caffee, Southon, Finkel and McAninch2007).
Age calculation and interpretation
We used the CRONUS Earth Version 2.3 online calculator (Balco et al., Reference Balco, Stone, Lifton and Dunai2008; Borchers et al., Reference Borchers, Marrero, Balco, Caffee, Goehring, Lifton, Nishiizumi, Phillips, Schaefer and Stone2016; http://hess.ess.washington.edu/math/) to calculate 10Be exposure ages using different scaling models following the 10Be reference production rate of Heyman (Reference Heyman2014), setting the surface erosion rate to zero, the 10Be half time to 1.387 Ma (Chmeleff et al., Reference Chmeleff, von Blanckenburg, Kossert and Jakob2010; Korschinek et al., Reference Korschinek, Bergmaier, Faestermann, Gerstmann, Knie, Rugel, Wallner, Dillmann, Dollinger and Von Gostomski2010), and the rock density to 2.7 g/cm3. Topographic shielding for each sample was calculated using a Python tool and the 30-m ASTER GDEM with designated 5° intervals using both azimuth and altitudinal angles (Li, Reference Li2013). We did not make a correction for shielding due to snow cover, because the seasonal snow cover is sparse at the present-day on the sampling sites and the boulders are too tall to be covered by substantial snow. We assumed the erosion rate as 0 m/Ma. According to Owen et al. (Reference Owen, Robinson, Benn, Finkel, Davis, Yi, Putkonen, Li and Murray2009), under the erosion rate of 2.5 m/Ma, the exposure ages at about 1 ka should be underestimated by <0.5%, and the ages between 10 and 20 ka should be underestimated by ~2 to 5%. Our interpretations were based on the Lal (Reference Lal1991) and Stone (Reference Stone2000) time-dependent scaling method because it provides convenient comparisons between our data and most of other published data for the region (Fu et al., Reference Fu, Stroeven, Harbor, Hättestrand, Heyman, Caffee and Zhou2013; Wang et al., Reference Wang, Kassab, Harbor, Caffee, Cui and Zhang2013; Zhang et al., Reference Zhang, Chen, Li and Liu2016a).
Both measurement uncertainty and geomorphic processes such as moraine denudation and boulder surface erosion can lead to the scatter of the ages. In terms of geomorphic processes, prior exposure could make the ages much older; where post-depositional degradation could lead to underestimates of the true age (Heyman et al., Reference Heyman, Stroeven, Harbor and Caffee2011). We applied a probability density function (PDF) of the measured ages to identify the data cluster or spread (Fig. 4). The potential outliers are identified based on the Chauvent’s criterion, which finds a probability band centered on the mean of a normal distribution that should contain all n samples of a data set. By doing this, any data points from the n samples that lie outside this probability band can be considered to be outliers, removed from the data set, and a new mean and standard deviation based on the remaining values and new sample size can be calculated (Chauvenet, Reference Chauvenet1960; Ross, Reference Ross2003). Then, we calculated the reduced chi-squared statistic
 $\left( {\chi _{R}^{2} } \right)$
. If the
$\left( {\chi _{R}^{2} } \right)$
. If the
 $\chi _{R}^{2} $
value was equal to or less than 1.0, it means the ages are clustered and the measurement error is the source of the difference in ages, then the weighed mean age was assumed to represent the moraine age (Barrows et al., Reference Barrows, Stone, Fifield and Cresswell2002; Balco and Schaefer, Reference Balco and Schaefer2006; Douglass et al., Reference Douglass, Singer, Kaplan, Mickelson and Caffee2006; Balco, Reference Balco2011; Li et al., Reference Li, Liu, Chen, Li, Harbor, Stroeven, Caffee, Zhang, Li and Cui2014; Chen et al., Reference Chen, Li, Wang, Zhang, Cui, Yi and Liu2015; Li et al., Reference Li, Li, Harbor, Liu, Yi and Caffee2016). If the
$\chi _{R}^{2} $
value was equal to or less than 1.0, it means the ages are clustered and the measurement error is the source of the difference in ages, then the weighed mean age was assumed to represent the moraine age (Barrows et al., Reference Barrows, Stone, Fifield and Cresswell2002; Balco and Schaefer, Reference Balco and Schaefer2006; Douglass et al., Reference Douglass, Singer, Kaplan, Mickelson and Caffee2006; Balco, Reference Balco2011; Li et al., Reference Li, Liu, Chen, Li, Harbor, Stroeven, Caffee, Zhang, Li and Cui2014; Chen et al., Reference Chen, Li, Wang, Zhang, Cui, Yi and Liu2015; Li et al., Reference Li, Li, Harbor, Liu, Yi and Caffee2016). If the
 $\chi _{R}^{2} $
value was larger than 1.0, it means the ages are scattered and geomorphic processes have resulted in the age scatter; so, we need to use the range of the data to represent the formation time of the moraine set (Li et al., Reference Li, Liu, Chen, Li, Harbor, Stroeven, Caffee, Zhang, Li and Cui2014; Chen et al., Reference Chen, Li, Wang, Zhang, Cui, Yi and Liu2015; Li et al., Reference Li, Li, Harbor, Liu, Yi and Caffee2016).
$\chi _{R}^{2} $
value was larger than 1.0, it means the ages are scattered and geomorphic processes have resulted in the age scatter; so, we need to use the range of the data to represent the formation time of the moraine set (Li et al., Reference Li, Liu, Chen, Li, Harbor, Stroeven, Caffee, Zhang, Li and Cui2014; Chen et al., Reference Chen, Li, Wang, Zhang, Cui, Yi and Liu2015; Li et al., Reference Li, Li, Harbor, Liu, Yi and Caffee2016).

Figure 4 (color online) Probability density function (PDF) plots of 10Be exposure ages for moraines. The
 $\chi _{R}^{2} $
values for moraines are listed in A, B, C and D, and also a mean age is listed in C. (A) M1 in the Rijiu Valley. (B) M2 in the Yanjin Valley. (C) M3 in the Yanjin Valley. (D) M3 in the SanchaValley.
$\chi _{R}^{2} $
values for moraines are listed in A, B, C and D, and also a mean age is listed in C. (A) M1 in the Rijiu Valley. (B) M2 in the Yanjin Valley. (C) M3 in the Yanjin Valley. (D) M3 in the SanchaValley.
Equilibrium line altitude reconstruction
We used two methods to reconstruct the equilibrium line altitudes (ELAs): the accumulation area ratio (AAR; Meier and Post, Reference Meier and Post1962) and the terminus-to-headwall altitude ratio (THAR; Benn and Lehmkuhl, Reference Benn and Lehmkuhl2000) methods. The AAR method assumes that the ratio of the accumulation area and the ablation area of a glacier is a constant value. The THAR method assumes that the ELA must lie between the terminus and the head of the glacier when the glacier is in a steady state condition.
Five modern glaciers occur in our study area. According to Kern and László (Reference Kern and László2010), the AAR value of 0.44±0.07 is best applied to glaciers with areas in the range of 0.1–1 km2. We assumed the AAR value is equal to 0.44 and calculated the modern ELA of 5045 m. We adopted 0.5 as the THAR value used to calculate paleo-ELA values (Manley, Reference Manley1961).
RESULTS
Exposure ages
We obtained 23 10Be exposure ages from the northern and southern slopes of Mount Xuebaoding.
Yanjin Valley
The age (Sample XBDN-04) obtained from M1 in the Yanjin Valley is 2.5±0.5 ka, indicating a glacial event during the Neoglacial.
The three samples for M2 yield ages of 3.8±0.6, 6.7±0.7 and 9.1±0.9 ka. The PDF of M2 shows a wide exposure age disparity (Fig. 4B). The
 $\chi _{R}^{2} $
value of the three samples on M2 is 60.9 (P<0.05). This indicates that geomorphic processes likely influence the exposure ages. XBDN-18 (3.8±0.6 ka) was sampled from an uneven surface boulder that may be affected by frost shattering, potentially resulting in a significant loss in the cosmogenic nuclide concentration. Therefore, we assign an age range of 9.1 to 6.7 ka to this moraine, indicating a glacial event during the early-middle Holocene.
$\chi _{R}^{2} $
value of the three samples on M2 is 60.9 (P<0.05). This indicates that geomorphic processes likely influence the exposure ages. XBDN-18 (3.8±0.6 ka) was sampled from an uneven surface boulder that may be affected by frost shattering, potentially resulting in a significant loss in the cosmogenic nuclide concentration. Therefore, we assign an age range of 9.1 to 6.7 ka to this moraine, indicating a glacial event during the early-middle Holocene.
Five samples (XBDN-22 to -26) taken from M3 in the Yanjin Valley yielded exposure ages of 12.9±1.5, 13.2±2.3, 13.0±1.3, 10.0±0.9, and 13.7±1.4 ka. The PDF (Fig. 4C) did not show a spread of the ages. The Chauvent’s criterion, however, identified sample XBDN-25 (10.0±0.9 ka) as an outlier. The lower age than the others may be interpreted as a result of significant post-glacial exhumation. After removing this age, the
 $\chi _{R}^{2} $
value of the remaining four ages is 0.4 (P>0.05), exhibiting a well-developed cluster of ages. Thus, we assign a weighted mean age of 13.2±1.7 ka to this moraine, indicating a glacial event during the late glacial.
$\chi _{R}^{2} $
value of the remaining four ages is 0.4 (P>0.05), exhibiting a well-developed cluster of ages. Thus, we assign a weighted mean age of 13.2±1.7 ka to this moraine, indicating a glacial event during the late glacial.
Sancha Valley
Eight datasets (samples XBDN-6 to -12, and XBDN-15) from M3 in the Sancha Valley give 10Be ages of 10.2±1.7, 11.2±3.0, 13.6±1.4, 15.6±1.6, 12.3±1.6, 14.2±1.4, 11.3±1.3, and 11.7±1.3 ka, respectively. Neither the PDF plot (Fig. 4D) nor the Chauvent’s criterion showed any obvious outliers. The
 $\chi _{R}^{2} $
value of these eight samples is 6.4 (P<0.05), indicating the scatter may be caused by post-depositional degradation or prior exposure. The 10Be exposure age of 10.2±1.7 was sampled from a more strongly weathered surface on the boulder than others, so the age is relatively younger than others. Thus, we assign an age range of 15.6 to 11.2 ka to this moraine, indicating a glacial event during the late glacial.
$\chi _{R}^{2} $
value of these eight samples is 6.4 (P<0.05), indicating the scatter may be caused by post-depositional degradation or prior exposure. The 10Be exposure age of 10.2±1.7 was sampled from a more strongly weathered surface on the boulder than others, so the age is relatively younger than others. Thus, we assign an age range of 15.6 to 11.2 ka to this moraine, indicating a glacial event during the late glacial.
M4, down-valley from M3, is clearly morpho-stratigraphically older, and was dated to between 14.1±2.2 ka and 12.9±1.3 ka using samples from boulders XBDN-17 and -16, respectively. Because moraine denudation and sample exhumation may underestimate the ages, we assign 14.1±2.2 ka as the minimum exposure age of this moraine, representing a pre-late glacial event.
Rijiu Valley
Three samples (XBDS-5 to -7) collected from M1 in the Rijiu Valley produced 10Be ages of 1.5±0.2, 1.5±0.1 and 2.0±0.2 ka. The PDF (Fig. 4A) of M1 did not show any outlier, nor did Chauvent’s criterion. The
 $\chi _{R}^{2} $
value of the three samples on M1 is 18.6 (P<0.05). This implies that geomorphic processes influenced the exposure ages. We used 2.0 to 1.5 ka to represent the age of this moraine set, representing a Neoglacial event. One boulder (XBDS- 11) which lies on bedrock on Gr between M2 and M3, was dated to 12.1±1.2 ka, suggesting a glacial retreat during the late glacial.
$\chi _{R}^{2} $
value of the three samples on M1 is 18.6 (P<0.05). This implies that geomorphic processes influenced the exposure ages. We used 2.0 to 1.5 ka to represent the age of this moraine set, representing a Neoglacial event. One boulder (XBDS- 11) which lies on bedrock on Gr between M2 and M3, was dated to 12.1±1.2 ka, suggesting a glacial retreat during the late glacial.
Distribution of ELAs
The ELAs for the four dated glacial events are listed in Table 2. The mean ELA of the pre-late glacial is 4084 m asl in the Yanjin Valley (north slope), 4071 m asl in the Sancha Valley (north slope), and 4283 m asl in the Nami Valley (south slope). The altitude of the glacier head in the Nami Valley is higher than the other two valleys, leading to a greater glacial length. The mean ELA of the late glacial is 4175 m asl in the Yanjin Valley, similar to that of 4154 m asl in the Sancha Valley, but lower than the mean ELA of 4343 m asl in the Nami Valley. The mean ELA during the early–middle Holocene varies from 4300 m asl in the Yanjin Valley, 4281 m in the Sancha Valley, to 4503 m asl in the Rijiu Valley. The mean ELA of the Neoglacial changes from 4341 m asl in the Yanjin Valley, 4366 m asl in the Sancha Valley, to a much higher value of 4813 m asl in the Rijiu Valley.
Table 2 Parameters for studied valleys and the calculated equilibrium line altitudes (ELAs) in different periods

The above results show that the mean ELAs on southern slopes were higher than the values on northern slopes during the different glacial periods. This is likely because southern slopes received more solar radiation and, as a consequence, temperatures on southern/south-facing slopes are often higher, leading to higher ELAs. The geomorphic and ELA evidence shows that glacier coverage in the study area has become restricted since the last glaciation, leading to the increase in the ELA.
The pre-late glacial ELA depression varies from 960 to 974 m on the north slope to 760 m in the south slope. The late glacial ELA depression was 870 to 890 m on the north slope and 700 m on the south slope, respectively. The Holocene ELA depression was between 740 m and 230 m. These results are consistent with the late Pleistocene ELA depression varying between 1000 and 800 m on the eastern TP (Lehmkuhl and Owen, Reference Lehmkuhl and Owen2005). The ELA depression on Mount Xuebaoding is larger than the mountains in the western part, such as Nianbaoyeze and Anymaqen Shan (ELA depression was ~500 m), corresponding to the decreasing precipitation trend from east to west (Lehmkuhl and Owen, Reference Lehmkuhl and Owen2005).
DISCUSSION
Glacial history of Mount Xuebaoding
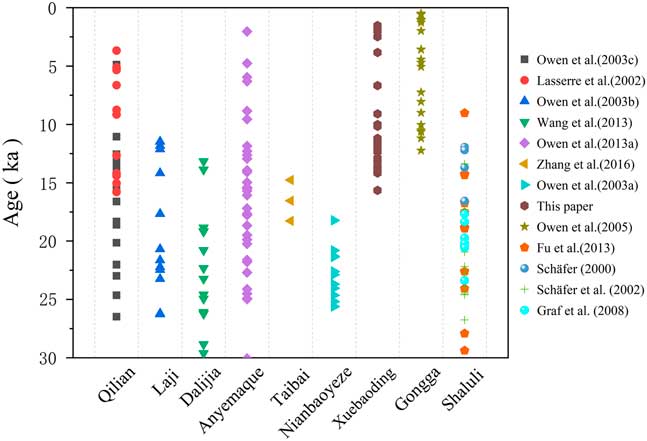
The exposure ages indicate that glaciations were developed much more recently than previously thought in the Xuebaoding massif. Four major glacial events were constrained based on 10Be ages: a pre-late glacial event, a late glacial event, an early–middle Holocene event, and a Neoglacial event. We recalculated the 10Be ages for surrounding mountains (Fig. 1 and 5), using data compiled from previously published literature (Schäfer, Reference Schäfer2000; Lasserre et al., Reference Lasserre, Gaudemer, Tapponnier, Mériaux, Van der Woerd, Daoyang, Ryerson, Finkel and Caffee2002; Schäfer et al., Reference Schäfer, Tschudi, Zhao, Wu, Ivy-Ochs, Wieler, Baur, Kubik and Schlüchter2002; Owen et al., Reference Owen, Finkel, Haizhou, Spencer, Derbyshire, Barnard and Caffee2003a, Reference Owen, Ma, Derbyshire, Spencer, Barnard, Zeng, Finkel and Caffee2003b, Reference Owen, Spencer, Haizhou, Barnard, Derbyshire, Finkel, Caffee and Nian2003c, Reference Owen, Finkel, Barnard, Haizhou, Asahi, Caffee and Derbyshire2005; Graf et al., Reference Graf, Strasky, Zhao, Akçar, Ivy-Ochs, Kubik, Christl, Kasper, Wieler and Schlüchter2008; Heyman et al., Reference Heyman, Stroeven, Harbor and Caffee2011; Fu et al., Reference Fu, Stroeven, Harbor, Hättestrand, Heyman, Caffee and Zhou2013; Wang et al., Reference Wang, Kassab, Harbor, Caffee, Cui and Zhang2013; Zhang et al., Reference Zhang, Liu, Chen, Liu, Harbor, Cui, Liu, Liu and Zhao2016b), in order to make regional comparisions.

Figure 5 (color online) Comparison of the results of this study with other TCN datasets from the mountains in the eastern Tibetan Plateau shown in Figure 1.
Pre-late glacial event
The pre-late glacial event was prior to 14.1 ka, based on our 10Be exposure ages. The timing of the last glacial maximum (LGM) has been determined for most mountains and massifs on the eastern TP (Lasserre et al., Reference Lasserre, Gaudemer, Tapponnier, Mériaux, Van der Woerd, Daoyang, Ryerson, Finkel and Caffee2002; Schäfer et al., Reference Schäfer, Tschudi, Zhao, Wu, Ivy-Ochs, Wieler, Baur, Kubik and Schlüchter2002; Owen et al., Reference Owen, Finkel, Haizhou, Spencer, Derbyshire, Barnard and Caffee2003a, Reference Owen, Ma, Derbyshire, Spencer, Barnard, Zeng, Finkel and Caffee2003b, Reference Owen, Spencer, Haizhou, Barnard, Derbyshire, Finkel, Caffee and Nian2003c; Graf et al., Reference Graf, Strasky, Zhao, Akçar, Ivy-Ochs, Kubik, Christl, Kasper, Wieler and Schlüchter2008; Fu et al., Reference Fu, Stroeven, Harbor, Hättestrand, Heyman, Caffee and Zhou2013; Wang et al., Reference Wang, Kassab, Harbor, Caffee, Cui and Zhang2013; Zhang et al., Reference Zhang, Liu, Chen, Liu, Harbor, Cui, Liu, Liu and Zhao2016b). For example, Lasserre et al. (Reference Lasserre, Gaudemer, Tapponnier, Mériaux, Van der Woerd, Daoyang, Ryerson, Finkel and Caffee2002) and Owen et al. (Reference Owen, Spencer, Haizhou, Barnard, Derbyshire, Finkel, Caffee and Nian2003c) found that glaciers in the Qilian Mountains appeared to have extended 5–10 km further from their modern positions over a period ranging from 26.5±2.6 to 18.6±2.0 ka. Owen et al. (Reference Owen, Ma, Derbyshire, Spencer, Barnard, Zeng, Finkel and Caffee2003b) also reported that glaciers had advanced between 31.4±3.0 and 17.7±1.7 ka in the Laji Mountains. Two advances (between 22.3±2.2 to 28.8±2.9 ka and 18.8±1.8 to 20.8±2.2 ka) occurred during this time in the Dalijia Mountains (Wang et al., Reference Wang, Kassab, Harbor, Caffee, Cui and Zhang2013). A set of moraines provided ages ranging from 30.1±2.9 to 15.4±1.5 ka in the Anyemaqen Mountains (Owen et al., Reference Owen, Finkel, Haizhou, Spencer, Derbyshire, Barnard and Caffee2003a). 10Be ages derived from a rock step on Mount Taibai indicate glacial retreat after 18.3±1.8 ka (Zhang et al., Reference Zhang, Liu, Chen, Liu, Harbor, Cui, Liu, Liu and Zhao2016b). At Nianbaoyeze and Ximencuo, glacial stage relics have been dated to between 25.6±2.5 and 18.2±1.9 ka (Owen et al., Reference Owen, Finkel, Haizhou, Spencer, Derbyshire, Barnard and Caffee2003a). 10Be datasets (between 26.8±2.7 and 17.3±1.8 ka) support the timing of glacial advances in the Shaluli mountain range (Schäfer et al., Reference Schäfer, Tschudi, Zhao, Wu, Ivy-Ochs, Wieler, Baur, Kubik and Schlüchter2002; Graf et al., Reference Graf, Strasky, Zhao, Akçar, Ivy-Ochs, Kubik, Christl, Kasper, Wieler and Schlüchter2008; Fu et al., Reference Fu, Stroeven, Harbor, Hättestrand, Heyman, Caffee and Zhou2013). However, we did not obtain 10Be exposure ages for the LGM in our study area. Perhaps this pre-late glacial event occurred during the LGM or we did not find the glacial relics (glacial landform or boulders) dating to the LGM. The late glacial and Holocene glacial advances may have been more extensive than early events and hence destroyed earlier glacial landforms or sedimentary evidence of earlier glaciations; or, the steeper relief and higher precipitation resulted in more intense landform denudation, leading to the erasure and reworking of older and more extensive glaciations and resulting in extremely poor preservation, only retaining glacial deposits in the central area (Owen et al., Reference Owen, Finkel, Barnard, Haizhou, Asahi, Caffee and Derbyshire2005, Reference Owen, Caffee, Finkel and Seong2008; Schaefer et al., Reference Schaefer, Oberholzer, Zhao, Ivy-Ochs, Wieler, Baur, Kubik and Schlüchter2008; Stroven et al., Reference Stroeven, Hättestrand, Heyman, Harbor, Li, Zhou, Caffee, Alexanderson, Kleman and Ma2009).
Late glacial event
The late glacial event was dated to 15.6 to 11.2 ka in the Sancha Valley, and 13.7 to 12.9 ka (clustered closely around 13.2±1.7 ka) in Yanjin Valley. The glacial boulder on the rock step appeared to be left by a glacial retreat at 12.1±1.16 ka. This glacial stage has also been identified in the Qilian Mountains ranging from 16.6±1.6 to 11.1±1.1 ka (Lasserre et al., Reference Lasserre, Gaudemer, Tapponnier, Mériaux, Van der Woerd, Daoyang, Ryerson, Finkel and Caffee2002; Owen et al., Reference Owen, Spencer, Haizhou, Barnard, Derbyshire, Finkel, Caffee and Nian2003c). The 10Be ages from the moraines along the northern edge of the Laji Mountains are between 14.2±1.4 and 11.5±1.1 ka, suggesting that one glacial advance occurred during the late glacial (Owen et al., Reference Owen, Ma, Derbyshire, Spencer, Barnard, Zeng, Finkel and Caffee2003b). Two ages (giving ages of 13.9±1.3 and 13.2±1.3 ka) appear to represent a glacial event during the late glacial in the Dalijia Mountains (Wang et al., Reference Wang, Kassab, Harbor, Caffee, Cui and Zhang2013). In the Anyemaqen Mountains, the same glacial event has been dated to between 16.1±1.6 and 14.1±1.4 ka (Owen et al., Reference Owen, Finkel, Haizhou, Spencer, Derbyshire, Barnard and Caffee2003a). In the Gongga Mountains, this episode has been dated to between 12.2±1.3 and 10.0±1.3 ka (Owen et al., Reference Owen, Finkel, Barnard, Haizhou, Asahi, Caffee and Derbyshire2005), and to between 18.8±1.9 and 11.9±1.5 ka in the Shaluli Mountains (Fu et al., Reference Fu, Stroeven, Harbor, Hättestrand, Heyman, Caffee and Zhou2013; Schäfer, Reference Schäfer2000). Most of the eastern TP mountains experienced this glacial event.
Early-middle Holocene glacial event
It has been reported that multiple glacial advances and retreats took place during the Holocene (Solomina et al., Reference Solomina, Bradley, Hodgson, Ivy-Ochs, Jomelli, Mackintosh, Nesje, Owen, Wanner, Wiles and Young2015). Our results suggest that a glacial event occurred during the early–middle Holocene, represented by the M2 moraine set within the Yanjin valley. Boulders on moraines in the Anyemaqen Mountains show an age range between 9.6±0.9 and 4.8±0.5 ka (Owen et al., Reference Owen, Finkel, Haizhou, Spencer, Derbyshire, Barnard and Caffee2003a), and one between 9.0±1.1 and 4.4±0.7 ka in the Gongga Mountains (Owen et al., Reference Owen, Finkel, Barnard, Haizhou, Asahi, Caffee and Derbyshire2005). So far, only studies of the above three mountain ranges have reported early to middle Holocene glacial advances on the eastern TP.
Neoglacial
Neoglacial events occurred on both the northern and southern slopes of the study area. The 10Be ages were constrained to 2.5±0.5 ka from the Yanjin Valley, and between 2.0±0.2 and 1.5±0.2 ka for the Rijiu Valley. The Neoglacial event also appears to have occurred in the Gongga Mountains, with seven ages from 3.6±1.4 to 1.0±0.5 ka (Owen et al., Reference Owen, Finkel, Barnard, Haizhou, Asahi, Caffee and Derbyshire2005). The 10Be exposure ages for this glacial event across the eastern TP are scarce.
Driving mechanisms of glacial events
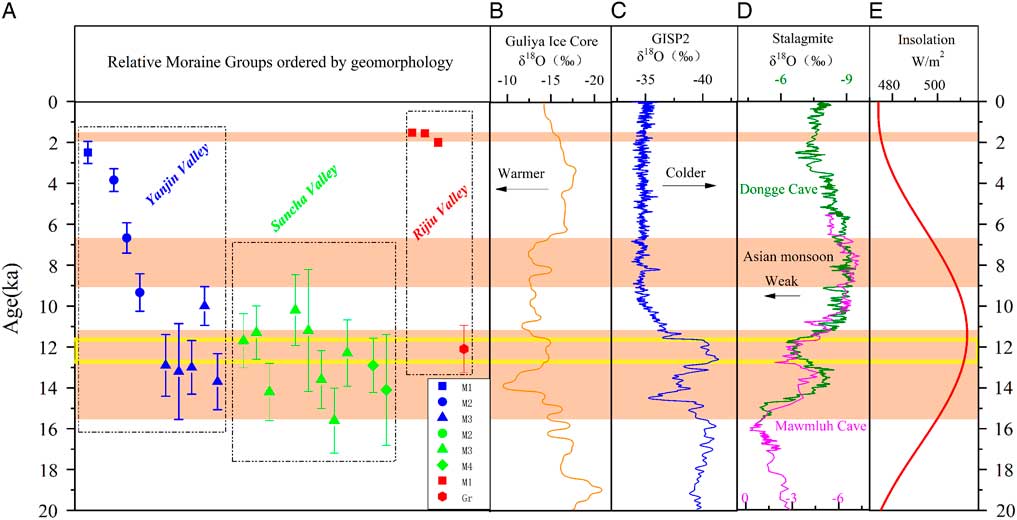
Temperature and precipitation are two major factors affecting glacier change. Figure 6 shows the stalagmite records (Wang et al., Reference Wang, Cheng, Lawrence Edwards, He, Kong, An, Wu, Kelly, Dykoski and Li2005; Dutt et al., Reference Dutt, Gupta, Clemens, Cheng, Singh, Kathayat and Edwards2015) and variations in Northern Hemisphere solar radiation as a proxy for changing precipitation and temperature in the region. Ice-core records (Grootes et al., Reference Grootes, Stuiver, White, Johnsen and Jouzel1993; Thompson et al., Reference Thompson, Yao, Davis, Henderson, Mosley-Thompson, Lin, Beer, Synal, Cole-Dai and Bolzan1997) suggest the temperature proxy and provide the link between temperature and glaciation. The YD event is plotted as a proxy for changes in the Northern Hemisphere ice sheets and oceans to assess correlations and connections. The eastern TP and Himalaya are both located in a monsoon-influenced area, and have synchronous glacial advances. Owen et al (2003, Reference Owen, Caffee, Finkel and Seong2008) believed glacial events in the eastern TP and Himalaya younger than MIS 2 were dominated by monsoon precipitation rather than by the North Atlantic cooling. Seong et al. (Reference Seong, Owen, Yi and Finkel2009) suggested that glacial advances throughout the late glacial and Holocene in the western TP corresponded to rapid climate changes that occurred around the Atlantic Ocean on millennial timescales (Bond et al.,Reference Bond, Showers, Cheseby, Lotti, Almasi, Priore, Cullen, Hajdas and Bonani1997). Yi et al. (Reference Yi, Chen, Yang, Liu, Fu, Liu and Li2008) suggest that the Holocene glacier advances are synchronous with cooling periods identified in the δ18O record in ice cores.

Figure 6 (color online) Multiple proxies for all records. (A) 10 Be age with error bar for examples (M1, squares; M2, circles; M3, triangles; M4, diamonds; Gr, hexagons), with Yanjin Valley examples marked in blue, Sancha Valley examples marked in green, and Rijiu Valley examples marked in red. (B) δ18O values for the Guliya Ice Core (Thompson et al., Reference Thompson, Yao, Davis, Henderson, Mosley-Thompson, Lin, Beer, Synal, Cole-Dai and Bolzan1997). (C) Greenland Ice Sheet Project Two (GISP2) δ18O values (Grootes et al., Reference Grootes, Stuiver, White, Johnsen and Jouzel1993). (D) δ18O values for stalagmites from the Dongge and Mawmluh caves (Dutt et al., Reference Dutt, Gupta, Clemens, Cheng, Singh, Kathayat and Edwards2015; Wang et al., Reference Wang, Cheng, Lawrence Edwards, He, Kong, An, Wu, Kelly, Dykoski and Li2005). (E) June insolation values at 30°N (Berger and Loutre, Reference Berger and Loutre1991). The plots in the black dashed rectangles belong to the same valleys (labeled). The δ18O scales are reversed in the Guliya and Greenland ice cores (increasing leftward) compared with the stalagmites of the Dongge and Mawmluh caves (increasing rightward). The pink bars denote the timing of glacial advances on the Mount Xuebaoding massif. The yellow rectangle denotes the YD event. (For interpretations of the references to color in this figure legend, the reader is referred to the web version of this article.)
Our 10Be ages from Mount Xuebaoding (Fig. 6A) suggest that glaciers experienced some significant glacial advances during the late glacial. This period was in phase with a pronounced temperature drop in the δ18O ice-core records from Guliya and GISP2 (Fig. 6B and C). In particular, the low temperature during the YD period should have a positive impact on glacial advance. A remarkable total organic content minimum and a rapid grain-size increase at nearby Lake Ximencuo indicate a cold climate, probably in response to the YD event (Zhang and Mischke, Reference Zhang and Mischke2009). The δ13C values of both mixed peat and mono-species plant cellulose are highest during ~11.8 to 11.2 ka BP at the Hongyuan site near the Xuebaoding massif, suggesting a period of low relative humidity and temperature (Hong et al., Reference Hong, Hong, Lin, Zhu, Shibata, Hirota, Uchida, Leng, Jiang and Xu2003). It is therefore hypothesized that low temperatures played a key role in controlling glacial advances during the late glacial, as suggested by Hu et al. (Reference Hu, Yi, Zhang, Liu, Jiang and Li2016) from other environmental indices. Increased insolation (Fig. 6E) led to a strong monsoon (Fig. 6D) during the early–middle Holocene. Abundant precipitation fell as snow at high altitudes, which led to positive glacial mass balance and glacial advance. The peat δ13C time series from Hongyuan suggests a high humidity and high temperature during the early-middle Holocene (Hong et al., Reference Hong, Hong, Lin, Zhu, Shibata, Hirota, Uchida, Leng, Jiang and Xu2003). As a result, precipitation is believed to be fundamental in controlling glaciation in these regions during the early-middle Holocene. In the late Holocene/Neoglacial, although precipitation would have been reduced during the insolation minima, the temperature was low enough to lead to positive glacier mass balance, allowing glacier advance. The Guliya Ice core indicates cool temperatures during the Neoglacial period (Fig. 6B). Solar insolation at 30ºN was lower during this period (Fig. 6E; Berger and Loutre, Reference Berger and Loutre1991), and the Dongge Cave record shows weak Asian Monsoon events around 4.4, 2.7 and 1.6 ka (Fig. 6C; Wang et al., Reference Wang, Cheng, Lawrence Edwards, He, Kong, An, Wu, Kelly, Dykoski and Li2005), indicating lower rainfall during these phases. Study of the peat record of the eastern TP has shown a strengthening Asian Winter Monsoonal (AWM) and a weakening Asian Summer Monsoonal (ASM) since ~4.2 ka, reflecting a cold and dry environment (Yu et al., Reference Yu, Zhou, Franzen, Xian, Cheng and Jull2006). It seems that low temperatures were the dominant driving factor behind any Neoglacial glacial advances (Ou et al.,Reference Ou, Lai, Zhou and Zeng2014).
CONCLUSIONS
We obtained 23 10Be exposure ages for three valleys in Mount Xuebaoding area. These ages suggest at least four glacial events in this area: prior to the late glacial, during the late glacial, early–middle Holocene, and Neoglacial periods. The mean ELAs on southern slopes were higher than the values on northern slopes during different periods because of higher solar radiation and temperatures on the southern slope. The ELA depression on Mount Xuebaoding is larger than the mountains in the western part of the TP, corresponding to the decreasing precipitation trend from east to west. The glacial chronology of Mount Xuebaoding is synchronous with that of other mountain ranges, despite slight differences in the timing and extent. In summary, glacial advances during the late glacial was most likely driven by the low temperature; the early-middle Holocene glacial advance was mainly controlled by precipitation; and the late Holocene/Neoglacial glacial event is also related to a cooling environment.
ACKNOWLEDGMENTS
This work was supported by the National Natural Science Foundation of China (Grant Nos. 41230743, 41771005, 41671005, and 41371082). We thank Jiafu Zhang, Wei Zhang, Jingdong Zhao, Jie Wang, Xiufeng Yin, and Zhenyu Nie for their help in the field investigation. We thank Chaolu Yi and Jinhua Liu at the Key Laboratory of Tibetan Environment Changes and Land Surface Processes, Institute of Tibetan Plateau Research, Chinese Academy of Sciences for their help in sample preparation. We appreciate Dr. Jackson S. George and Thomas E. Woodruff at the PRIME Lab for sample measurements and Dr. Edward Derbyshire for manuscript editing. We thank the reviewers and editors for their constructive comments.
SUPPLEMENTARY MATERIAL
To view supplementary material for this article, please visit https://doi.org/10.1017/qua.2018.33