Introduction
Common bean (Phaseolus vulgaris L.) is a true diploid (2n = 22) with a small genome (650 Mb) (Broughton et al., Reference Broughton, Hernandez, Blair, Beebe, Gepts and Vanderleyden2003) and the most important grain legume for human consumption in developing countries (Buruchara et al., Reference Buruchara, Chirwa, Sperling, Mukankusi, Rubyogo, Muthoni and Abang2011). Common bean comprises of Mesoamerican and Andean gene pools, further sub-divided into races. Mesoamerican races include: Durango (D), Jalisco (J) and Mesoamerica and Guatemala (Gepts and Bliss, Reference Gepts and Bliss1988; Singh et al., Reference Singh, Gepts and Debouck1991; Beebe et al., Reference Beebe, Gonzalez and Rengifo2000). This report was limited to the Mesoamerican gene pool due to its wider adaptation and additional genetic diversity (Singh and Muñoz, Reference Singh and Muñoz1999; Beebe et al., Reference Beebe, Gonzalez and Rengifo2000).
Population sub-divisions arose in wild common bean approximately 110,000 years ago followed by a bottleneck before domestication, and later, a domestication bottleneck reduced genetic diversity (Mamidi et al., Reference Mamidi, Rossi, Moghaddam, Annam, Lee, Papa and McClean2013). Improvement programmes of common beans can be envisioned in evolutionary perspectives to fit Darwin's theories, which include: selection, heredity and variations into the plant-breeding cycle (Acquaah, Reference Acquaah2007; Hallauer et al., Reference Hallauer, Carena and Filho2010). Natural and heritable variation accounts for most of the responses made in plant breeding (Caligari, Reference Caligari2001). While highly heritable traits are subject to large genetic gains then phenotypic selection is done per generation (Hallauer et al., Reference Hallauer, Carena and Filho2010).
Population structure analyses helps to detect levels of allelic variability, which is critical for discovery of quantitative trait loci (QTLs) in admixed populations and impacts association mapping, which exploits recombination events that have occurred in genotypes (Myles et al., Reference Myles, Peiffer, Brown, Ersoz, Zhang and Costich2009; Mamidi et al., Reference Mamidi, Rossi, Moghaddam, Annam, Lee, Papa and McClean2013). Population structure needed to be determined among common bean germplasm collection because it causes spurious association between molecular markers used in selection and QTLs (Yu and Buckler, Reference Yu and Buckler2006) of economic importance such as yields.
To improve common bean productivity in Eastern Africa; yield traits need to be selected for in addition to pest and diseases, which cause bean production loses (Abebe et al., Reference Abebe, Brick, Ogg and Kirkby1996; Wortmann et al., Reference Wortmann, Kirkby, Eledu and Allen1998).
Previously, core germplasm maintained in Uganda was characterized with Microsatellite markers (SSRs) which found high genetic variations in the germplasm for use in breeding (Okii et al., Reference Okii, Tukamuhabwa, Kami, Namayanja, Paparu, Ugen and Gepts2014b). Performance of developed bean progenies can also be predicted using well-characterized parents selected (Muthomi et al., Reference Muthomi, Muimui and Kimani2011). For example, interracial transfer of economically important traits was successful among bean gene pool races (e.g. Kelly, Reference Kelly2004; Pathania et al., Reference Pathania, Sharma, Sharma and Singh M.2014). Four parental germplasm later detailed under Materials and methods section required more focus, because they are popular source of resistance to major diseases in East Africa. Identification and selections of high-yielding recombinant bean lines with desirable seed types, however, remains a challenge for crosses derived from parents from the same gene pool race (Singh et al., Reference Singh, Gepts and Debouck1991a; Singh et al., Reference Singh, Molina, Urrea and Gutierrez1993). The study objectives were, first, to assign 50 Mesoamerican germplasm into respective gene pool races using both SSRs and phenotypes and comparisons to Mesoamerican bean races attributes in previous reports (Singh et al., Reference Singh, Gepts and Debouck1991; Beebe et al., Reference Beebe, Gonzalez and Rengifo2000; Díaz and Blair, Reference Díaz and Blair2006; Blair et al., Reference Blair, Iriarte and Beebe2006a). Secondly, to estimate the heritability of yield its for predicting its genetic gains in bean populations and progenies derived from the available Mesoamerican germplasm.
Materials and methods
Parental genotypes and field evaluations in 2015
Thirty seeds of parental genotypes: G2333, MCM5001, MEX54 and MLB49-89A were planted in plots of three rows measuring 3 m long, with spacing of 20 cm between plants and 60 cm for climbers between rows. The field trials were done for two seasons in 2015 with three replications at CIAT, Kawanda. Climbers were supported on wooden stakes and the following traits were evaluated from plant emergency to post-harvest using the bean trait dictionary(http://www.cropontology.org/ontology/CO_335/Common%20bean); days to 50% flowering (DFLO), numbers of: internodes (Nodeno), flower buds (Flobuds) and pods per plant (Npdsplt), seeds per plant (Sdplt) and weight of 100 seeds (HWS). Descriptive traits observed among germplasm were plant types and seed colours.
Genotype G2333 (Colorado de Teopisca) from Mexico (Young and Kelly, Reference Young and Kelly1996) is grown in East Africa and has broad resistance to severe races of Colletotrichum lindemuthianum (Pastor-Corrales et al., Reference Pastor-Corrales, Erazo, Esrada and Singh1994; Miklas et al., Reference Miklas, Kelly, Beebe and Blair2006). G2333 was released in Rwanda as Umubano, as Lyamungu 85 in Kenya and as NABE10C in Uganda. G2333 belongs to the Mesoamerican gene pool race Guatemala (Blair et al., Reference Blair, Iriarte and Beebe2006a, Reference Blair, Giraldo, Buendía, Tovar, Duque and Beebeb) with climbing growth type IV, with shiny red seeds preferred in local markets, tolerant to low soil fertility and yields highly with more than 40 pods per plant.
MEXICO 54 is a climbing genotype of growth type III, with medium sized brown seeds, and is a major source of resistance to most African isolates of Angular leaf spot (Mahuku et al., Reference Mahuku, Henríquez, Munõz and Buruchara2002; Namayanja et al., Reference Namayanja, Buruchara, Mahuku, Rubaihayo, Kimani, Mayanja and Eyedu2006). MLB 49-89A is a climber of type III and medium seeded black seeds and resistant to root rot disease (Otsyula et al., Reference Otsyula, Ajanga, Buruchara and Wortmann1998) in fields of Eastern Africa. The black colour of MLB49-89A however has low preferences in local markets but it is highly demanded due to early maturity, fast cooking and good taste (Otsyula et al., Reference Otsyula, Rachier, Ambitsi, Ndiya, Buruchara, Sperling, Sperling, Remington, Haugen and Nagoda2004; Buruchara, Reference Buruchara and Fortmann2009). MCM 5001 (released as K 131 in Uganda) is a CIAT bred genotype of bush type with cream speckled small seeds, with resistance to BCMNV (Bean common mosaic necrosis virus) and was derived from crossing genotypes: IVT 831629 and BAT 1554 (Sengooba et al., Reference Sengooba, Spence, Walkey, Allen and Lana1997).
Field evaluations and SSRs genotyping in 2010–2011
Phenotypic and molecular datasets of 50 Mesoamerican genotypes in the present analyses was obtained from datasets of 100 core Andean and Mesoamerican genotypes previously characterized (Okii et al., Reference Okii, Tukamuhabwa, Kami, Namayanja, Paparu, Ugen and Gepts2014b). The 50 genotypes comprised of 39 landraces from Uganda and 11 exotic bean lines including the four parents: G2333, MCM5001, MEXICO 54 and MLB49-89A selected to develop progeny lines with major disease resistance, which are in advanced stages of evaluations at CIAT Uganda. SSR allele fragments at 22 marker loci of the 11 chromosomes of common bean were obtained using the ABI PRISM 3730 genetic analyser instrument (Applied Biosystems, USA) at the Veterinary Genetics laboratory at University of California, Davis in 2011. Plant type, seed size and 100 seed weight, which strongly depicts the crops domestication syndrome (Koinange et al., Reference Koinange, Singh and Gepts1996) and SSR allele sizes of the 50 genotypes in storage was analysed in the present study.
Data analysis
Allelic diversity among genotypes
The following genetic diversity parameters: allele number and frequencies, gene diversity, heterozygosity and polymorphism information content (PIC) were calculated for each SSR marker among the 50 Mesoamerican bean germplasm using Power Marker software version 3.25 (Liu and Muse, Reference Liu and Muse2005).
Race structure determination using multivariate analyses
In order to identify the race structure among the 50 Mesoamerican genotypes; its genotypic data was analysed using two programs according to similar studies (for example, Díaz and Blair, Reference Díaz and Blair2006 and Blair et al., Reference Blair, Iriarte and Beebe2006a). An un-weighed neighbour-joining (NJ) phylogenetic tree was generated using the Darwin program (Perrier and Jacquemoud-Collet, Reference Perrier and Jacquemoud-Collet2006). While, the amounts of genetic differentiation (F ST) among presumed sub-populations (K) was analysed using the STRUCTURE program (Pritchard et al., Reference Pritchard, Stephens and Donnelly2000). The minimum number of K (1) and maximum K (4) were set in STRUCTURE given existence of a single Mesoamerican gene pool with four distinct races. The analysis had 10 simulations per K using 5000 replicates for burn-in and for analysis 50,000 iterations. The number of sub-groups or clusters was determined using the highest estimated probability among 50,000 runs using the software program STRUCTURE (Pritchard et al., Reference Pritchard, Stephens and Donnelly2000; Díaz and Blair, Reference Díaz and Blair2006). The ‘true’ number of sub-populations (K) was confirmed according to Evanno et al. (Reference Evanno, Regnaut and Goudet2005) using the STRUCTURE Harvester (Earl and Vonholdt, Reference Earl and Vonholdt2012), available online (http://taylor0.biology.ucla.edu/struct_harvest/) for visualizing outputs. The race admixtures were identified for genotypes using the shared membership coefficients (%) among differently coloured sub-groups in the STRUCTURE bar plot (Díaz and Blair, Reference Díaz and Blair2006).
Determination of phenotypic variations and heritability
The level of phenotypic variations among the 50 Mesoamerican genotypes was determined with a classical and non-parametric linear dimensionality reduction technique (Jolliffe, Reference Jolliffe2002) of principal component analysis (PCA) in SAS program (SAS Institute Inc, 2011) to show genetic relationships. Phenotypic data, depicting the crops domestication syndrome (Koinange et al., Reference Koinange, Singh and Gepts1996) specifically plant type, 100 seed weights and seed colours from our previous study (Okii et al., Reference Okii, Tukamuhabwa, Kami, Namayanja, Paparu, Ugen and Gepts2014b) was used in PCA to establish, the relationships between groups generated from DNA molecules and phenotypes.
Heritability values for six agronomic traits were regarded as narrow sense due to fixed nature (Acquaah, Reference Acquaah2007) of the four parental populations evaluated in the Breeding-View program (Release 18.0, VSN International Ltd, Hemel Hempstead, UK).
Genotype × Environment (GXE) analysis using populations of four parents
Agronomic traits of selected parents (G2333, MCM5001, MEX54 and MLB49-89A) was planted in 2010/2011 at NaCRRI (environment 1) and 2015 at CIAT-Kawanda (environment 2) using Randomized incomplete block designs with three replicates was tested using t tests, to predict the effects of GXE interactions on bean agronomic traits of genetic pyramided lines derived from these parents, which are in advanced stages of evaluations towards development of germplasm with multiple disease resistance. Data of the four parents evaluated in 2010/2011 (Okii et al., Reference Okii, Tukamuhabwa, Odong, Namayanja, Mukabaranga, Paparu and Gepts2014a) were compared as part of the analysis.
Results
Genetic variations within the genotypes
The level of genetic variation was considerable among the germplasm for utilization in developing superior bean lines (Table 1). Alleles in parents ranged from one to six with a mean of four alleles per locus. Marker PVBR107 on linkage group (LG) two had the highest number of alleles. Heterozygosity (Ho) ranged from zero to 0.8, with mean Ho of 0.5 for the markers tested. All the SSR markers were able to distinguish parental lines except marker BM159 on common bean LG three. The mean polymorphic information content (PIC) of markers within this Mesoamerican germplasm was 0.6 and ranged from 0.0 for BM159 to 0.8 for PVBR107, BM175, BMd37, GATS11B and BMd42.
Table 1. Genetic diversity parameters among 50 common bean germplasm in Uganda

Unique alleles and potential SSRs for use in selection
For practicability of the high allelic polymorphism for marker-assisted selection (MAS), focus under this section; was shifted to markers on LGs two, six, seven and eight, which have disease resistance genes pyramided as introduced. Each of the four parental lines had a unique allele based on diversity analyses of the 11 bean chromosomes or LGs, presented (Table 2). Similarly, other potential markers in genotype MLB49-89A were SSR allele 148/148 on LG two, at the PVBR107 marker locus and SSR allele 236/236 at marker locus BM156. On LG six examples of polymorphic SSR alleles were: 201/249 in MEXICO54 was at locus BM187 and SSR allele112/160 in MCM5001 at marker locus BMd37. On bean LG seven, heterozygous allele 208/308 was unique to MEXICO54 and located at BM160. On linkage BM189 group eight, two unique heterozygous alleles in genotype MCM5001 were 144/152 and 130/132 located at SSR marker loci BM189 and BM211, respectively.
Table 2. Allele bins at 22 SSR loci among four targeted parental genotypes
a Alleles in bold were polymorphic at a given loci on chromosomes of parental germplasm. Allele number −9 indicates lack of marker amplification or absence of allele in genotype.
b Chromosomes – 2, 6, 7 and 8 was tagged to show fungal and viral disease resistance genes in Common beans.
Consequently, unique alleles observed among parents at different loci and LGs could be amplified in polymerase chain reactions (PCR) and separated in electrophoresis gel systems as markers, if they strongly co-segregated with traits of interest such disease resistance among bean progeny lines. For instance, allele 166/166 in the BM183 locus was present in three parental genotypes MLB49-89A, MEXICO 54 and G2333, which showed resistance to Pythium root rot disease from screen house evaluations in 2016 (results not published). Could allele 208/308 at marker locus BM160 therefore be associated with resistance to Pythium ultimum root rot disease in this population and subsequent progeny lines developed?
Allelic dynamics on four LGs with disease resistance genes
As introduced; the four selected parents have broad based disease resistance genes for Anthracnose (Co42 and Co5), Angular leaf spot (Phg-2), P. ultimum root rots (P.ult) and Bean Common Mosaic and Necrosis virus (I and bc3) pyramided into a single background and CIAT and progeny lines are in advanced stages of evaluations. The six disease resistance genes pyramided are physically located on LGs two, six, seven and eight. Further analyses of molecular data therefore, attempted to find polymorphic SSR markers and its alleles among the four selected parents and relate it to genomic regions earlier mapped in common bean with disease resistance (Miklas et al., Reference Miklas, Kelly, Beebe and Blair2006) for alternative co-dominant marker discovery.
The most frequent alleles among the four parental genotypes are shown (online Supplementary Table S1). LG two had 57 alleles and the most frequent allele 170/170 bp was homozygous with a frequency of 25% and had 26 alleles at marker locus PVBR107 in genotype MCM5001. LG six; had 86 alleles and the most frequent allele (201/249 bp) was heterozygous with a frequency of 13% and 13 alleles at locus BM187 and found in MEXICO 54. LG seven had 29 alleles detected within the population, with the most frequent allele homozygous (172/172 bp) with a frequency of 46% and 47 alleles at locus BM183. LG eight; had three alleles detected among the four parents, with the most frequent allele heterozygous (212/214 bp) having a frequency of 25% and 19 alleles at locus BM211.
Population structure
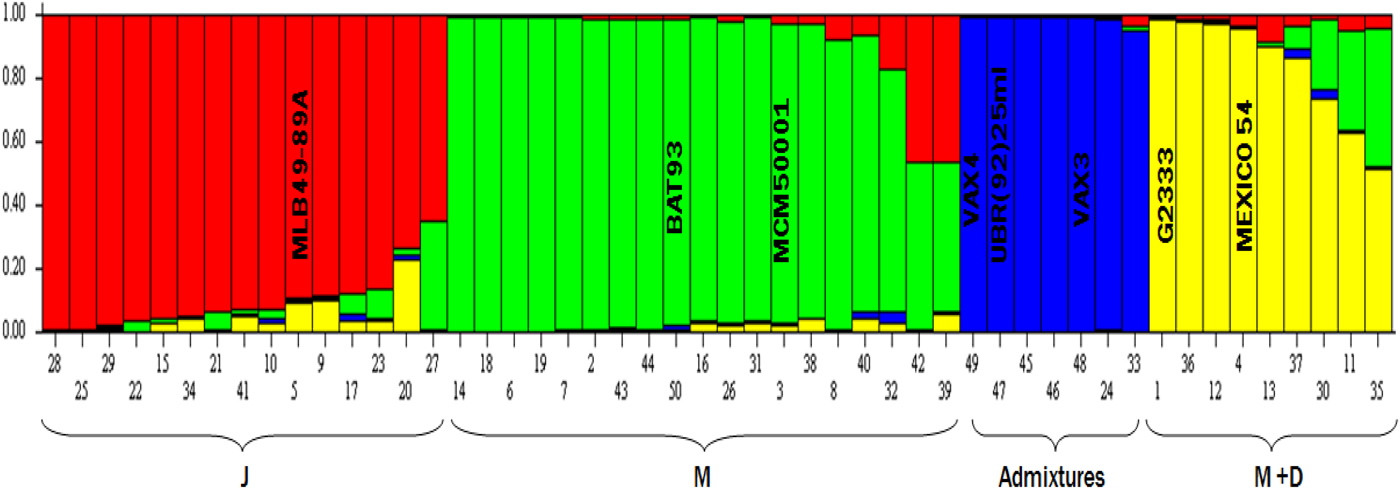
Majority of genotypes in this study belong to race Mesoamerica (38%), followed by Jalisco (30%), Mesoamerica–Durango hybrids (18%) and interracial-admixtures the least with frequency of 14% (Fig. 1). Identification of race backgrounds of the different single bean genotypes were based on molecular analysis in STRUCTURE (and showed in the bar plot) and related to plant type and seed sizes using the NJ tree. Examples of admixture entries were: 22, 15, 34, 21, 41, 10, 5, 9, 17, 23, 20 and 27 within the red sub-group (Jalisco race) because they drew membership or race background colourations from more than one group. Using the same analogy, admixtures could be identified within race Mesoamerican (green) and Mesoamerica–Durango hybrids. However, the blue race was designated as admixture because of the published pedigrees of control genotypes such as VAX3 and VAX4. Individual bean genotypes were assigned to different sub-populations using controls such as G2333 for the Mesoamerican race and Mexico 54 for race Durango.

Fig. 1. Bean germplasm was assigned to sub-groups (races) using 50% membership coefficient (y-axis) cut off and races identification (x-axis) based the molecular analysis, growth habit, seed attributes and previous reports (e.g. Singh et al., Reference Singh, Gepts and Debouck1991a; Díaz and Blair Reference Díaz and Blair2006; Blair et al., Reference Blair, Iriarte and Beebe2006a, Reference Blair, Giraldo, Buendía, Tovar, Duque and Beebeb). Parents used to develop pyramids were: 5 = MLB49-89A (Jalisco – J), 3 = MCM5001 (Mesoamerica – M), 1 = G2333 (M), 4 = MEXICO 54 (Durango – D) and 50 = Mesoamerican gene pool control (BAT93). The sub-group designated as Admixtures was based on controls in the group such as VAXES derived from inter-specific crosses. Note: Individual genotypes within the bar plot above with more than one colour show inter-racial gene flow and were thus also considered race admixtures.
The high levels of genetic diversity exhibited by different analyses show that the Mesoamerican germplasm grouped clearly into races, with low marker density. Secondly, NJ tree analyses, complemented STRUCTURE analyses in defining the number of sub-groups in this domesticated bean population.
Fixation indices among four sub-groups (K4.1–K4.4)
The mean fixation index of Wright (Reference Wright1965) shows moderate genetic heterogeneity among subpopulations predicted with STUCTURE as 0.1829 for Fst1 (K4.1 – red sub-group), 0.1579 for Fst2 (K4.2 – green sub-group), 0.0678 for Fst3 (K4.3 – blue group) and 0.1585 for Fst4 (K4.4 – yellow sub-group). High levels of genetic differentiation in the study suggest that this core bean germplasm comprises predominantly interracial admixtures, which depict interracial-gene flow.
More subtle sub-division of the bean population was generated using the NJ tree branches (Fig. 2) coloured based on STRUCTURE bar plot results. Major cluster: C1 categorized as race Mesoamerica had three sub-clusters depicting high levels of germplasm admixtures within this race. Major cluster, C2 was designated as the admixture cluster, predominated by beans of types II and III growth habits. Other major clusters (C3 and C4) were predominated by types III and IV growth habits. A bush and small seeded landrace (No. 42) appeared as an outlier in sub-group C3.

Fig. 2. Un-weighed neighbour-joining tree (NJ) showing Mesoamerican germplasm in Uganda grouped into four major clusters C1-C4. Major group C1 with majority of germplasm was further sub-grouped based on tree branch lengths. NJ tree branches were coloured according to groups identified with STRUCTURE simulations using colour codes in the Power Marker program. There was germplasm membership switching among major clusters; for example genotypes no: 11, 30 and 37 should have been assigned to C4 and 20, 22 and 23 to cluster C3.
Morphological variability of Mesoamerican races of common beans was reported in Singh et al. (Reference Singh, Gepts and Debouck1991) to guide germplasm utilizations. For example, beans from race Durango (D) are predominantly type III with small and medium seeds, while Jalisco (J) has predominantly small seeded beans of types I and III. Race Mesoamerica (M) was predominated by small seeded beans of <25 g/100 seeds, with both determinate (type II) and indeterminate beans (types III and IV).
Morpho-agronomic traits and heritability estimates
Agronomic traits were significantly different (P < 0.05) among genotypes evaluated across testing regimes (locations and years) as shown in Table 3. Trait means and ranges are presented with parental germplasm (G2333, MCM 5001, MEXICO 54 and MLB49-89A) for developing multiple disease resistance lines with fifteen internodes per plant (Nodeno) ranging from 7.7 to 21.6. The mean flowering time (DFLO) was 40 days (35–46.2), with five flower buds per inflorescence (Flobuds), ranging from 3.8 to 8.1 and seeds of both small and medium sizes weighing 28.4 g/100 seeds and moderately number of pods per plant (Npods_plt), ranging from 20.6 to 44.4 pods. Heritability values estimated were high (≥0.81) for the agronomic traits.
Table 3. Agronomic trait performance of four selected parents across two environments

CV, coefficient of variation, Heritability is narrow sense; Dflo, Days to flowering; Nodeno, Number of nodes on the main stem; Flobuds, Number of flower buds; HWS, weight of 100 seeds; Npodsplt, Number of pods per plant.
Traits with mean performance with asterisk (*) across two environments are significant at P value = 0.05, based on t tests. Season 2010/11 and 2015A/B corresponds to the first and second rainy seasons at NaCRRI, Namulonge (environment 1) and CIAT, Kawanda (environment 2) respectively in Uganda.
The germplasm growth habit was predominantly of type III (42%), followed by type II (30%) and a 14% frequency for types I and IV. This indicated predominance of climbing beans germplasm (types III and IV) with frequency of 56%, while 44% were bush. The predominant seed colours were cream (12%), mixtures (12%) and red (11%), followed by white (7%), black (4%), maroon (3%) and purple (1%) was the least. The mean seed weight of the germplasm was 25.7 g per 100 seeds.
GXE interactions and correlations among yield traits
The number flower buds per plant, 100 seeds weight and number of pods per plant were significantly affected (P < 0.05) influenced by season and environment interactions (Table 3). Strong positive correlations was observed between pod attributes and number of nodes per plant (r > 0.98 and 0.76), number of flower buds and nodes per plant (r = 0.70) at different times. Strong negative correlations (Table 4) were observed between flowering time and: number of pods formed per plant (r = −0.82 in 2015A/B and r = −0.28 in 2010/11) and 100 seeds weight (r = −0.78 in 2015A/B and r = −0.74 in 2010/11).
Table 4. Correlations of agronomic traits of four selected parents evaluated across different environments and years in Uganda
Traits: Nodeno, Number of nodes on the main stem; Dflo, Days to flowering; Flobuds, Number of flower buds; HWS, weight of 100 seeds; Npodsplt, Number of pods per plant.
Significant correlations (***) at P < 0.001) for four parental traits evaluated in 2010/11(a) and 2015A/B (b).
afirst season
bsecond season
The first two principal components explained 80% of the phenotypic variation in the germplasm assembled (online Supplementary Fig. S1). The first component explained up to 46.86% of the variation based on plant type and 100 seed weight. The strongest traits under the second component were seed colour, plant type, and explained 33.2% of the variation among the germplasm.
Discussion
Genetic diversity and population structure
Broad genetic bases of germplasm create opportunities for selection in crop improvement programmes (Hallauer et al., Reference Hallauer, Carena and Filho2010). In this regard, a major observation was that, germplasm displayed strong considerable intra-gene pool allelic diversity and variation. Moreover, few samples (N = 50) were evaluated due to economic reasons, despite larger organized collections in Uganda (Okii et al., Reference Okii, Tukamuhabwa, Odong, Namayanja, Mukabaranga, Paparu and Gepts2014a). The four parents selected for developing genetic pyramids drew membership from four sub-populations predicted (Fig. 1) due to prior interracial hybridizations and gene flows. However, genotypes no. 1 (G2333) and no. 4 (MEXICO 54) with distinct seed types, possibly clustered together due to their climbing ability. Previous authors earlier assigned G2333 to race Guatemala (Blair et al., Reference Blair, Iriarte and Beebe2006a). For this study, medium seeded genotype MEXICO 54 was assigned to race Durango and MLB49-89A to race Jalisco.
High SSR allelic variations within the germplasm are comparable to findings in other studies which involved Mesoamerican common beans (e.g. Blair et al., Reference Blair, Iriarte and Beebe2006a; Blair et al., Reference Blair, Gonzalez, Kimani and Butare2010). Our results and similar studies (such as Singh et al., Reference Singh, Molina, Urrea and Gutierrez1993; Duarte et al., Reference Duarte, João and Leonardo1999; Díaz and Blair, Reference Díaz and Blair2006) justifies the selection of parents from only the Mesoamerican gene pool due to its large genetic variations and wider adaptation worldwide (Singh et al., Reference Singh, Molina, Urrea and Gutierrez1993) for developing elite lines, with desirable qualities, such as resistance to major tropical diseases. Literature was limiting, to compare our results to allele frequencies, unique to the Mesoamerican gene pool of common bean in Eastern Africa.
Allelic dynamics among parental germplasm and linked QTLs
To mark differences between common and rare alleles, threshold is set to consider all alleles with frequencies below 0.05 as rare (FAO, 2009). Rare alleles from parental germplasm will be lost in subsequent progenies due to segregations and selection. Instead, major alleles: 170/170 (PVBR107) in MCM5001 and 201/249 in MEXICO 54 (Table 2) need more investigation, as they will likely be fixed in progenies and could be useful markers for selection. QTLs linked to marker BM187 on LG six are days to flowering, plant height, plant-width and seeds per plant (Blair et al., Reference Blair, Giraldo, Buendía, Tovar, Duque and Beebe2006b).
SSR loci linked to QTLs, revealed significant genotypic and allelic differences associated with common bean agronomic traits suggesting that these markers are potentially useful in selection, at least in the Mesoamerican genetic background described and its progenies.
Genotype membership switching and outliers such as genotype no. 42 based on SSR analyses and NJ tree was possibly due to limited information on the linkage associations between SSR markers and the QTLs for bean seed weight and plant type and environmental effects on the phenotypes. There was however, less evidence for existence of race Guatemala in this germplasm collection possibly due to few samples genotyped. Genotypes belonging to race Guatemala (G) have climbing growth habit and are small seeded genotypes, with resemblance to race Mesoamerica (Beebe et al., Reference Beebe, Gonzalez and Rengifo2000; Díaz and Blair, Reference Díaz and Blair2006).
High genetic differentiation between race Durango/Jalisco and Mesoamerica based on RAPD markers was earlier reported (Duarte et al., Reference Duarte, João and Leonardo1999). According to other studies, estimating genetic variations using morpho-agronomic traits does not completely guide the selection of parents especially when some of the genotypes evaluated are not well adapted (Duarte et al., Reference Duarte, João and Leonardo1999). Nevertheless, the same authors observed that genotypes of Mesoamerican origin tend to separate according to their proposed races, when genotyped with dominant RAPD markers in Brazil. SSRs and other markers in similar studies allowed sub-population differentiations to be revealed more accurately (Díaz and Blair, Reference Díaz and Blair2006).
The numbers of major sub-groups simulated using STRUCTURE (four) and NJ tree (six) differed possibly because STRUCTURE did not assume a particular mutation process during analysis (Pritchard et al., Reference Pritchard, Stephens and Donnelly2000). CIAT lines, such as VAX3 and VAX4 currently used as sources of resistance to Common bacterial blight (CBB) disease, occurred in a separate sub-group (admixtures) because of pedigree; as they were derived from inter-specific crosses of P. vulgaris and P. acutifolius (Singh et al., Reference Singh, Muñoz and Terán2001).
The identified races of 50 germplasm (which include the four parents used to develop progeny lines for multiple disease resistance at CIAT) will improve our knowledge of host-pathogen co-evolutionary relationships (Guzmán et al., Reference Guzmán, Gilbertson, Nodari, Johnson, Temple, Mandala, Mkandawire and Gepts1995) during evaluation of progeny lines currently under evaluations and other populations derived from this germplasm in the near future. For example, information on virulence and evolutions of major pathogens of beans and periodic follow of this germplasm at farm level is required to compliment efforts for breeding bean for disease resistance.
Persistent seed mixing of beans genotypes by farmers in East Africa (David and Sperling, Reference David and Sperling1999; Blair et al., Reference Blair, Gonzalez, Kimani and Butare2010), however affects the dynamics of the co-evolutionary relationship. Susi (Reference Susi2014) suggested trade-offs and co-infection to explain host–pathogen evolutionary relationships in plants. The time (400 years) since introduction of common beans into East-Africa (Gepts and Bliss, Reference Gepts and Bliss1988; Buah et al., Reference Buah, Buruchara and Okori2017), was adequate for emergency of mutant pathogens different from ones in the centre of bean domestications in Latin America (Gepts and Bliss, Reference Gepts and Bliss1988).
Phenotypic variation, heritability and trait stability
Selection for seed colour was much earlier observed in beans (Beebe et al., Reference Beebe, Ochoa, Skroch, Nienhuis and Tivang1995) and recovered significant segments of the bean genome, through linkage drags, causing beans with the same colour to be more related under purposive groupings (Duarte et al., Reference Duarte, João and Leonardo1999). Nonetheless as observed in this study, previous studies found overlaps; between Race Durango and Jalisco in terms of seed colour and growth habit (Díaz and Blair, Reference Díaz and Blair2006).
More consistent correlations were observed in different years for: number of, pods per plant and nodes per plant, days to flowering and 100 seed weight. These traits can be evaluated interchangeably during bean breeding. For example, the number of pods per plant showed strong associations with days to flowering and this relationship is critical for future population development and selection of superior bean lines.
Heritability values are classified as low (0–0.29), medium (0.3–0.59) and above 0.6 as high (Dabholkar, Reference Dabholkar1992). The heritability values determined were narrow sense since the elite parental germplasm in this study generated additive type of variance (Acquaah, Reference Acquaah2007).
High heritability estimates for bean agronomic traits presented in Table 3; corroborates values reported elsewhere for architectural traits of dry beans such as 0.85 for the number of pods in the mid-section of the plant and 0.77 for seed weight in grams per 100 seeds (Acquaah, Reference Acquaah2007). High narrow sense heritability was reported in other studies for common bean seed yield using F2 generation families as: 0.69 for pods per plant, 0.67 for 100 seeds and 0.97 for days to flowering (Abebe et al., Reference Abebe, Brick, Ogg and Kirkby1996).
The differences in heritability values in this study in relation to others in literature was attributed to specific focus on: the Mesoamerican gene pool which comprise of small to medium sized seeded beans, sample size, and method used for estimations of variance components of heritability.
Traits with high heritability result in increased population response to selection in the desired direction of change (Acquaah, Reference Acquaah2007), suggesting that parents bearing particular measurements reproduce progeny of similar phenotypes. However, despite the high heritability of number of pods per plant observed, with direct effects on bean yield, Muthomi et al. (Reference Muthomi, Muimui and Kimani2011) suggested improvement of bean yields, via grain yield selection, due to large effects of the environment on pod number.
The marked difference in performances among parental germplasm across seasons and micro-sites (P < 0.05) was due to their inherent genetic differences and phenotypes (small and medium seed types, with prostrate bush types to aggressive climbing abilities in genotype, G2333) and micro-ecological differences such as temperatures, rainfall patterns and soil fertility levels. Climbing lines with resistance to several diseases are of interest because, if planted twice in a year at higher altitudes within East Africa, they have huge yield potentials of up to 5000 kg/ha (Blair et al., Reference Blair, Fregene, Beebe, Ceballos and Guimaraes2007).
Conclusions and recommendations
Polymorphic markers such as SSRs, widely distributed in the genome of common bean are consistent in germplasm characterisations, since the environment does not influence them and, are therefore, useful for assessing genetic divergence in populations and selection in breeding. The four CIAT breeding lines (G2333, MEXICO54, MCM5001 and MLB49-89A) selected for development of genetic pyramids had considerable levels of genetic variations for improving agronomic, yield traits and disease resistance. High trait heritability estimates estimated using four selected parents, implies that it is possible to develop superior common beans progeny lines combining disease resistance and desirable agronomic traits. The heritability estimates could be extended to other yield traits to enhance direct-selections of superior lines derived from this Mesoamerican bean population: starting in early generations such as at F2s and F3s to save breeding time and resources in future. Genotype by environment interactions influenced the number of flower buds, weight of 100 seeds and pods per plant, suggesting that instabilities in these traits needs to be considered in future multi-location evaluations of progenies developed from the germplasm in this study.
Future bean germplasm characterisations should consider sequencing the whole genomes of core collections for explicit groupings for use in current and future breeding programmes. Landraces, genetically related to breeding lines, need more evaluations as germplasm using screen houses and field experimentation for multiple tropical constraints.
Supplementary material
The supplementary material for this article can be found at https://doi.org/10.1017/S1479262117000259
Acknowledgement
The authors thank the HEST project under CIAT, Kawanda for funding components of this research and the Kirkhouse Trust (UK) for funding earlier laboratory experiments and field studies. We appreciate assistance from bean personnel at NaCRRI, Namulonge and CIAT, Uganda.