


1 Introduction
The impact of liquid droplets on a flat, solid surface is a subject of scientific interest due to the highly dynamic and complex nature of the impacting droplet structure. Research on such impacts support a range of disciplines within fluid mechanics as the physical parameters of Reynolds, Weber, capillary, Mach and Marangoni numbers can vary rapidly and spatially throughout the impinging drop (Haferl & Poulikakos Reference Haferl and Poulikakos2003; Šikalo, Tropea & Ganić Reference Šikalo, Tropea and Ganić2005; Philippi, Lagrée & Antkowiak Reference Philippi, Lagrée and Antkowiak2016; Wildeman et al. Reference Wildeman, Visser, Sun and Lohse2016; Gordillo, Sun & Cheng Reference Gordillo, Sun and Cheng2018). This diversity of physical phenomena renders the droplet impact problem a useful testing platform for a multitude of fields. Phenomena such as von Kármán vortices (Thoraval et al. Reference Thoraval, Takehara, Etoh, Popinet, Ray, Josserand, Zaleski and Thoroddsen2012), shock waves (Haller et al. Reference Haller, Poulikakos, Ventikos and Monkewitz2003), cavitation (Haller et al. Reference Haller, Ventikos, Poulikakos and Monkewitz2002), waves (Yarin & Weiss Reference Yarin and Weiss1995), jets (Weiss & Yarin Reference Weiss and Yarin1999), contact line motion (Haley & Miksis Reference Haley and Miksis1991), bloodstain patterns (Pizzola, Roth & De Forest Reference Pizzola, Roth and De Forest1986) and of course spreading and splashing (Josserand & Thoroddsen Reference Josserand and Thoroddsen2016) can be studied through droplet impacts. For typical millimetre-sized rain droplets most of these phenomena happen on the order of milliseconds making observations difficult for the human eye. Advancements in novel measurement technologies and high-speed cameras has, however, allowed these areas to be studied in detail, and are now widely growing areas of interest (Josserand & Thoroddsen Reference Josserand and Thoroddsen2016). The impact of a drop of water is a seemingly simple everyday occurrence but despite its growing attention, an accurate mathematical equation describing the entire force evolution does not yet exist. Technical applications must therefore rely on empirical data, simulations or assumptions to approximate the entire time-dependent loading.
Relative to applications, droplet impacts can erode steam and wind turbine blades (Ahmad, Schatz & Casey Reference Ahmad, Schatz and Casey2013; Amirzadeh et al.
Reference Amirzadeh, Louhghalam, Raessi and Tootkaboni2017), scour aircraft (Fyall Reference Fyall1966) and serve as a materials processing technique via high-speed
 $O(100)~\text{m}~\text{s}^{-1}$
, droplet train impingement (Dean et al.
Reference Dean, Nelson, Brown, Couch and Blanchard2008; Huang et al.
Reference Huang, Folkes, Kinnell and Shipway2012). In nature, droplet impacts can erode soil (Römkens, Helming & Prasad Reference Römkens, Helming and Prasad2002), compact snow (Marshall, Conway & Rasmussen Reference Marshall, Conway and Rasmussen1999), disrupt hummingbird and mosquito flight (Dickerson et al.
Reference Dickerson, Shankles, Madhavan and Hu2012; Ortega-Jimenez et al.
Reference Ortega-Jimenez, Badger, Wang and Dudley2016) and even damage the surfaces of leaves (Baker & Hunt Reference Baker and Hunt1986). In each case, the force–time history associated with the droplet impact is of considerable importance, since it characterises the time scale over which an object will experience the impact force and the resulting impulse (i.e. change in momentum). Similarly, in designing material processing applications, the force–time history is essential to characterise material erosion, since it provides an evolution of the time-dependent loading. This allows, for example, the calculation of stresses and strains experienced by the solid. Due to their rapid deformation and potentially destructive nature, high-speed droplet impacts are inherently difficult to image and pose significant measurement challenges. Therefore, in this study, we establish an appropriate scaling law that captures the dominant physics of low-speed droplet impacts, and, through this, provide a foundation for which the force–time profiles of high-speed impacts can be estimated. This is done by measuring droplet impact force–time profiles over a significant range of Reynolds and Weber numbers, then, using the data, along with existing theories, develop a model which accurately describes high Reynolds and Weber number impacts.
$O(100)~\text{m}~\text{s}^{-1}$
, droplet train impingement (Dean et al.
Reference Dean, Nelson, Brown, Couch and Blanchard2008; Huang et al.
Reference Huang, Folkes, Kinnell and Shipway2012). In nature, droplet impacts can erode soil (Römkens, Helming & Prasad Reference Römkens, Helming and Prasad2002), compact snow (Marshall, Conway & Rasmussen Reference Marshall, Conway and Rasmussen1999), disrupt hummingbird and mosquito flight (Dickerson et al.
Reference Dickerson, Shankles, Madhavan and Hu2012; Ortega-Jimenez et al.
Reference Ortega-Jimenez, Badger, Wang and Dudley2016) and even damage the surfaces of leaves (Baker & Hunt Reference Baker and Hunt1986). In each case, the force–time history associated with the droplet impact is of considerable importance, since it characterises the time scale over which an object will experience the impact force and the resulting impulse (i.e. change in momentum). Similarly, in designing material processing applications, the force–time history is essential to characterise material erosion, since it provides an evolution of the time-dependent loading. This allows, for example, the calculation of stresses and strains experienced by the solid. Due to their rapid deformation and potentially destructive nature, high-speed droplet impacts are inherently difficult to image and pose significant measurement challenges. Therefore, in this study, we establish an appropriate scaling law that captures the dominant physics of low-speed droplet impacts, and, through this, provide a foundation for which the force–time profiles of high-speed impacts can be estimated. This is done by measuring droplet impact force–time profiles over a significant range of Reynolds and Weber numbers, then, using the data, along with existing theories, develop a model which accurately describes high Reynolds and Weber number impacts.
Several experimental studies (e.g. Nearing, Bradford & Holtz (Reference Nearing, Bradford and Holtz1986), Grinspan & Gnanamoorthy (Reference Grinspan and Gnanamoorthy2010), Li et al. (Reference Li, Zhang, Guo and Lv2014), Zhang et al. (Reference Zhang, Li, Guo and Lv2017), Gordillo et al. (Reference Gordillo, Sun and Cheng2018), Yu & Hopkins (Reference Yu and Hopkins2018)), have investigated various aspects of the normal impingement of a water droplet onto a flat, rigid surface. Such measurements reveal that the impact force is characterised by a rapid rise to a maximum, followed by a much more gradual decay to zero force. As might be intuitively surmised, existing studies indicate that the peak force increases with increased droplet diameter,
 $d$
, liquid density,
$d$
, liquid density,
 $\unicode[STIX]{x1D70C}$
, and/or impact velocity,
$\unicode[STIX]{x1D70C}$
, and/or impact velocity,
 $v$
. Mitchell et al. (Reference Mitchell, Nassiri, Locke, Klewicki, Korkolis and Kinsey2016) found the force to scale as the square of impact velocity. The study by Li et al. (Reference Li, Zhang, Guo and Lv2014) found the time duration (total time in which a droplet imparts a normal force) decreases with impact velocity and increases with increased droplet diameter. In a similar study, Zhang et al. (Reference Zhang, Li, Guo and Lv2017) showed the droplet impact force–time profile is Reynolds number invariant above
$v$
. Mitchell et al. (Reference Mitchell, Nassiri, Locke, Klewicki, Korkolis and Kinsey2016) found the force to scale as the square of impact velocity. The study by Li et al. (Reference Li, Zhang, Guo and Lv2014) found the time duration (total time in which a droplet imparts a normal force) decreases with impact velocity and increases with increased droplet diameter. In a similar study, Zhang et al. (Reference Zhang, Li, Guo and Lv2017) showed the droplet impact force–time profile is Reynolds number invariant above
 $Re=230$
, as only the inertial parameters (i.e.
$Re=230$
, as only the inertial parameters (i.e.
 $\unicode[STIX]{x1D70C}$
,
$\unicode[STIX]{x1D70C}$
,
 $v$
and
$v$
and
 $d$
) affect the profile. Here, the Reynolds and Weber numbers are respectively given by
$d$
) affect the profile. Here, the Reynolds and Weber numbers are respectively given by
 $Re=\unicode[STIX]{x1D70C}vd/\unicode[STIX]{x1D707}$
, and
$Re=\unicode[STIX]{x1D70C}vd/\unicode[STIX]{x1D707}$
, and
 $We=\unicode[STIX]{x1D70C}v^{2}d/\unicode[STIX]{x1D70E}$
, where
$We=\unicode[STIX]{x1D70C}v^{2}d/\unicode[STIX]{x1D70E}$
, where
 $\unicode[STIX]{x1D707}$
and
$\unicode[STIX]{x1D707}$
and
 $\unicode[STIX]{x1D70E}$
are the liquid’s viscosity and surface tension, respectively. Conversely, as the Reynolds number decreases, below
$\unicode[STIX]{x1D70E}$
are the liquid’s viscosity and surface tension, respectively. Conversely, as the Reynolds number decreases, below
 $Re=230$
, viscosity plays a more dominant role. Specifically, the normalised peak force increases while the normalised time duration decreases. In this impact regime, viscosity impedes droplet spreading, and as shown later in this paper, promotes a faster deceleration of the drop, altering the inertial force profile.
$Re=230$
, viscosity plays a more dominant role. Specifically, the normalised peak force increases while the normalised time duration decreases. In this impact regime, viscosity impedes droplet spreading, and as shown later in this paper, promotes a faster deceleration of the drop, altering the inertial force profile.
In the extensive study of Gordillo et al. (Reference Gordillo, Sun and Cheng2018), the force profiles in a Reynolds number range of approximately
 $10^{-1}<Re<10^{4}$
were measured, resulting in the discovery of visco-elastic, viscous and inertial regimes. In the visco-elastic regime (
$10^{-1}<Re<10^{4}$
were measured, resulting in the discovery of visco-elastic, viscous and inertial regimes. In the visco-elastic regime (
 $Re<0.7$
), the force–time profile is nearly symmetric about the maximum force, corresponding to an elastic sphere impact. After this stage, a negative force is imparted, relating to a rebound effect. In the viscous regime, which occurs in the range of approximately
$Re<0.7$
), the force–time profile is nearly symmetric about the maximum force, corresponding to an elastic sphere impact. After this stage, a negative force is imparted, relating to a rebound effect. In the viscous regime, which occurs in the range of approximately
 $0.7<Re<200$
, Gordillo et al. (Reference Gordillo, Sun and Cheng2018) found the early pre-peak force to scale as
$0.7<Re<200$
, Gordillo et al. (Reference Gordillo, Sun and Cheng2018) found the early pre-peak force to scale as
 $1/\sqrt{Re}$
. They provide a formal justification for this scaling law using the boundary layer thickness (found in Roisman (Reference Roisman2009)), with a perturbation expansion from the inviscid solution based on Philippi et al. (Reference Philippi, Lagrée and Antkowiak2016). The approximate solution predicts a
$1/\sqrt{Re}$
. They provide a formal justification for this scaling law using the boundary layer thickness (found in Roisman (Reference Roisman2009)), with a perturbation expansion from the inviscid solution based on Philippi et al. (Reference Philippi, Lagrée and Antkowiak2016). The approximate solution predicts a
 $1/\sqrt{Re}$
scaling, good to order (
$1/\sqrt{Re}$
scaling, good to order (
 $Re^{-1}$
), and is supported by their experiments. In the inertial regime, Gordillo et al. (Reference Gordillo, Sun and Cheng2018) found self-similarity of all measured force profiles above
$Re^{-1}$
), and is supported by their experiments. In the inertial regime, Gordillo et al. (Reference Gordillo, Sun and Cheng2018) found self-similarity of all measured force profiles above
 $Re>200$
. Here, the peak force is found to equal
$Re>200$
. Here, the peak force is found to equal
 ${\sim}0.85\unicode[STIX]{x1D70C}v^{2}d^{2}$
. In addition, Gordillo et al. (Reference Gordillo, Sun and Cheng2018) experimentally verify the early time,
${\sim}0.85\unicode[STIX]{x1D70C}v^{2}d^{2}$
. In addition, Gordillo et al. (Reference Gordillo, Sun and Cheng2018) experimentally verify the early time,
 $\sqrt{t}$
force dependence, theoretically determined by Philippi et al. (Reference Philippi, Lagrée and Antkowiak2016). The present experimental results, which were historically compiled over the same time frame, reinforce this finding. During the initial pre-peak rise in force, Philippi et al. (Reference Philippi, Lagrée and Antkowiak2016) has shown that the velocity and pressure fields adhere to a self-similar form and in addition, predict the normal impact force to grow in time like
$\sqrt{t}$
force dependence, theoretically determined by Philippi et al. (Reference Philippi, Lagrée and Antkowiak2016). The present experimental results, which were historically compiled over the same time frame, reinforce this finding. During the initial pre-peak rise in force, Philippi et al. (Reference Philippi, Lagrée and Antkowiak2016) has shown that the velocity and pressure fields adhere to a self-similar form and in addition, predict the normal impact force to grow in time like
 $\sqrt{t}$
, namely:
$\sqrt{t}$
, namely:
 $$\begin{eqnarray}\displaystyle F(t)=\sqrt{27/2}\unicode[STIX]{x1D70C}d^{3/2}v^{5/2}\sqrt{t}. & & \displaystyle\end{eqnarray}$$
This equation accurately predicts the impact force of inertial (i.e. high
 $Re$
, high
$Re$
, high
 $We$
), droplet impacts for early stages of impact, before peak force, as shown by Gordillo et al. (Reference Gordillo, Sun and Cheng2018). In their study, they found the peak force to occur at a normalised time of about
$We$
), droplet impacts for early stages of impact, before peak force, as shown by Gordillo et al. (Reference Gordillo, Sun and Cheng2018). In their study, they found the peak force to occur at a normalised time of about
 $\hat{t}=0.18$
, where
$\hat{t}=0.18$
, where
 $\hat{t}=vt/d$
. Just before peak force, however, equation (1.1) diverges from the measurements and, thus, is only applicable for early time (i.e.
$\hat{t}=vt/d$
. Just before peak force, however, equation (1.1) diverges from the measurements and, thus, is only applicable for early time (i.e.
 $\hat{t}\lesssim 0.1$
).
$\hat{t}\lesssim 0.1$
).
Other theoretical and numerical works on droplet impacts have been performed by Josserand & Zaleski (Reference Josserand and Zaleski2003) and Eggers et al. (Reference Eggers, Fontelos, Josserand and Zaleski2010), who collectively show that the centre pressure of an impacting droplet obeys a
 $1/\sqrt{t}$
dependence, for early stages of deformation (up to approximately
$1/\sqrt{t}$
dependence, for early stages of deformation (up to approximately
 $\hat{t}=0.5$
). A subsequent rapid pressure decay commences thereafter. The
$\hat{t}=0.5$
). A subsequent rapid pressure decay commences thereafter. The
 $1/\sqrt{t}$
pressure dependence at the impact point is in agreement with the study of Philippi et al. (Reference Philippi, Lagrée and Antkowiak2016), while the long-time pressure decay observed in the simulations awaits further theoretical evaluation. Roisman, Berberović & Tropea (Reference Roisman, Berberović and Tropea2009) also investigated the impact pressure. Here, the authors used the volume-of-fluid method to simulate the normal impingement of inertia-dominated droplets onto a rigid surface. For times of the order of
$1/\sqrt{t}$
pressure dependence at the impact point is in agreement with the study of Philippi et al. (Reference Philippi, Lagrée and Antkowiak2016), while the long-time pressure decay observed in the simulations awaits further theoretical evaluation. Roisman, Berberović & Tropea (Reference Roisman, Berberović and Tropea2009) also investigated the impact pressure. Here, the authors used the volume-of-fluid method to simulate the normal impingement of inertia-dominated droplets onto a rigid surface. For times of the order of
 $\hat{t}=1$
, the results show the central pressure at the impact surface decays monotonically in time and is well approximated with an exponential of the form:
$\hat{t}=1$
, the results show the central pressure at the impact surface decays monotonically in time and is well approximated with an exponential of the form:
 $\text{e}^{-\hat{t}}$
. Although the droplet impact force is not explicitly calculated in Roisman et al. (Reference Roisman, Berberović and Tropea2009), this form of pressure can be multiplied by the drop’s contact area to obtain a force approximation. Such a calculation was done by Yu & Hopkins (Reference Yu and Hopkins2018) using the contact area of a spherical cap. The resulting force equation underestimates the measured force profiles. The equation does, however, follow the profile trends (i.e. sharp rise to maximum force followed by a gradual decay to zero). To provide a more suitable match, Yu & Hopkins (Reference Yu and Hopkins2018) use an empirical equation based on an exponential-like decay. Although theoretical support is needed for the exponential decay, the use of it to describe the post-peak decay observed in experiments is quite appealing.
$\text{e}^{-\hat{t}}$
. Although the droplet impact force is not explicitly calculated in Roisman et al. (Reference Roisman, Berberović and Tropea2009), this form of pressure can be multiplied by the drop’s contact area to obtain a force approximation. Such a calculation was done by Yu & Hopkins (Reference Yu and Hopkins2018) using the contact area of a spherical cap. The resulting force equation underestimates the measured force profiles. The equation does, however, follow the profile trends (i.e. sharp rise to maximum force followed by a gradual decay to zero). To provide a more suitable match, Yu & Hopkins (Reference Yu and Hopkins2018) use an empirical equation based on an exponential-like decay. Although theoretical support is needed for the exponential decay, the use of it to describe the post-peak decay observed in experiments is quite appealing.
The force evolution at early times, first derived by Philippi et al. (Reference Philippi, Lagrée and Antkowiak2016) in (1.1), has been verified by Gordillo et al. (Reference Gordillo, Sun and Cheng2018), and is also supported by the present experiments. Since the early-time force evolution has credible establishment both theoretically and experimentally, a complementary aim of this paper is to provide justification for the use of an exponential of the form,
 $\text{e}^{-t}$
, to describe the post-peak decay. From this, we develop a model equation that accurately represents the entire force evolution of inertial droplet impacts, suitable for easy use in applications. This model includes the early-time
$\text{e}^{-t}$
, to describe the post-peak decay. From this, we develop a model equation that accurately represents the entire force evolution of inertial droplet impacts, suitable for easy use in applications. This model includes the early-time
 $\sqrt{t}$
force dependence of Philippi et al. (Reference Philippi, Lagrée and Antkowiak2016) and the observed exponential post-peak decay. In addition, we show that the force decay can be predicted solely by the free-surface height evolution. In this alternative method, direct force measurements are not required. Instead, the free-surface height evolution is used to calculate the impact force decay, and the ensuing results are shown to be in good agreement with direct force measurements.
$\sqrt{t}$
force dependence of Philippi et al. (Reference Philippi, Lagrée and Antkowiak2016) and the observed exponential post-peak decay. In addition, we show that the force decay can be predicted solely by the free-surface height evolution. In this alternative method, direct force measurements are not required. Instead, the free-surface height evolution is used to calculate the impact force decay, and the ensuing results are shown to be in good agreement with direct force measurements.
The present experiments cover a range of Reynolds and Weber numbers of four and two decades, respectively. This is done by varying the liquid density,
 $\unicode[STIX]{x1D70C}$
, droplet diameter,
$\unicode[STIX]{x1D70C}$
, droplet diameter,
 $d$
, impact velocity,
$d$
, impact velocity,
 $v$
, fluid viscosity,
$v$
, fluid viscosity,
 $\unicode[STIX]{x1D707}$
, and surface tension,
$\unicode[STIX]{x1D707}$
, and surface tension,
 $\unicode[STIX]{x1D70E}$
. Another important aspect of describing the physics involves controlling the shape of the droplet upon impact. A non-spherical droplet exerts a force–time profile that is different from a spherical droplet. This is due to variations in free-surface curvature, which result in variations in the duration of momentum transfer to the surface. For example, the present measurements show that, relative to a spherical droplet, oblate droplets correlate with shorter momentum transfer times, while prolate droplets correlate with longer momentum transfer times. This observation is reinforced by the recently reported findings of Yu & Hopkins (Reference Yu and Hopkins2018). Such variations add undesirable complexity to the force–time profiles. Because of this, the present study restricts attention to droplets that are spherical to within a well-defined tolerance. This aim is accomplished by performing the experiments under sufficiently low ambient air pressure conditions, and thus avoiding the deviation from a spherical shape that occurs when significant drag is imparted by the surrounding gas (Clift, Grace and Weber Reference Clift, Grace and Weber1978). For example, in standard atmospheric pressure (101 kPa), a 3.5 mm diameter water droplet falling at its terminal velocity, of approximately
$\unicode[STIX]{x1D70E}$
. Another important aspect of describing the physics involves controlling the shape of the droplet upon impact. A non-spherical droplet exerts a force–time profile that is different from a spherical droplet. This is due to variations in free-surface curvature, which result in variations in the duration of momentum transfer to the surface. For example, the present measurements show that, relative to a spherical droplet, oblate droplets correlate with shorter momentum transfer times, while prolate droplets correlate with longer momentum transfer times. This observation is reinforced by the recently reported findings of Yu & Hopkins (Reference Yu and Hopkins2018). Such variations add undesirable complexity to the force–time profiles. Because of this, the present study restricts attention to droplets that are spherical to within a well-defined tolerance. This aim is accomplished by performing the experiments under sufficiently low ambient air pressure conditions, and thus avoiding the deviation from a spherical shape that occurs when significant drag is imparted by the surrounding gas (Clift, Grace and Weber Reference Clift, Grace and Weber1978). For example, in standard atmospheric pressure (101 kPa), a 3.5 mm diameter water droplet falling at its terminal velocity, of approximately
 $8~\text{m}~\text{s}^{-1}$
, has an aspect ratio,
$8~\text{m}~\text{s}^{-1}$
, has an aspect ratio,
 $e$
(defined later), of approximately 0.8 (Beard Reference Beard1976; Szakáll et al.
Reference Szakáll, Mitra, Diehl and Borrmann2010).
$e$
(defined later), of approximately 0.8 (Beard Reference Beard1976; Szakáll et al.
Reference Szakáll, Mitra, Diehl and Borrmann2010).

Figure 1. Experimental apparatus, (a) schematic, and (b) image.
In what follows, this paper first describes the experimental procedures and the range of parameters explored. This is followed by a presentation of the experimental results from which we determine the parameter thresholds for which self-similar, force–time scaling exists. With this, we then construct a model equation for the entire force profile. The paper concludes with a brief discussion of the primary experimental observations and the physics contained in the present model.
2 Description of experiments
The present experiments employ a custom-made apparatus that releases consistently sized droplets in a sub-atmospheric environment, see figure 1. This apparatus features a 380 mm
 $\times$
380 mm
$\times$
380 mm
 $\times$
500 mm vacuum chamber, consisting of an aluminium frame enclosed by polycarbonate windows. An Edwards E2M30 vacuum pump is used to reduce the air pressure in the vacuum chamber, while an MKS 902 piezo-transducer measures the ambient pressure inside the chamber with a resolution of 0.013 kPa (0.1 torr). For all tests, the absolute air pressure in the chamber is
$\times$
500 mm vacuum chamber, consisting of an aluminium frame enclosed by polycarbonate windows. An Edwards E2M30 vacuum pump is used to reduce the air pressure in the vacuum chamber, while an MKS 902 piezo-transducer measures the ambient pressure inside the chamber with a resolution of 0.013 kPa (0.1 torr). For all tests, the absolute air pressure in the chamber is
 $12+/-0.4~\text{kPa}$
. The leak rate of the vacuum chamber at 12 kPa is approximately
$12+/-0.4~\text{kPa}$
. The leak rate of the vacuum chamber at 12 kPa is approximately
 $0.006~\text{kPa}~\text{s}^{-1}$
. During each trial, which takes a matter of seconds, the vacuum pump is turned off so that vibrations are reduced.
$0.006~\text{kPa}~\text{s}^{-1}$
. During each trial, which takes a matter of seconds, the vacuum pump is turned off so that vibrations are reduced.
A syringe with a double-gland, gas-tight piston expels droplets from a needle attached to its base, with the droplet subsequently falling onto the force sensor directly below. A stepper-motor controls the position of the piston, allowing precise dosimetry. Various lengths of polyvinyl chloride pipes, outfitted with o-rings and sealed to the vacuum chamber and syringe, allow for significant variations in the drop height,
 $H$
(see figure 1). Minor adjustments to
$H$
(see figure 1). Minor adjustments to
 $H$
are accomplished by using variable thickness steel plates underneath the force sensor. The values of
$H$
are accomplished by using variable thickness steel plates underneath the force sensor. The values of
 $H$
in the present study resulted in impact velocities between 1.2 and
$H$
in the present study resulted in impact velocities between 1.2 and
 $6.4~\text{m}~\text{s}^{-1}$
, as detailed in the next section. Stainless steel needles attached to the syringe, generate droplet diameters between 1.7 and 5.1 mm. Three different liquids (ethanol, distilled water and glycerin) are used to vary the viscosity, density and surface tension of the impacting droplet, while in a temperature controlled room of
$6.4~\text{m}~\text{s}^{-1}$
, as detailed in the next section. Stainless steel needles attached to the syringe, generate droplet diameters between 1.7 and 5.1 mm. Three different liquids (ethanol, distilled water and glycerin) are used to vary the viscosity, density and surface tension of the impacting droplet, while in a temperature controlled room of
 $20\,^{\circ }\text{C}$
. The ethanol used is 200 proof ethyl alcohol manufactured by PHARMCO-AAPER, and the glycerin is 99 % natural glycerin manufactured by PIT Process Chemicals Inc. Furthermore, glycerin and distilled water are mixed at various proportions, to create liquids with properties between those of the pure substances. The material properties of the liquids used in the present experiments are listed in table 1 (Association 1963; Trefethen Reference Trefethen1969; Dorf Reference Dorf2004).
$20\,^{\circ }\text{C}$
. The ethanol used is 200 proof ethyl alcohol manufactured by PHARMCO-AAPER, and the glycerin is 99 % natural glycerin manufactured by PIT Process Chemicals Inc. Furthermore, glycerin and distilled water are mixed at various proportions, to create liquids with properties between those of the pure substances. The material properties of the liquids used in the present experiments are listed in table 1 (Association 1963; Trefethen Reference Trefethen1969; Dorf Reference Dorf2004).
A PCB model 209C11 piezo-electric force sensor with a calibrated sensitivity of
 $524.3~\text{mV}~\text{N}^{-1}$
is located at the base of the vacuum chamber and is the target of the falling droplets. The impact surface is a polished 6061 aluminium cap with a surface roughness of
$524.3~\text{mV}~\text{N}^{-1}$
is located at the base of the vacuum chamber and is the target of the falling droplets. The impact surface is a polished 6061 aluminium cap with a surface roughness of
 $Ra=0.09~\unicode[STIX]{x03BC}\text{m}$
(measured with a Mitutoyo SJ-400). A PCB 482 signal conditioner provides the excitation voltage to the sensor and a Lecroy Wavesurfer 64MXs-B oscilloscope sampling at 5 MHz is used to acquire the force–time measurements.
$Ra=0.09~\unicode[STIX]{x03BC}\text{m}$
(measured with a Mitutoyo SJ-400). A PCB 482 signal conditioner provides the excitation voltage to the sensor and a Lecroy Wavesurfer 64MXs-B oscilloscope sampling at 5 MHz is used to acquire the force–time measurements.
Table 1. Material properties of the liquids employed.

Droplet diameter prior to impact, impact velocity and post-impact deformation are determined from the analysis of high-speed camera images, obtained with a Photron Fastcam SA4 high-speed camera operating at 13 500 fps with an exposure time of
 $62~\unicode[STIX]{x03BC}\text{s}$
. All droplet impacts are recorded at this frame rate with the exception of images shown in figure 2, which are recorded at 10 000 fps. A Northstar 250 W light is used to back illuminate the droplets, while a 105 mm Nikkor lens with a 49 mm extension tube is used to magnify the droplet images. The high-speed images reveal that, for the given range of liquids and droplet sizes, the 12 kPa ambient air pressure sufficiently inhibits the air-drag-induced droplet distortion, while remaining well above the vapour pressure of the liquids used.
$62~\unicode[STIX]{x03BC}\text{s}$
. All droplet impacts are recorded at this frame rate with the exception of images shown in figure 2, which are recorded at 10 000 fps. A Northstar 250 W light is used to back illuminate the droplets, while a 105 mm Nikkor lens with a 49 mm extension tube is used to magnify the droplet images. The high-speed images reveal that, for the given range of liquids and droplet sizes, the 12 kPa ambient air pressure sufficiently inhibits the air-drag-induced droplet distortion, while remaining well above the vapour pressure of the liquids used.
A position-tracking software was developed to determine the impact velocity and droplet diameter. The software utilises a cross-correlation algorithm that determines the physical displacement of a droplet between two consecutive images. Dividing the physical displacement by the time between consecutive images provides an estimate for the droplet velocity. In all experiments the calculated velocity is within 5 % of the theoretical velocity (assuming no air drag),
 $v=\sqrt{2gH}$
, where
$v=\sqrt{2gH}$
, where
 $g$
is the acceleration due to gravity.
$g$
is the acceleration due to gravity.
A distortion criterion is developed to ascertain if any given droplet deviates unacceptably from a spherical shape during it’s free fall. Distortion is quantified by the aspect ratio,
 $e$
, i.e. the ratio between the length projected onto the axis of symmetry,
$e$
, i.e. the ratio between the length projected onto the axis of symmetry,
 $d_{1}$
, to the maximum diameter perpendicular to the axis of symmetry
$d_{1}$
, to the maximum diameter perpendicular to the axis of symmetry
 $d_{2}$
,
$d_{2}$
,
 $e=d_{1}/d_{2}$
. In this study, only droplet impacts for which
$e=d_{1}/d_{2}$
. In this study, only droplet impacts for which
 $0.95\leqslant e\leqslant 1$
are considered. All droplets exhibited a slightly oblate ellipsoidal shape,
$0.95\leqslant e\leqslant 1$
are considered. All droplets exhibited a slightly oblate ellipsoidal shape,
 $e<1$
, upon impact. This is consistent with the droplets being subject to the initial stages of air drag (Taylor & Acrivos Reference Taylor and Acrivos1964), albeit small, owing to the reduced pressure environment. The quantities
$e<1$
, upon impact. This is consistent with the droplets being subject to the initial stages of air drag (Taylor & Acrivos Reference Taylor and Acrivos1964), albeit small, owing to the reduced pressure environment. The quantities
 $d_{1}$
and
$d_{1}$
and
 $d_{2}$
are determined from the ellipsoidal droplet images by an ellipse-fitting software. These quantities are also used to determine the equivalent droplet diameter,
$d_{2}$
are determined from the ellipsoidal droplet images by an ellipse-fitting software. These quantities are also used to determine the equivalent droplet diameter,
 $d=(d_{1}d_{2}^{2})^{1/3}$
, which is the diameter of a spherical droplet whose volume equals the volume of the ellipsoidal droplet. In order to validate the ellipse-fitting software, the equivalent droplet diameters,
$d=(d_{1}d_{2}^{2})^{1/3}$
, which is the diameter of a spherical droplet whose volume equals the volume of the ellipsoidal droplet. In order to validate the ellipse-fitting software, the equivalent droplet diameters,
 $d$
, are compared to droplet diameters calculated from the measured droplet mass
$d$
, are compared to droplet diameters calculated from the measured droplet mass
 $d_{m}=(6m/\unicode[STIX]{x03C0}\unicode[STIX]{x1D70C})^{1/3}$
, where
$d_{m}=(6m/\unicode[STIX]{x03C0}\unicode[STIX]{x1D70C})^{1/3}$
, where
 $\unicode[STIX]{x1D70C}$
is the density and
$\unicode[STIX]{x1D70C}$
is the density and
 $m$
is the droplet mass. For test conditions 2, 9 and 11, the mass of 10 consecutive droplets are measured with a Mettler-Toledo MX5 scale having
$m$
is the droplet mass. For test conditions 2, 9 and 11, the mass of 10 consecutive droplets are measured with a Mettler-Toledo MX5 scale having
 $1~\unicode[STIX]{x03BC}\text{g}$
precision. The droplets from these test conditions have large, small and medium diameters, respectively. The average mass of each trial set is determined, and used as
$1~\unicode[STIX]{x03BC}\text{g}$
precision. The droplets from these test conditions have large, small and medium diameters, respectively. The average mass of each trial set is determined, and used as
 $m$
to determine
$m$
to determine
 $d_{m}$
. This is then compared to the equivalent droplet diameter
$d_{m}$
. This is then compared to the equivalent droplet diameter
 $d$
, in which case the equivalent droplet diameters are within 3 % of their
$d$
, in which case the equivalent droplet diameters are within 3 % of their
 $d_{m}$
counterparts.
$d_{m}$
counterparts.

Figure 2. High-speed images of a 2.9 mm diameter water droplet impacting at
 $2.1~\text{m}~\text{s}^{-1}$
, (
$2.1~\text{m}~\text{s}^{-1}$
, (
 $Re=5960$
,
$Re=5960$
,
 $We=170$
). The time between images is
$We=170$
). The time between images is
 $100~\unicode[STIX]{x03BC}\text{s}$
(normalised time of
$100~\unicode[STIX]{x03BC}\text{s}$
(normalised time of
 $\hat{t}=tv/d=0.07$
). The progression of images start from the top left side, proceed downwards then to the right.
$\hat{t}=tv/d=0.07$
). The progression of images start from the top left side, proceed downwards then to the right.
For all of the present experiments, low-amplitude, high-frequency oscillations are found to be superimposed onto the measured force profile. These oscillations stem from the vibration of the measurement system caused by the droplet impact. The oscillations are spectrally removed from the dataset using a method similar to that employed by Li et al. (Reference Li, Zhang, Guo and Lv2014). The oscillation amplitude decreases with increased time and is, therefore, greatest at the beginning. For each test condition (listed in table 2), five trials are performed, to verify repeatability. After droplet impact, the chamber is returned to atmospheric pressure, the door opened, and the impact plate wiped clean, in preparation for the next trial.
3 Results
In this section we first introduce the stages of droplet deformation, followed by force profile measurement results. We then show that peak force occurs when the droplet side walls are perpendicular to the impact plate – a consequence of maximum momentum redirection. The normalised profiles are subsequently presented and compared with previous findings. This subsection also shows two distinct impact regimes (i) a self-similar inertial, and (ii) a viscous regime. Next we discuss the impulse and change in momentum due to droplet impact, as well as how viscosity affects the free-surface configuration at peak force. Finally, the long-time behaviour of inertial profiles are investigated and are shown to be well approximated by an exponential decay law.
3.1 Stages of deformation
Figure 2 shows the stages of droplet deformation for a 2.9 mm diameter water droplet impacting at
 $2.1~\text{m}~\text{s}^{-1}$
. The time between successive images is
$2.1~\text{m}~\text{s}^{-1}$
. The time between successive images is
 $100~\unicode[STIX]{x03BC}\text{s}$
(normalised time of
$100~\unicode[STIX]{x03BC}\text{s}$
(normalised time of
 $\hat{t}=0.07$
). The images are taken at 10 000 fps with an exposure time of
$\hat{t}=0.07$
). The images are taken at 10 000 fps with an exposure time of
 $25~\unicode[STIX]{x03BC}\text{s}$
. During the early stages of deformation the droplet resembles a truncated sphere with a thin liquid jet circumscribing the initial point of contact. The thin liquid jet, or lamella, advances parallel to the surface and radially away from the impact centre. As the droplet deforms, liquid from the bulk travels to the spreading lamella and momentum is redirected from the normal to surface-parallel direction. This redirection of momentum induces the applied force at the surface. Specifically, the normal force acting on the plate is equal to the rate at which the total momentum within the collapsing droplet, normal to the plate, changes with time. The later stages of deformation exhibit a rippling effect in the lamella due to capillary instabilities about the advancing contact line (Thoroddsen & Sakakibara Reference Thoroddsen and Sakakibara1998). The liquid ceases further radial advancement, as surface tension forces retract the lamella and contact line back toward the initial point of contact (not shown). The liquid then oscillates several times, although no clear normal force variations are observed during this stage.
$25~\unicode[STIX]{x03BC}\text{s}$
. During the early stages of deformation the droplet resembles a truncated sphere with a thin liquid jet circumscribing the initial point of contact. The thin liquid jet, or lamella, advances parallel to the surface and radially away from the impact centre. As the droplet deforms, liquid from the bulk travels to the spreading lamella and momentum is redirected from the normal to surface-parallel direction. This redirection of momentum induces the applied force at the surface. Specifically, the normal force acting on the plate is equal to the rate at which the total momentum within the collapsing droplet, normal to the plate, changes with time. The later stages of deformation exhibit a rippling effect in the lamella due to capillary instabilities about the advancing contact line (Thoroddsen & Sakakibara Reference Thoroddsen and Sakakibara1998). The liquid ceases further radial advancement, as surface tension forces retract the lamella and contact line back toward the initial point of contact (not shown). The liquid then oscillates several times, although no clear normal force variations are observed during this stage.
Table 2. Test conditions of the present experiments.

3.2 Force profiles
Ensembles of the force profiles were generated as previously described, covering the 14 separate test conditions listed in table 2. These experiments span Reynolds and Weber number ranges of
 $10\leqslant Re\leqslant 29\,800$
and
$10\leqslant Re\leqslant 29\,800$
and
 $37\leqslant We\leqslant 6360$
, respectively. The force profiles for test condition 11 are shown in figure 3. These results exemplify the typical force profile of a spherical droplet impinging normal to a flat rigid surface. As expected, the force increases rapidly, rising to a maximum of about 55 mN at approximately
$37\leqslant We\leqslant 6360$
, respectively. The force profiles for test condition 11 are shown in figure 3. These results exemplify the typical force profile of a spherical droplet impinging normal to a flat rigid surface. As expected, the force increases rapidly, rising to a maximum of about 55 mN at approximately
 $160~\unicode[STIX]{x03BC}\text{s}$
after initial impact, and then gradually returns to zero. The time duration is approximately 2 ms. Note that figure 3(a) plots 5 trials, and thus provides an indication of experiment-to-experiment repeatability. The reduced ambient pressure helps facilitate impact location repeatability. In contrast, as the impact velocity increases, droplets travelling within standard atmospheric pressure rarely hit the same spot owing to the unsteady wakes that form behind them (Saylor & Jones Reference Saylor and Jones2005). Additionally, figure 3(a) compares the experiments with the analytically derived, pre-peak rise in normal force given by Philippi et al. (Reference Philippi, Lagrée and Antkowiak2016). As shown, the initial rise in force compares well with (1.1), but quickly diverges after
$160~\unicode[STIX]{x03BC}\text{s}$
after initial impact, and then gradually returns to zero. The time duration is approximately 2 ms. Note that figure 3(a) plots 5 trials, and thus provides an indication of experiment-to-experiment repeatability. The reduced ambient pressure helps facilitate impact location repeatability. In contrast, as the impact velocity increases, droplets travelling within standard atmospheric pressure rarely hit the same spot owing to the unsteady wakes that form behind them (Saylor & Jones Reference Saylor and Jones2005). Additionally, figure 3(a) compares the experiments with the analytically derived, pre-peak rise in normal force given by Philippi et al. (Reference Philippi, Lagrée and Antkowiak2016). As shown, the initial rise in force compares well with (1.1), but quickly diverges after
 $50~\unicode[STIX]{x03BC}\text{s}$
. We note that droplet splashing is suppressed in the reduced pressure environment – a result found previously (Xu, Zhang & Nagel Reference Xu, Zhang and Nagel2005). It has been shown that a splashing droplet impact exerts approximately the same force as a non-splashing droplet impact (Mitchell et al.
Reference Mitchell, Bate, Klewicki, Korkolis and Kinsey2017).
$50~\unicode[STIX]{x03BC}\text{s}$
. We note that droplet splashing is suppressed in the reduced pressure environment – a result found previously (Xu, Zhang & Nagel Reference Xu, Zhang and Nagel2005). It has been shown that a splashing droplet impact exerts approximately the same force as a non-splashing droplet impact (Mitchell et al.
Reference Mitchell, Bate, Klewicki, Korkolis and Kinsey2017).

Figure 3. (a) Measured force profiles for the five trials of test condition 11 and (b) their ensemble-averaged (blue) and filtered non-dimensional force profile (orange). Insets show the initial rise and peak force compared with the analytical force (black) from Philippi et al. (Reference Philippi, Lagrée and Antkowiak2016). The peak force occurs at approximately
 $t=0.15d/v$
, shown with a black dashed line.
$t=0.15d/v$
, shown with a black dashed line.
Together, the force measurements and high-speed images illustrate the interplay between the deformed droplet shape and its corresponding force. During the initial deformation, but before peak force, the droplet closely resembles a truncated sphere, surrounded by its radial lamella. During this stage there is a rapid increase in normal force due to the sudden redirection of flow that drives the expanding lamella. The liquid in the spreading lamella does not contribute to a significant normal force, but instead, induces a drag force due to the viscous boundary layer at the solid/liquid interface (Roisman Reference Roisman2009). During the initial pre-peak rise the upper portion of the droplet does not yet experience the effects of the impact surface and continues to travel towards the surface with its initial impact velocity,
 $v$
. Within the small region about the impact plane, however, the liquid rapidly decelerates and adheres to upward expanding self-similar pressure and velocity fields (Philippi et al.
Reference Philippi, Lagrée and Antkowiak2016). At this time, the impact-induced flow drives a tank-treading-like motion of the contact line, where the maximum pressure exists. This is a rather counterintuitive result as the maximum pressure does not occur at the central stagnation point, but rather near the expanding contact line (Philippi et al.
Reference Philippi, Lagrée and Antkowiak2016). By the time of peak force the droplet closely resembles a dome with sides walls that are perpendicular with respect to the impact plane, see figure 2. Peak force occurs at a normalised time of approximately
$v$
. Within the small region about the impact plane, however, the liquid rapidly decelerates and adheres to upward expanding self-similar pressure and velocity fields (Philippi et al.
Reference Philippi, Lagrée and Antkowiak2016). At this time, the impact-induced flow drives a tank-treading-like motion of the contact line, where the maximum pressure exists. This is a rather counterintuitive result as the maximum pressure does not occur at the central stagnation point, but rather near the expanding contact line (Philippi et al.
Reference Philippi, Lagrée and Antkowiak2016). By the time of peak force the droplet closely resembles a dome with sides walls that are perpendicular with respect to the impact plane, see figure 2. Peak force occurs at a normalised time of approximately
 $\hat{t}=0.15$
. In terms of the entire duration of normal force (
$\hat{t}=0.15$
. In terms of the entire duration of normal force (
 $\hat{t}\cong 2.0$
), the peak force is rapidly attained, within the first 10 % of normalised time duration.
$\hat{t}\cong 2.0$
), the peak force is rapidly attained, within the first 10 % of normalised time duration.
3.3 Peak force
There are currently no theories that explain why the deformed droplet exhibits vertical side walls at the time of peak force. It can be intuitively surmised, however, that at this time the largest amount of wall-normal momentum is projected onto the impact plane leading to the largest normal force. Consider the deformed droplet configuration before peak force, if the lamella is neglected, the droplet side walls near the base are curved inward and the area projected onto the surface is less than the area of a circle with diameter,
 $d$
, see figure 2. At peak force, the side walls are perpendicular to the plate and the area projected onto the surface has an area equal to that of a circle with diameter,
$d$
, see figure 2. At peak force, the side walls are perpendicular to the plate and the area projected onto the surface has an area equal to that of a circle with diameter,
 $d$
. At this time the momentum within the bulk droplet is purely in the direction normal to the plate. The largest amount of momentum, normal to the plate, occurs at this instant, and from this, it can be reasoned that the largest normal force occurs at this time. After peak force, the projected area is larger, but despite this, the momentum in the bulk has components in the radial direction, as indicated by the radially expanding free surface. Consequently, less momentum is directed in the plate-normal direction, and the impact force drops correspondingly. During this time (
$d$
. At this time the momentum within the bulk droplet is purely in the direction normal to the plate. The largest amount of momentum, normal to the plate, occurs at this instant, and from this, it can be reasoned that the largest normal force occurs at this time. After peak force, the projected area is larger, but despite this, the momentum in the bulk has components in the radial direction, as indicated by the radially expanding free surface. Consequently, less momentum is directed in the plate-normal direction, and the impact force drops correspondingly. During this time (
 $\hat{t}>0.15$
), the upper free surface melds into the spreading lamella, see figure 2. This decay stage is much longer than the pre-peak rise. In terms of the total time duration, the majority of the induced force occurs during the decay.
$\hat{t}>0.15$
), the upper free surface melds into the spreading lamella, see figure 2. This decay stage is much longer than the pre-peak rise. In terms of the total time duration, the majority of the induced force occurs during the decay.
3.4 Normalised profiles
In terms of the entire experimental range, the measured peak forces cover three orders of magnitude. The peak force of test condition 4 exceeded 1300 mN, while the peak force of test condition 7 was under 3 mN. The profiles of all test conditions exhibit the same qualitative features as displayed in figure 3, but exhibit different peak forces, time durations, etc. See the supplemental material section for the force profiles of all test conditions available at https://doi.org/10.1017/jfm.2019.141. Figure 3(b) shows the non-dimensional force profile for the test of figure 3(a) and its respective filtered profile. As is apparent, the filtered profile faithfully adheres to the trend of the unfiltered profile. The normalised profile for each test condition, listed in table 2, is determined by dividing the force of each respective trial by
 $\unicode[STIX]{x1D70C}v^{2}d^{2}$
, and the time by
$\unicode[STIX]{x1D70C}v^{2}d^{2}$
, and the time by
 $d/v$
, and then averaging the 5 non-dimensionalised trials of the test condition. This choice of non-dimensionalisation employs an inertial set of normalising parameters (i.e.
$d/v$
, and then averaging the 5 non-dimensionalised trials of the test condition. This choice of non-dimensionalisation employs an inertial set of normalising parameters (i.e.
 $\unicode[STIX]{x1D70C}$
,
$\unicode[STIX]{x1D70C}$
,
 $v$
and
$v$
and
 $d$
). In figure 3(b), the peak force occurs at a non-dimensional time of approximately 0.15, and attains a non-dimensional peak force magnitude of approximately 0.87. Similarly, Gordillo et al. (Reference Gordillo, Sun and Cheng2018) found the normalised time of peak force and peak force to be 0.18 and 0.85, respectively. Figure 3(b), shows the analytical solution derived by Philippi et al. (Reference Philippi, Lagrée and Antkowiak2016) compared with the measurements. As shown, the normalised form of (1.1) compares well with the filtered data up to a normalised time of approximately (
$d$
). In figure 3(b), the peak force occurs at a non-dimensional time of approximately 0.15, and attains a non-dimensional peak force magnitude of approximately 0.87. Similarly, Gordillo et al. (Reference Gordillo, Sun and Cheng2018) found the normalised time of peak force and peak force to be 0.18 and 0.85, respectively. Figure 3(b), shows the analytical solution derived by Philippi et al. (Reference Philippi, Lagrée and Antkowiak2016) compared with the measurements. As shown, the normalised form of (1.1) compares well with the filtered data up to a normalised time of approximately (
 $\hat{t}=0.05$
), and then diverges. This demonstrates that the initial impact force scales like
$\hat{t}=0.05$
), and then diverges. This demonstrates that the initial impact force scales like
 $\sqrt{t}$
, as anticipated. Note that figure 3 is representative of inertia-dominated impacts (high
$\sqrt{t}$
, as anticipated. Note that figure 3 is representative of inertia-dominated impacts (high
 $Re$
), and an alternative scaling law must be adopted for viscous drops (low
$Re$
), and an alternative scaling law must be adopted for viscous drops (low
 $Re$
).
$Re$
).
The normalised profiles for all test conditions are displayed in figure 4. Figure 4(a) shows the force profiles for impacts in the viscous regime, while figure 4(b) shows the force profiles for impacts in the self-similar inertial regime. The viscous regime profiles are noticeably different from inertia-dominated profiles. Namely, they exhibit a greater peak non-dimensional force, and have a shorter non-dimensional time duration. These tests are representative of low
 $Re$
, (test conditions 1–6), and have their own viscous regime (see table 2). With increasing
$Re$
, (test conditions 1–6), and have their own viscous regime (see table 2). With increasing
 $Re$
in the viscous regime, the force profiles decrease in peak non-dimensional force and increase in non-dimensional time duration, as indicated by the arrows in figure 4(a). The inset of figure 4(a) readily shows how the peak force decreases with increasing
$Re$
in the viscous regime, the force profiles decrease in peak non-dimensional force and increase in non-dimensional time duration, as indicated by the arrows in figure 4(a). The inset of figure 4(a) readily shows how the peak force decreases with increasing
 $Re$
.
$Re$
.
These Reynolds number dependent characteristics of viscous force profiles are in agreement with the results found in Gordillo et al. (Reference Gordillo, Sun and Cheng2018). In their study, however, a wider range of Reynolds numbers is explored within the viscous range (down to
 $Re=0.7$
). Based on the peak time, they propose a quantitative model for the scaling of peak force. The peak time was found to increase with increasing
$Re=0.7$
). Based on the peak time, they propose a quantitative model for the scaling of peak force. The peak time was found to increase with increasing
 $Re$
, and using this, the peak force is determined through the product of inertial peak force and the ratio of inertial peak time to viscous peak time (see equations 3.18 & 3.20 in Gordillo et al. (Reference Gordillo, Sun and Cheng2018)). Using this model, the normalised peak force for Reynolds numbers of 10, 16, 27, 28, 64 and 280 (test conditions 1–6), is 1.21, 1.13, 1.06, 1.05, 0.91, 0.87, respectively. In terms of peak force comparison our results exhibit a lower peak force than that anticipated by this model. The difference increases with decreasing
$Re$
, and using this, the peak force is determined through the product of inertial peak force and the ratio of inertial peak time to viscous peak time (see equations 3.18 & 3.20 in Gordillo et al. (Reference Gordillo, Sun and Cheng2018)). Using this model, the normalised peak force for Reynolds numbers of 10, 16, 27, 28, 64 and 280 (test conditions 1–6), is 1.21, 1.13, 1.06, 1.05, 0.91, 0.87, respectively. In terms of peak force comparison our results exhibit a lower peak force than that anticipated by this model. The difference increases with decreasing
 $Re$
, where the largest difference is approximately 13 %, at
$Re$
, where the largest difference is approximately 13 %, at
 $Re=10$
. This discrepancy is attributed to the initial oscillations induced by impact where the oscillation amplitude is the greatest, and is, therefore, difficult to identify maximum force. Similarly, a quantitative value for peak time is uncertain due to the oscillation, see raw data in supplemental materials.
$Re=10$
. This discrepancy is attributed to the initial oscillations induced by impact where the oscillation amplitude is the greatest, and is, therefore, difficult to identify maximum force. Similarly, a quantitative value for peak time is uncertain due to the oscillation, see raw data in supplemental materials.

Figure 4. Non-dimensional force profiles; (a) test conditions in the viscous regime,
 $10\leqslant Re<280$
, and (b) test conditions in the self-similar inertial regime,
$10\leqslant Re<280$
, and (b) test conditions in the self-similar inertial regime,
 $280<Re\leqslant 29\,800$
. The black profile is (4.2).
$280<Re\leqslant 29\,800$
. The black profile is (4.2).
The force profiles enter the self-similar inertial regime for
 $Re\gtrsim 280$
(test conditions 7–14). In the inertial regime, all profiles share the same profile once normalised. Here, the normalised profile is invariant for variations in Reynolds number (between approximately
$Re\gtrsim 280$
(test conditions 7–14). In the inertial regime, all profiles share the same profile once normalised. Here, the normalised profile is invariant for variations in Reynolds number (between approximately
 $280<Re\leqslant 29\,800$
) and Weber number (between
$280<Re\leqslant 29\,800$
) and Weber number (between
 $37\leqslant We\leqslant 6360$
). This result has also been observed in other recent studies (Zhang et al.
Reference Zhang, Li, Guo and Lv2017; Gordillo et al.
Reference Gordillo, Sun and Cheng2018). It indicates that viscosity and surface tension do not influence the normal force exerted within the given parameter ranges. In this regard, and similar to figure 3, the peak non-dimensional forces, in figure 4(b), are approximately 0.85 and occur at a non-dimensional time of approximately 0.15. We note that the profiles of all test conditions exhibit no observable differences for variations in
$37\leqslant We\leqslant 6360$
). This result has also been observed in other recent studies (Zhang et al.
Reference Zhang, Li, Guo and Lv2017; Gordillo et al.
Reference Gordillo, Sun and Cheng2018). It indicates that viscosity and surface tension do not influence the normal force exerted within the given parameter ranges. In this regard, and similar to figure 3, the peak non-dimensional forces, in figure 4(b), are approximately 0.85 and occur at a non-dimensional time of approximately 0.15. We note that the profiles of all test conditions exhibit no observable differences for variations in
 $We$
, over the present
$We$
, over the present
 $We$
range. For comparison, figure 4(a), shows test conditions 3 and 4 where their Weber number is 610 and 4200 respectively, while their Reynolds numbers are relatively unchanged, 27 and 28 respectively. Despite the difference in Weber number, their force profiles are nearly identical, signifying Weber number effects are invariant both in the viscous regime (above
$We$
range. For comparison, figure 4(a), shows test conditions 3 and 4 where their Weber number is 610 and 4200 respectively, while their Reynolds numbers are relatively unchanged, 27 and 28 respectively. Despite the difference in Weber number, their force profiles are nearly identical, signifying Weber number effects are invariant both in the viscous regime (above
 $We=610$
) and the inertia regime (above
$We=610$
) and the inertia regime (above
 $We=37$
). Therefore, all measurements of this study show Weber number invariance. Similarly, Šikalo et al. (Reference Šikalo, Marengo, Tropea and Ganić2002), and Rioboo, Marengo & Tropea (Reference Rioboo, Marengo and Tropea2002) found the droplet spreading radius to be solely
$We=37$
). Therefore, all measurements of this study show Weber number invariance. Similarly, Šikalo et al. (Reference Šikalo, Marengo, Tropea and Ganić2002), and Rioboo, Marengo & Tropea (Reference Rioboo, Marengo and Tropea2002) found the droplet spreading radius to be solely
 $Re$
dependent, with negligible effects due to
$Re$
dependent, with negligible effects due to
 $We$
. Additionally, Lagubeau et al. (Reference Lagubeau, Fontelos, Josserand, Maurel, Pagneux and Petitjeans2012) have shown that, during deformation, the droplet free surface adheres to self-similarity with
$We$
. Additionally, Lagubeau et al. (Reference Lagubeau, Fontelos, Josserand, Maurel, Pagneux and Petitjeans2012) have shown that, during deformation, the droplet free surface adheres to self-similarity with
 $Re$
alone.
$Re$
alone.
3.5 Impulse and change in momentum
For all test conditions, the ratio between the measured impulse (i.e. area under the force profile) and the measured droplet momentum
 $m_{e}v$
, where
$m_{e}v$
, where
 $m_{e}$
is the equivalent mass calculated from the imaged droplet diameter
$m_{e}$
is the equivalent mass calculated from the imaged droplet diameter
 $d$
;
$d$
;
 $m_{e}=(\unicode[STIX]{x03C0}/6)\unicode[STIX]{x1D70C}d^{3}$
, is between 0.98 and 1.10. Therefore, the impulse exerted by the droplet impact, listed in table 2, is approximately equal to the droplet momentum just before impact. This provides an indication of the measurement system accuracy, since, by definition, impulse is equal to the change in momentum of an event. See the supplemental materials section for an estimation of the measured force uncertainty (Coleman and Steele Reference Coleman and Steele2009).
$m_{e}=(\unicode[STIX]{x03C0}/6)\unicode[STIX]{x1D70C}d^{3}$
, is between 0.98 and 1.10. Therefore, the impulse exerted by the droplet impact, listed in table 2, is approximately equal to the droplet momentum just before impact. This provides an indication of the measurement system accuracy, since, by definition, impulse is equal to the change in momentum of an event. See the supplemental materials section for an estimation of the measured force uncertainty (Coleman and Steele Reference Coleman and Steele2009).
The present droplets undergo a nearly perfect inelastic collision since, after the event, their momentum is zero in the wall-normal direction (the impact surface is assumed rigid), and just before impact their momentum is
 $mv$
. Therefore the total change in momentum is
$mv$
. Therefore the total change in momentum is
 $mv$
(i.e. coefficient of restitution equals zero). It is interesting to note that if a droplet rebounds after impact (i.e. bounces), typically from a hydrophobic surface (Tsai et al.
Reference Tsai, Pacheco, Pirat, Lefferts and Lohse2009), then the total change in momentum will be larger than
$mv$
(i.e. coefficient of restitution equals zero). It is interesting to note that if a droplet rebounds after impact (i.e. bounces), typically from a hydrophobic surface (Tsai et al.
Reference Tsai, Pacheco, Pirat, Lefferts and Lohse2009), then the total change in momentum will be larger than
 $mv$
, since the droplet has a non-zero velocity after its interaction with the surface. This, in turn, will exert a larger impulse, compared to an identically impacting droplet that adheres to the impingement surface. Impacts within the visco-elastic regime, (
$mv$
, since the droplet has a non-zero velocity after its interaction with the surface. This, in turn, will exert a larger impulse, compared to an identically impacting droplet that adheres to the impingement surface. Impacts within the visco-elastic regime, (
 $Re<0.7$
), do not result in an impulse equal to the drop momentum (Gordillo et al.
Reference Gordillo, Sun and Cheng2018). In this regime, a negative force is applied to the impact surface as the drop attempts to rebound. The present force profiles show approximately the same non-dimensional impulse, regardless of
$Re<0.7$
), do not result in an impulse equal to the drop momentum (Gordillo et al.
Reference Gordillo, Sun and Cheng2018). In this regime, a negative force is applied to the impact surface as the drop attempts to rebound. The present force profiles show approximately the same non-dimensional impulse, regardless of
 $Re$
. This indicates that impacts in the viscous and inertial regimes can be modelled as perfectly inelastic collisions.
$Re$
. This indicates that impacts in the viscous and inertial regimes can be modelled as perfectly inelastic collisions.

Figure 5. Deformed droplet configuration at the time of peak force. From (left) to (right), tests 1, 4, 6 and 13, with
 $Re=10$
, 28, 280, 20 700, respectively. The shape and lamella formation is altered in the viscous regime, while the deformed shape in the inertial regime resembles a dome with side walls perpendicular to the surface. With increasing
$Re=10$
, 28, 280, 20 700, respectively. The shape and lamella formation is altered in the viscous regime, while the deformed shape in the inertial regime resembles a dome with side walls perpendicular to the surface. With increasing
 $Re$
the droplet base goes from curved inward to perpendicular at the time of peak force.
$Re$
the droplet base goes from curved inward to perpendicular at the time of peak force.
3.6 Free-surface configuration at peak force
The effects of viscosity are present in the deformed droplet configurations at peak force. Figure 5 shows the droplets of test conditions 1, 4, 6 and 13 at the time coinciding with the peak in their associated force profile. As previously mentioned, at peak force, the shape of droplets in the self-similar inertial regime have side walls perpendicular to the impact plate (test condition 13 in figure 5), with circumferential side walls equal to their respective droplet diameters,
 $d$
. This is not the case for impacts in the viscous regime, where the droplet base is bulged and often without a lamella. These viscous impacts do not allow the base of the droplet to reach the vertical side wall condition, making the diameter of the droplet base less than
$d$
. This is not the case for impacts in the viscous regime, where the droplet base is bulged and often without a lamella. These viscous impacts do not allow the base of the droplet to reach the vertical side wall condition, making the diameter of the droplet base less than
 $d$
. In addition, viscous impacts exhibit limited lamella formation owing to the high radial shear stress about the initial point of contact. The viscous stress impedes radial flow near the surface which further increases the volume of liquid about the droplet base, resulting in the observed bulged shape. In contrast, droplets in the inertial regime exhibit weak viscous stresses allowing significant lamellae to form. The effects of viscosity evidently underlie the reason for the shape deviation between the viscous and inertial regimes. In support of this, visual evidence indicates that with increasing
$d$
. In addition, viscous impacts exhibit limited lamella formation owing to the high radial shear stress about the initial point of contact. The viscous stress impedes radial flow near the surface which further increases the volume of liquid about the droplet base, resulting in the observed bulged shape. In contrast, droplets in the inertial regime exhibit weak viscous stresses allowing significant lamellae to form. The effects of viscosity evidently underlie the reason for the shape deviation between the viscous and inertial regimes. In support of this, visual evidence indicates that with increasing
 $Re$
, lamella jetting develops during the viscous regime, and then becomes unmistakably apparent in the inertial regime, see figure 5, test condition 13. The onset of lamella formation apparently distinguishes the two regimes. This physically reflects the inertial transfer of surface-normal momentum to surface-parallel momentum. Compared to impacts in the inertial regime, where significant lamella jetting occurs, there exists more accumulated (excess) liquid around the base of the viscous regime droplets as they initially deform. This extra liquid promotes a more rapid momentum transfer to the surface. In fact, Gordillo et al. (Reference Gordillo, Sun and Cheng2018) show that the pre-peak force rise, for viscous regime droplets, scales as
$Re$
, lamella jetting develops during the viscous regime, and then becomes unmistakably apparent in the inertial regime, see figure 5, test condition 13. The onset of lamella formation apparently distinguishes the two regimes. This physically reflects the inertial transfer of surface-normal momentum to surface-parallel momentum. Compared to impacts in the inertial regime, where significant lamella jetting occurs, there exists more accumulated (excess) liquid around the base of the viscous regime droplets as they initially deform. This extra liquid promotes a more rapid momentum transfer to the surface. In fact, Gordillo et al. (Reference Gordillo, Sun and Cheng2018) show that the pre-peak force rise, for viscous regime droplets, scales as
 $1/\sqrt{Re}$
, leading to a more rapid increase in force for decreasing
$1/\sqrt{Re}$
, leading to a more rapid increase in force for decreasing
 $Re$
. Accordingly, the peak force is attained sooner and at a higher value than that of the inertial profile. Viscosity has the effect of impeding lamella formation and through this, accumulates more liquid around the base, which induces a faster deceleration of the drop.
$Re$
. Accordingly, the peak force is attained sooner and at a higher value than that of the inertial profile. Viscosity has the effect of impeding lamella formation and through this, accumulates more liquid around the base, which induces a faster deceleration of the drop.
3.7 Long-time behaviour of inertial profiles
In this subsection we investigate the post-peak behaviour of force profiles in the self-similar inertial regime. Recall that these are Reynolds and Weber number invariant. The investigation begins after peak force which occurs at a normalised time of approximately
 $\hat{t}=0.15$
. At the moment of peak force the droplet side wall is perpendicular to the impact plate, while the upper surface resembles a spherical dome, see figure 5. After peak force, the upper half of the free-surface slowly melds into the radially expanding lamella (slowly compared to the lamella’s initial radial velocity, which can be 10 times faster than the drop’s impact velocity (Rioboo et al.
Reference Rioboo, Marengo and Tropea2002)). Correspondingly, the applied force decays relatively slowly to zero. We note that the force changes concavity at approximately
$\hat{t}=0.15$
. At the moment of peak force the droplet side wall is perpendicular to the impact plate, while the upper surface resembles a spherical dome, see figure 5. After peak force, the upper half of the free-surface slowly melds into the radially expanding lamella (slowly compared to the lamella’s initial radial velocity, which can be 10 times faster than the drop’s impact velocity (Rioboo et al.
Reference Rioboo, Marengo and Tropea2002)). Correspondingly, the applied force decays relatively slowly to zero. We note that the force changes concavity at approximately
 $\hat{t}=0.4$
. After a normalised time of about
$\hat{t}=0.4$
. After a normalised time of about
 $\hat{t}=2$
, the observed force is nearly zero, and the motion of the now pancake-like lamella is radially outward. No forces are recorded during this final spreading phase.
$\hat{t}=2$
, the observed force is nearly zero, and the motion of the now pancake-like lamella is radially outward. No forces are recorded during this final spreading phase.

Figure 6. Long-time exponential behaviour of the inertial droplet force profile. (a) Shows the force profile of test condition 11 with an exponential fit for the post-peak decay (dashed orange line). The decay begins at
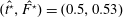 $(\hat{t^{\star }},\hat{F^{\star }})=(0.5,0.53)$
, indicated by the yellow star. The inset shows the force profile’s derivative plotted against force (blue). The post-peak force decay adheres to a linear relationship between
$(\hat{t^{\star }},\hat{F^{\star }})=(0.5,0.53)$
, indicated by the yellow star. The inset shows the force profile’s derivative plotted against force (blue). The post-peak force decay adheres to a linear relationship between
 $\text{d}\hat{F}/\text{d}\hat{t}$
and
$\text{d}\hat{F}/\text{d}\hat{t}$
and
 $\hat{F}$
, as indicated by the fit line (dashed green line). The black curve is equation (4.3) versus equation (4.2), indicating the suitability of (4.2) as a force model. (b) Shows a linear regression of the force profile which is valid between
$\hat{F}$
, as indicated by the fit line (dashed green line). The black curve is equation (4.3) versus equation (4.2), indicating the suitability of (4.2) as a force model. (b) Shows a linear regression of the force profile which is valid between
 $(\hat{t}-\hat{t^{\star }})=0$
and
$(\hat{t}-\hat{t^{\star }})=0$
and
 $(\hat{t}-\hat{t^{\star }})=1.5$
.
$(\hat{t}-\hat{t^{\star }})=1.5$
.
To begin our investigation, we first plot the time derivative of force against force in figure 6(a). For values of force below 0.5 and after peak force, the relation between
 $\text{d}\hat{F}/\text{d}\hat{t}$
and
$\text{d}\hat{F}/\text{d}\hat{t}$
and
 $\hat{F}$
is linear, as indicated by the fit line
$\hat{F}$
is linear, as indicated by the fit line
 $\text{d}\hat{F}/\text{d}\hat{t}=(-1/k)\hat{F}$
, (dashed green line). Note that this is plotted on semi-log axes so the fit line is curved instead of straight. The derivatives are calculated by the central difference method (first order accurate), on a reduced number of sample points. The fit line diverges from the data when the force is greater than approximately 0.5. This plot suggests that, during this time (i.e.
$\text{d}\hat{F}/\text{d}\hat{t}=(-1/k)\hat{F}$
, (dashed green line). Note that this is plotted on semi-log axes so the fit line is curved instead of straight. The derivatives are calculated by the central difference method (first order accurate), on a reduced number of sample points. The fit line diverges from the data when the force is greater than approximately 0.5. This plot suggests that, during this time (i.e.
 $0.5<\hat{t}<2$
), the time derivative of force is linearly proportional to the applied force. This enables one to employ the following empirical relationship between force and its time rate of change:
$0.5<\hat{t}<2$
), the time derivative of force is linearly proportional to the applied force. This enables one to employ the following empirical relationship between force and its time rate of change:
 $$\begin{eqnarray}\displaystyle \hat{F}(\hat{t})=-k\frac{\text{d}\hat{F}}{\text{d}\hat{t}}, & & \displaystyle\end{eqnarray}$$
where
 $k$
is a constant of proportionality. This is effectively a statement that the rate of force transfer is proportional to the available remaining force. Physically, we are treating this as a lumped system. In analogy with heat transfer problems where the internal conduction within a body is fast relative to the heat transport across the body surface, the present model assumes that the internal momentum transfer is fast relative to the momentum transfer from the droplet to the surface. This rate-limiting description is consistent with the momentum transport being intimately connected to the impacting droplet shape, as described further below.
$k$
is a constant of proportionality. This is effectively a statement that the rate of force transfer is proportional to the available remaining force. Physically, we are treating this as a lumped system. In analogy with heat transfer problems where the internal conduction within a body is fast relative to the heat transport across the body surface, the present model assumes that the internal momentum transfer is fast relative to the momentum transfer from the droplet to the surface. This rate-limiting description is consistent with the momentum transport being intimately connected to the impacting droplet shape, as described further below.
To provide further assurance of relation (3.1), the natural logarithm of force is plotted against time. There is a distinguished linear trend from
 $(\hat{t}-\hat{t^{\star }})=0$
to
$(\hat{t}-\hat{t^{\star }})=0$
to
 $(\hat{t}-\hat{t^{\star }})=1.5$
(i.e.
$(\hat{t}-\hat{t^{\star }})=1.5$
(i.e.
 $\hat{t}=0.5$
to
$\hat{t}=0.5$
to
 $\hat{t}=2$
). The fit line in figure 6(b) has a slope of
$\hat{t}=2$
). The fit line in figure 6(b) has a slope of
 $1/k=-2.90$
, which is in good agreement with the slope found using the derivative method,
$1/k=-2.90$
, which is in good agreement with the slope found using the derivative method,
 $1/k=-2.84$
.
$1/k=-2.84$
.
Due to the experimental support provided by figure 6(a–b), relation (3.1) may be used to approximate the force for times after
 $\hat{t}=0.5$
. Equation (3.1) specifies that the rate at which force changes is directly related to the applied force and can be readily solved by separation of variables. From (3.1) it follows that
$\hat{t}=0.5$
. Equation (3.1) specifies that the rate at which force changes is directly related to the applied force and can be readily solved by separation of variables. From (3.1) it follows that
 $$\begin{eqnarray}\displaystyle \int _{\hat{t^{\star }}}^{\hat{t}}-\frac{1}{k}\,\text{d}\hat{t}=\int _{\hat{F^{\star }}}^{\hat{F}}\frac{1}{\hat{F}}\,\text{d}\hat{F}, & & \displaystyle\end{eqnarray}$$
and thus,
 $$\begin{eqnarray}\displaystyle \hat{F}(\hat{t})=\hat{F^{\star }}\text{e}^{-(1/k)(\hat{t}-\hat{t^{\star }})}, & & \displaystyle\end{eqnarray}$$
where
 $\hat{F}=\hat{F^{\star }}$
at
$\hat{F}=\hat{F^{\star }}$
at
 $\hat{t}=\hat{t^{\star }}$
. The linear relationship between force and its derivative, produces an exponential decay which may be used to approximate the long-time force behaviour. The slope obtained from the fit line,
$\hat{t}=\hat{t^{\star }}$
. The linear relationship between force and its derivative, produces an exponential decay which may be used to approximate the long-time force behaviour. The slope obtained from the fit line,
 $1/k=-2.84$
, is used to approximate the force in the main plot of figure 6 as an exponential, and as shown, is in convincing agreement with the measurements (after
$1/k=-2.84$
, is used to approximate the force in the main plot of figure 6 as an exponential, and as shown, is in convincing agreement with the measurements (after
 $\hat{t}=0.5$
). Notice that the exponential fit begins to merge with the data at a normalised force of approximately 0.5. The starting point for the exponential decay begins at approximately
$\hat{t}=0.5$
). Notice that the exponential fit begins to merge with the data at a normalised force of approximately 0.5. The starting point for the exponential decay begins at approximately
 $(\hat{t^{\star }},\hat{F^{\star }})=(0.5,0.53)$
. We note that the decay is not due to relaxation of the force sensor, as it can accurately measure dynamic loads of durations longer than 2 s (Discussion on sensor decay (personal communication), PCB Piezotronics, Inc., 2018).
$(\hat{t^{\star }},\hat{F^{\star }})=(0.5,0.53)$
. We note that the decay is not due to relaxation of the force sensor, as it can accurately measure dynamic loads of durations longer than 2 s (Discussion on sensor decay (personal communication), PCB Piezotronics, Inc., 2018).
4 Force model
In this section we formulate a model equation that accurately represents the full force evolution of a droplet impinging normal to a flat rigid surface. It is assumed that the droplet Reynolds number is high and within the self-similar inertial regime. The functional form for the equation is strategically chosen from previous analytical works, while utilising the decay model and physics educed in the present study.
As previously discussed, during initial deformation, the centre pressure exerted by an impinging droplet obeys a
 $1/\sqrt{t}$
dependence (Josserand & Zaleski Reference Josserand and Zaleski2003; Eggers et al.
Reference Eggers, Fontelos, Josserand and Zaleski2010; Philippi et al.
Reference Philippi, Lagrée and Antkowiak2016), and maintains this pressure dependence for approximately
$1/\sqrt{t}$
dependence (Josserand & Zaleski Reference Josserand and Zaleski2003; Eggers et al.
Reference Eggers, Fontelos, Josserand and Zaleski2010; Philippi et al.
Reference Philippi, Lagrée and Antkowiak2016), and maintains this pressure dependence for approximately
 $\hat{t}=0.5$
. Our measurements show that at this time,
$\hat{t}=0.5$
. Our measurements show that at this time,
 $\hat{t}=0.5$
, the peak force has already occurred and the force is diminishing to zero. Thus for the initial impact force, we assume the average pressure applied on the surface has a
$\hat{t}=0.5$
, the peak force has already occurred and the force is diminishing to zero. Thus for the initial impact force, we assume the average pressure applied on the surface has a
 $1/\sqrt{t}$
dependence. In addition, the spreading radius has been found to obey a
$1/\sqrt{t}$
dependence. In addition, the spreading radius has been found to obey a
 $\sqrt{t}$
dependence (Rioboo et al.
Reference Rioboo, Marengo and Tropea2002; Mongruel et al.
Reference Mongruel, Daru, Feuillebois and Tabakova2009; Riboux & Gordillo Reference Riboux and Gordillo2014). A functional form for the force profile is constructed via the product of the contact area and contact pressure. Hence, the force should obey a
$\sqrt{t}$
dependence (Rioboo et al.
Reference Rioboo, Marengo and Tropea2002; Mongruel et al.
Reference Mongruel, Daru, Feuillebois and Tabakova2009; Riboux & Gordillo Reference Riboux and Gordillo2014). A functional form for the force profile is constructed via the product of the contact area and contact pressure. Hence, the force should obey a
 $\sqrt{t}$
dependence, as analytically predicted by Philippi et al. (Reference Philippi, Lagrée and Antkowiak2016), however, this is unsuitable for large time, since
$\sqrt{t}$
dependence, as analytically predicted by Philippi et al. (Reference Philippi, Lagrée and Antkowiak2016), however, this is unsuitable for large time, since
 $\sqrt{t}$
diverges. Thus, in accordance with the analysis in § 3.7 we include an exponential decay for large times. This simultaneously preserves the
$\sqrt{t}$
diverges. Thus, in accordance with the analysis in § 3.7 we include an exponential decay for large times. This simultaneously preserves the
 $\sqrt{t}$
dependence for the initial deformation, while bounding the function for large time. Furthermore, we note that the use of an exponential has shown previous success as a fitting function to match the numerical predictions of the central pressure decay for times of the order of
$\sqrt{t}$
dependence for the initial deformation, while bounding the function for large time. Furthermore, we note that the use of an exponential has shown previous success as a fitting function to match the numerical predictions of the central pressure decay for times of the order of
 $d/v$
, (Roisman et al.
Reference Roisman, Berberović and Tropea2009). Our model equation is then:
$d/v$
, (Roisman et al.
Reference Roisman, Berberović and Tropea2009). Our model equation is then:
 $$\begin{eqnarray}\displaystyle F(t)=c\sqrt{\frac{t}{\unicode[STIX]{x1D70F}}}\text{e}^{-t/\unicode[STIX]{x1D70F}}, & & \displaystyle\end{eqnarray}$$
where
 $c$
and
$c$
and
 $\unicode[STIX]{x1D70F}$
are constants. For small time, (
$\unicode[STIX]{x1D70F}$
are constants. For small time, (
 $t<0.1d/v$
), equation (4.1), behaves like
$t<0.1d/v$
), equation (4.1), behaves like
 $\sqrt{t}$
, as anticipated, since the exponential approximates unity for small time. Constants,
$\sqrt{t}$
, as anticipated, since the exponential approximates unity for small time. Constants,
 $c$
and
$c$
and
 $\unicode[STIX]{x1D70F}$
can be estimated from the present experiments. The impulse is experimentally well approximated by the measured momentum of the droplet. Therefore equating the integral of
$\unicode[STIX]{x1D70F}$
can be estimated from the present experiments. The impulse is experimentally well approximated by the measured momentum of the droplet. Therefore equating the integral of
 $F(t)$
over all positive times to
$F(t)$
over all positive times to
 $mv$
, yields
$mv$
, yields
 $\sqrt{\unicode[STIX]{x03C0}}c\unicode[STIX]{x1D70F}/2=mv$
. The time to peak force is experimentally found to occur at
$\sqrt{\unicode[STIX]{x03C0}}c\unicode[STIX]{x1D70F}/2=mv$
. The time to peak force is experimentally found to occur at
 $t\simeq 0.15d/v$
. Accordingly, the time derivative of
$t\simeq 0.15d/v$
. Accordingly, the time derivative of
 $F(t)$
is set equal to zero at
$F(t)$
is set equal to zero at
 $t=0.15d/v$
, from which we obtain
$t=0.15d/v$
, from which we obtain
 $\unicode[STIX]{x1D70F}=(3/10)d/v$
and
$\unicode[STIX]{x1D70F}=(3/10)d/v$
and
 $c=(10\sqrt{\unicode[STIX]{x03C0}}/9)\unicode[STIX]{x1D70C}d^{2}v^{2}$
. With these constants, the non-dimensional form of (4.1) becomes
$c=(10\sqrt{\unicode[STIX]{x03C0}}/9)\unicode[STIX]{x1D70C}d^{2}v^{2}$
. With these constants, the non-dimensional form of (4.1) becomes
 $$\begin{eqnarray}\displaystyle \hat{F}(\hat{t})=\sqrt{\frac{1000\unicode[STIX]{x03C0}\hat{t}}{243}}\text{e}^{-10\hat{t}/3}. & & \displaystyle\end{eqnarray}$$
Equation (4.2) is plotted in figure 4(b), as a solid black line. As shown, equation (4.2) well approximates the force profiles of the droplet impacts in the self-similar inertial regime. Here, is it relevant to note that the analytically derived constant before the
 $\sqrt{t}$
term, in (1.1) by Philippi et al. (Reference Philippi, Lagrée and Antkowiak2016), is remarkably close to our constant,
$\sqrt{t}$
term, in (1.1) by Philippi et al. (Reference Philippi, Lagrée and Antkowiak2016), is remarkably close to our constant,
 $\sqrt{c^{2}/\unicode[STIX]{x1D70F}}$
. In fact, if our constant,
$\sqrt{c^{2}/\unicode[STIX]{x1D70F}}$
. In fact, if our constant,
 $\sqrt{c^{2}/\unicode[STIX]{x1D70F}}$
, is replaced by
$\sqrt{c^{2}/\unicode[STIX]{x1D70F}}$
, is replaced by
 $\sqrt{27/2}\unicode[STIX]{x1D70C}d^{3/2}v^{5/2}$
and is used to solve for the time to peak force, using the same integral and derivative condition, then the time to peak force occurs at
$\sqrt{27/2}\unicode[STIX]{x1D70C}d^{3/2}v^{5/2}$
and is used to solve for the time to peak force, using the same integral and derivative condition, then the time to peak force occurs at
 $t\simeq 0.148d/v$
, extremely close to our experimental observation of
$t\simeq 0.148d/v$
, extremely close to our experimental observation of
 $t=0.15d/v$
. It is interesting to note that if
$t=0.15d/v$
. It is interesting to note that if
 $\sqrt{c^{2}/\unicode[STIX]{x1D70F}}$
is equal to
$\sqrt{c^{2}/\unicode[STIX]{x1D70F}}$
is equal to
 $\sqrt{27/2}\unicode[STIX]{x1D70C}d^{3/2}v^{5/2}$
then (4.1) is asymptotic to (1.1) as
$\sqrt{27/2}\unicode[STIX]{x1D70C}d^{3/2}v^{5/2}$
then (4.1) is asymptotic to (1.1) as
 $t\rightarrow 0^{+}$
(i.e. early-time solution of Philippi et al. (Reference Philippi, Lagrée and Antkowiak2016)). Moreover, the derivative of (4.2) compares well with the experimentally determined derivatives. The derivative of (4.2) with respect to time is:
$t\rightarrow 0^{+}$
(i.e. early-time solution of Philippi et al. (Reference Philippi, Lagrée and Antkowiak2016)). Moreover, the derivative of (4.2) compares well with the experimentally determined derivatives. The derivative of (4.2) with respect to time is:
 $$\begin{eqnarray}\displaystyle \frac{\text{d}\hat{F}}{\text{d}\hat{t}}=\sqrt{\frac{1000\unicode[STIX]{x03C0}\hat{t}}{243}}\left(\frac{1}{2\hat{t}}-\frac{10}{3}\right)\text{e}^{-10\hat{t}/3}, & & \displaystyle\end{eqnarray}$$
and is plotted against (4.2) in figure 6(a) inset (black). As is apparent, the black curve in figure 6(a) closely follows the data, indicating the suitability of (4.2) as an accurate force model.
5 Long-time force decay measured from free-surface height evolution
The results of the previous section support the treatment of the decaying portion of the force curve using a lumped momentum transport model. The linear dependence between the force and the force decay rate supports the efficacy of this modelling assumption. Physically, a lumped approach also suggests that the momentum transport is rate-limited owing to processes at/near the droplet/surface interface. The corollary to this is that momentum gradients are small over most of the droplet volume. In this section we use this assumption to construct a model for the force that is based solely on the movement of the upper free surface of the droplet. The results from this exercise further reinforce the validity of the lumped model.
For modelling purposes, assume that the impact is in the self-similar inertial regime and that the droplet is axially symmetric. Given this, the velocity within the fluid domain can be described in cylindrical coordinates as
 $\boldsymbol{v}=u(r,z,t)\hat{r}+w(r,z,t)\hat{z}$
, with axial momentum
$\boldsymbol{v}=u(r,z,t)\hat{r}+w(r,z,t)\hat{z}$
, with axial momentum
 $p=p(r,z,t)$
, which can be written as:
$p=p(r,z,t)$
, which can be written as:
 $$\begin{eqnarray}\displaystyle p(t)=\int _{V}\unicode[STIX]{x1D70C}w\,\text{d}V. & & \displaystyle\end{eqnarray}$$
Here the differential volume is the area of width
 $\text{d}r$
and height
$\text{d}r$
and height
 $h$
revolved about the
$h$
revolved about the
 $z$
-axis, (i.e.
$z$
-axis, (i.e.
 $\text{d}V=2\unicode[STIX]{x03C0}hr\,\text{d}r$
). The free surface is denoted by
$\text{d}V=2\unicode[STIX]{x03C0}hr\,\text{d}r$
). The free surface is denoted by
 $z=h(r,t)$
. Consistent with the lumped model assumption introduced and validated in the previous section, we take the momentum variations within the droplet to be negligible. Under this assumption the axial velocity within the drop is that given by the free surface. The momentum then becomes:
$z=h(r,t)$
. Consistent with the lumped model assumption introduced and validated in the previous section, we take the momentum variations within the droplet to be negligible. Under this assumption the axial velocity within the drop is that given by the free surface. The momentum then becomes:
 $$\begin{eqnarray}\displaystyle p(t)=2\unicode[STIX]{x03C0}\unicode[STIX]{x1D70C}\int _{0}^{R(t)}\frac{\unicode[STIX]{x2202}h}{\unicode[STIX]{x2202}t}hr\,\text{d}r, & & \displaystyle\end{eqnarray}$$
where
 $R(t)$
is the spreading radius of the drop. For large time the axial momentum near
$R(t)$
is the spreading radius of the drop. For large time the axial momentum near
 $r=R(t)$
(i.e. in the lamella region) is approximately zero. The droplet fluid near the edge of the lamella does not contribute a significant normal force compared to the droplet fluid near the impact point (
$r=R(t)$
(i.e. in the lamella region) is approximately zero. The droplet fluid near the edge of the lamella does not contribute a significant normal force compared to the droplet fluid near the impact point (
 $r=0$
). For our analysis we fix
$r=0$
). For our analysis we fix
 $R(t)=d/2$
, which, as we shall see, is a sufficient distance away from
$R(t)=d/2$
, which, as we shall see, is a sufficient distance away from
 $r=0$
to yield accurate force estimations. To normalise the momentum we divide
$r=0$
to yield accurate force estimations. To normalise the momentum we divide
 $p$
by the inertial parameters of the system; liquid density
$p$
by the inertial parameters of the system; liquid density
 $\unicode[STIX]{x1D70C}$
, droplet diameter
$\unicode[STIX]{x1D70C}$
, droplet diameter
 $d$
and the initial impact velocity
$d$
and the initial impact velocity
 $v$
(defined earlier):
$v$
(defined earlier):
 $$\begin{eqnarray}\displaystyle \hat{p}=\frac{2\unicode[STIX]{x03C0}\unicode[STIX]{x1D70C}\int _{0}^{d/2}\frac{\unicode[STIX]{x2202}h}{\unicode[STIX]{x2202}t}hr\,\text{d}r}{\unicode[STIX]{x1D70C}d^{3}v}. & & \displaystyle\end{eqnarray}$$
In terms of non-dimensional variables, equation (5.3) becomes:
 $$\begin{eqnarray}\displaystyle \hat{p}=2\unicode[STIX]{x03C0}\int _{0}^{1/2}\frac{\unicode[STIX]{x2202}{\hat{h}}}{\unicode[STIX]{x2202}\hat{t}}{\hat{h}}\hat{r}\,\text{d}\hat{r}. & & \displaystyle\end{eqnarray}$$
We now have an equation for the impinging droplet momentum that is solely a function of the free-surface height. Upon differentiation with respect to time, we have the resulting force:
 $$\begin{eqnarray}\displaystyle \hat{F}=\frac{\text{d}\hat{p}}{\text{d}\hat{t}}=2\unicode[STIX]{x03C0}\frac{\text{d}}{\text{d}\hat{t}}\left(\int _{0}^{1/2}\frac{\unicode[STIX]{x2202}{\hat{h}}}{\unicode[STIX]{x2202}\hat{t}}{\hat{h}}\hat{r}\,\text{d}\hat{r}\right). & & \displaystyle\end{eqnarray}$$
From high-speed imagery we can determine the height evolution of the impinging droplet at different radial locations. The height evolution of 35 radial positions from
 $r=0$
to
$r=0$
to
 $r=d/2$
in increments of 0.04 mm was recorded and is presented in figure 7(a–c). Figure 7(a) shows the height as a function of radial position, while figure 7(c) shows the height as a function of time for each radial location. Figure 7(b) shows the upper free surface for
$r=d/2$
in increments of 0.04 mm was recorded and is presented in figure 7(a–c). Figure 7(a) shows the height as a function of radial position, while figure 7(c) shows the height as a function of time for each radial location. Figure 7(b) shows the upper free surface for
 $\hat{t}\geqslant 0$
. This height evolution is for test condition 11, and is representative of height evolutions in the inertial regime. Figure 7(d) shows the normalised momentum as a function of time calculated using (5.4). The derivative of this curve is the estimated force (per equation (5.5)) and is presented with the direct force measurements in figure 7(e). As is apparent, the estimated force using the free-surface height closely adheres to the direct force measurements for
$\hat{t}\geqslant 0$
. This height evolution is for test condition 11, and is representative of height evolutions in the inertial regime. Figure 7(d) shows the normalised momentum as a function of time calculated using (5.4). The derivative of this curve is the estimated force (per equation (5.5)) and is presented with the direct force measurements in figure 7(e). As is apparent, the estimated force using the free-surface height closely adheres to the direct force measurements for
 $\hat{t}>0.5$
. The advantage of this technique is that it allows one to determine the normal force induced by droplet impacts with only knowledge of the free-surface height evolution (valid only for
$\hat{t}>0.5$
. The advantage of this technique is that it allows one to determine the normal force induced by droplet impacts with only knowledge of the free-surface height evolution (valid only for
 $\hat{t}>0.5$
). Its efficacy also reinforces the physics of the lumped model employed to describe the momentum transfer from the droplet to the surface.
$\hat{t}>0.5$
). Its efficacy also reinforces the physics of the lumped model employed to describe the momentum transfer from the droplet to the surface.

Figure 7. (a) Free-surface height evolution of test condition 11 measured at radial locations
 $0\leqslant \hat{r}\leqslant 0.5$
. (b) Shows the upper free surface for
$0\leqslant \hat{r}\leqslant 0.5$
. (b) Shows the upper free surface for
 $\hat{t}\geqslant 0$
. (c) Shows the height evolution as a function of time for each radial location. (d) Shows the total momentum calculated from the free-surface height (5.4), and (e) shows the force approximation of equation (5.5), compared to the measured force profile. The approximation is valid for the post-peak decay (
$\hat{t}\geqslant 0$
. (c) Shows the height evolution as a function of time for each radial location. (d) Shows the total momentum calculated from the free-surface height (5.4), and (e) shows the force approximation of equation (5.5), compared to the measured force profile. The approximation is valid for the post-peak decay (
 $\hat{t}>0.5$
). Error bars are based on the camera’s spatial and temporal resolution.
$\hat{t}>0.5$
). Error bars are based on the camera’s spatial and temporal resolution.
The force predicted by (5.5) is apparently valid for long time, however for early time the model underestimates the induced droplet force. Before impact (i.e.
 $\hat{t}<0$
), the drop travels toward the plate with a uniform axial momentum of
$\hat{t}<0$
), the drop travels toward the plate with a uniform axial momentum of
 $\hat{p}=-\unicode[STIX]{x03C0}/6$
. Once impact occurs the drop momentum immediately decreases due to the decreasing drop volume used in (5.4). We note here, that the lower free surface is approximated by a truncated falling sphere with velocity
$\hat{p}=-\unicode[STIX]{x03C0}/6$
. Once impact occurs the drop momentum immediately decreases due to the decreasing drop volume used in (5.4). We note here, that the lower free surface is approximated by a truncated falling sphere with velocity
 $v$
, which exists for
$v$
, which exists for
 $\hat{t}<0.5$
(see figure 7
a). The reason for using this model instead of the actual lower free surface is due to the erroneous effects of the radially growing lamella and bulging of the droplet base. Owing to continuity, the impact increases the volume of liquid at the base, and in effect increases the axial velocity of the lower free surface violating the uniform momentum assumption. The use of a truncated sphere model renders the momentum uniform during the early stages of impact (i.e. when the upper free surface continues to travel at a velocity
$\hat{t}<0.5$
(see figure 7
a). The reason for using this model instead of the actual lower free surface is due to the erroneous effects of the radially growing lamella and bulging of the droplet base. Owing to continuity, the impact increases the volume of liquid at the base, and in effect increases the axial velocity of the lower free surface violating the uniform momentum assumption. The use of a truncated sphere model renders the momentum uniform during the early stages of impact (i.e. when the upper free surface continues to travel at a velocity
 $v$
, see figure 7
c). It is apparent that this model captures the sudden increase in force, however the prediction falls below the measured force response. This discrepancy is likely due to the momentum inhomogeneity during the early stages of impact (Philippi et al.
Reference Philippi, Lagrée and Antkowiak2016). The variation between the self-similar fields concentrated about the impact region and the remaining bulk of the droplet violate the uniform momentum assumption. Therefore this model (5.5) can only approximate the drop-induced force once the fields establish uniformity.
$v$
, see figure 7
c). It is apparent that this model captures the sudden increase in force, however the prediction falls below the measured force response. This discrepancy is likely due to the momentum inhomogeneity during the early stages of impact (Philippi et al.
Reference Philippi, Lagrée and Antkowiak2016). The variation between the self-similar fields concentrated about the impact region and the remaining bulk of the droplet violate the uniform momentum assumption. Therefore this model (5.5) can only approximate the drop-induced force once the fields establish uniformity.

Figure 8. (a) Central height evolution
 ${\hat{h}}(0,\hat{t})={\hat{h}}_{c}(\hat{t})$
, for all test conditions. Inset shows the data plotted on a logarithmic scale, with the black-dashed line representing the ballistic regime and the black-dotted line representing the self-similar inertial regime (Lagubeau et al.
Reference Lagubeau, Fontelos, Josserand, Maurel, Pagneux and Petitjeans2012). (b) Shows the impact force versus the central height. Equation (4.2) versus the ballistic and self-similar regimes are plotted with black-dashed and black-dotted lines, respectively.
${\hat{h}}(0,\hat{t})={\hat{h}}_{c}(\hat{t})$
, for all test conditions. Inset shows the data plotted on a logarithmic scale, with the black-dashed line representing the ballistic regime and the black-dotted line representing the self-similar inertial regime (Lagubeau et al.
Reference Lagubeau, Fontelos, Josserand, Maurel, Pagneux and Petitjeans2012). (b) Shows the impact force versus the central height. Equation (4.2) versus the ballistic and self-similar regimes are plotted with black-dashed and black-dotted lines, respectively.
Another important quantity describing the droplet impingement process is the central height evolution, defined as
 ${\hat{h}}(0,\hat{t})={\hat{h}}_{c}(\hat{t})$
. This quantity is indicative of the impact process, as it provides useful insight into underlying scales of the problem, and reveals whether the impact process may be considered inertial. In addition, the central height is representative of the axial free-surface evolution. As is apparent in figure 7(c), the majority of the upper free surface follows the trend of the central height (most purple colour). For early time and before impact, the central height is simply ballistic, adhering to the functional form:
${\hat{h}}(0,\hat{t})={\hat{h}}_{c}(\hat{t})$
. This quantity is indicative of the impact process, as it provides useful insight into underlying scales of the problem, and reveals whether the impact process may be considered inertial. In addition, the central height is representative of the axial free-surface evolution. As is apparent in figure 7(c), the majority of the upper free surface follows the trend of the central height (most purple colour). For early time and before impact, the central height is simply ballistic, adhering to the functional form:
 ${\hat{h}}_{c}=1-\hat{t}$
. As deformation ensues the central height progressively slows down and approaches a constant minimal film thickness (Lagubeau et al.
Reference Lagubeau, Fontelos, Josserand, Maurel, Pagneux and Petitjeans2012). The transition between the ballistic and constant film thickness regime has been shown to admit a self-similar form, for large Reynolds numbers, where the central height behaves as:
${\hat{h}}_{c}=1-\hat{t}$
. As deformation ensues the central height progressively slows down and approaches a constant minimal film thickness (Lagubeau et al.
Reference Lagubeau, Fontelos, Josserand, Maurel, Pagneux and Petitjeans2012). The transition between the ballistic and constant film thickness regime has been shown to admit a self-similar form, for large Reynolds numbers, where the central height behaves as:
 $$\begin{eqnarray}\displaystyle {\hat{h}}_{c}=\frac{A}{(\hat{t}+\hat{t}_{0})^{2}}, & & \displaystyle\end{eqnarray}$$
where constants
 $A$
and
$A$
and
 $\hat{t}_{0}$
, are approximately 0.492 and 0.429, respectively (Lagubeau et al.
Reference Lagubeau, Fontelos, Josserand, Maurel, Pagneux and Petitjeans2012). The central height evolution of all test conditions is presented in figure 8(a). Notice that the low Reynolds number impacts
$\hat{t}_{0}$
, are approximately 0.492 and 0.429, respectively (Lagubeau et al.
Reference Lagubeau, Fontelos, Josserand, Maurel, Pagneux and Petitjeans2012). The central height evolution of all test conditions is presented in figure 8(a). Notice that the low Reynolds number impacts
 $Re<280$
, tend to a greater constant film thickness, while the high Reynolds number impacts, within the self-similar inertial regime, exhibit a very similar central height evolution. This becomes more apparent in the figure 8(a) inset, where the height is plotted on a logarithmic scale. This reveals the transition from the ballistic to the self-similar regime (5.6), and how the viscously influenced impacts (i.e. for
$Re<280$
, tend to a greater constant film thickness, while the high Reynolds number impacts, within the self-similar inertial regime, exhibit a very similar central height evolution. This becomes more apparent in the figure 8(a) inset, where the height is plotted on a logarithmic scale. This reveals the transition from the ballistic to the self-similar regime (5.6), and how the viscously influenced impacts (i.e. for
 $Re<280$
) deviate from the inertial height evolution (5.6). The central height is undoubtedly an important physical parameter, thus we now investigate the dependence of droplet force on central height.
$Re<280$
) deviate from the inertial height evolution (5.6). The central height is undoubtedly an important physical parameter, thus we now investigate the dependence of droplet force on central height.
In figure 8(b) the force profiles of all test conditions are plotted with respect to their central heights. It is apparent that a large increase in force occurs when the height is about 1 (i.e. near initial impact), reaching a peak around
 ${\hat{h}}_{c}=0.8$
. It is interesting to note that this height is approximately the height of a geometric dome (with vertical side walls) whose volume is equal to that of a sphere with equal radius. After reaching peak force, the force then decreases less rapidly as it approaches zero. Figure 8(b) also reveals the separation between inertial self-similar profiles and the ones affected by viscosity. The viscous profiles have a higher peak force and decreases more rapidly until reaching their constant film thickness. It is apparent that with decreasing Reynolds number, the peak force increases along with the constant film thickness, while tending towards a symmetric profile. Conversely, all of the inertial profiles tend towards an invariant profile, further supporting their self-similar nature.
${\hat{h}}_{c}=0.8$
. It is interesting to note that this height is approximately the height of a geometric dome (with vertical side walls) whose volume is equal to that of a sphere with equal radius. After reaching peak force, the force then decreases less rapidly as it approaches zero. Figure 8(b) also reveals the separation between inertial self-similar profiles and the ones affected by viscosity. The viscous profiles have a higher peak force and decreases more rapidly until reaching their constant film thickness. It is apparent that with decreasing Reynolds number, the peak force increases along with the constant film thickness, while tending towards a symmetric profile. Conversely, all of the inertial profiles tend towards an invariant profile, further supporting their self-similar nature.
The inertial force profile developed in § 4 equation (4.2), is plotted versus the ballistic (
 $1-\hat{t}$
) and inertial height (5.6) evolutions, with black-dashed and black-dotted lines, respectively. Notice that for early time, the profiles tend to follow the ballistic-dependent force (black-dashed line), while the long-time profiles tend toward the inertially dependent force (black-dotted line). The level of agreement between these predictions and the measurements further supports the force model (4.2).
$1-\hat{t}$
) and inertial height (5.6) evolutions, with black-dashed and black-dotted lines, respectively. Notice that for early time, the profiles tend to follow the ballistic-dependent force (black-dashed line), while the long-time profiles tend toward the inertially dependent force (black-dotted line). The level of agreement between these predictions and the measurements further supports the force model (4.2).
6 Conclusion
The impact force of liquid droplets on a flat rigid surface are measured across a wide range of Reynolds and Weber numbers, four and two decades, respectively. The experiments are conducted in a sub-atmospheric pressure environment as to inhibit air-drag-induced distortion, which allows the droplets to remain spherical upon impact. When plotted non-dimensionally, the force profiles exhibit a self-similar inertial and a viscous regime, distinguished solely by the Reynolds number. The measurements also show that the force profiles are invariant with respect to Weber number. For high
 $Re$
flows, the droplet impact process is inertially dominated as the only influential parameters are liquid density, impact velocity and droplet diameter. Interestingly, for inertially dominated impacts, the peak force occurs when the deformed droplet resembles a geometric dome with side-walls that are perpendicular to the impact plane. Furthermore, the experiments reveal an exponential post-peak decay in the force profile. This permits the long-time force behaviour to scale as
$Re$
flows, the droplet impact process is inertially dominated as the only influential parameters are liquid density, impact velocity and droplet diameter. Interestingly, for inertially dominated impacts, the peak force occurs when the deformed droplet resembles a geometric dome with side-walls that are perpendicular to the impact plane. Furthermore, the experiments reveal an exponential post-peak decay in the force profile. This permits the long-time force behaviour to scale as
 $\text{e}^{-t}$
, and is shown to be consistent with a lumped model approximation for the momentum transport from the droplet to the surface. Overall, a single, accurate model equation is constructed for the scaling of force profiles across a wide range of Reynolds and Weber numbers. This model incorporates the
$\text{e}^{-t}$
, and is shown to be consistent with a lumped model approximation for the momentum transport from the droplet to the surface. Overall, a single, accurate model equation is constructed for the scaling of force profiles across a wide range of Reynolds and Weber numbers. This model incorporates the
 $\sqrt{t}$
short-time behaviour analytically deduced by previous researchers and the well-supported linear dependence between
$\sqrt{t}$
short-time behaviour analytically deduced by previous researchers and the well-supported linear dependence between
 $F(t)$
and
$F(t)$
and
 $\text{d}F/\text{d}t$
, shown herein. This model is believed to provide a useful contribution owing to the ubiquitous occurrence of droplet impacts in nature and in industrial applications.
$\text{d}F/\text{d}t$
, shown herein. This model is believed to provide a useful contribution owing to the ubiquitous occurrence of droplet impacts in nature and in industrial applications.
Acknowledgement
This work has been performed with support from the US National Science Foundation through award CMMI-1462993.
Supplementary material
Supplementary material is available at https://doi.org/10.1017/jfm.2019.141.


