NOMENCLATURE
- CD
droplet particle drag coefficient
- D
droplet diameter, m
- g
gravity acceleration, m/s2
- Re
Reynolds number
- S
source term
- U
air phase velocity vector, m/s
- u
air phase velocity component, m/s
- V
droplet phase velocity vector, m/s
- v
droplet phase velocity component, m/s
- Γ
diffusion coefficient
- Φ
transport variable
- β
droplet collection efficiency
- μ
air dynamic viscosity, kg/(m·s)
- ρ
mass density, kg/m3
 $\bar \rho $
apparent droplet phase density, kg/m3
Subscripts
- a
air phase
- d
droplet phase
- i
ice phase
- w
water phase
- ∞
freestream
1.0 INTRODUCTION
With the continuously increasing demands for civil aviation transport, flight security problems, such as aircraft icing have become more and more important and gained intensive attention of many researchers. Ice accretions may occur on an aircraft during the take-off, landing or cruise stage owing to the impingement of supercooled droplets on the low-temperature surface. Since ice accretions on lifting surfaces, such as the wing and tail, may alter the originally designed aerodynamic configuration significantly, degraded flight performances like the stall angle decrease can be expected. Indeed, several severe flight crashes in recent years have been attributed to ice accretion.
Different types of ice accretion form under different icing conditions. In an environment with a fairly low temperature, the supercooled droplets all get frozen immediately upon their impingements on the substrate surface, resulting in regular, opaque ice shapes, called rime ice. If the temperature is high enough to allow a fraction of impinging droplets to still remain in liquid phase, runback water film then appears on the icing surface which gets frozen gradually as it flows downstream along the surface. As a consequence, a more irregular ice shape typically with ice horn formation is generated, which is usually classified as glaze ice.
The numerical simulation methodology plays an important role in investigating ice accretions. It is widely adopted due to its flexibility and economy thus making the exploration for the entire icing envelope possible. Based on the systematic and comprehensive understanding of the physical mechanism, more accurate predictions for ice accretion are available.
As the rime ice accretion is featured by its immediate and complete freeze phenomenon, obtaining an accurate prediction for local droplet collection efficiency is the key to successful simulation. In literature, two methods have been employed for this purpose: the Lagrangian method and the Eulerian two-phase flow method, corresponding to different model descriptions under the Lagrangian and Eulerian framework, respectively. The Lagrangian method focuses on the motion of one single droplet which is ruled by Newton's Second Law and solved by the ODE (Original Differential Equation) algorithms like the Runge-Kutta method to obtain its trajectory. With numerous droplets released from the far field upstream boundary, the local collection efficiency is calculated by considering those droplets whose paths intersect with the local surface segment. This approach requires less computational resource and effort and is commonly adopted by earlier icing codes, such as LEWICE code of NASA(Reference Ruff and Berkowitz1-Reference Wright3), TRAJICE code of DRA(Reference Gent4), the code of ONERA(Reference Hedde5,Reference Hedde and Guffond6) and the code of CIRA(Reference Mingione, Brandi and Esposito7-Reference Mingione and Brandi9). However, owing to the rapid development of the computational capabilities as well as the advanced CFD techniques, the Eulerian approach has gained more and more popularity(Reference Cao, Zhang and Sheridan10). It is based on the Eulerian two-phase flow theory with the droplet regarded as a pseudo-fluid phase(Reference Zhou11). The governing equations for the droplet mass and momentum conservation are established for a fixed control volume, which are similar to those for the air phase. The governing equations of the droplet phase are solved on the same mesh for the air flowfield solution. Once a converged solution has been obtained for the droplet flowfield, the local collection efficiency can be readily obtained according to the information in the control volume adjacent to the surface. This approach has an advantage over the Lagrangian approach, especially when complex, three-dimensional configurations are treated, for example, the multi-element wing(Reference Mingione, Brandi and Esposito7,Reference Cao, Guo and Chao12) and the engine inlet(Reference Shen and Lin13). The recently developed FENSAP-ICE code has employed the Eulerian approach in its droplet impingement calculation module(Reference Bourgault, Boutanios and Habashi14-Reference Beaugendre, Morency and Habashi16).
This paper presents a method to numerically simulate three-dimensional rime ice accretions on an aircraft wing based on the Eulerian approach for droplet impingement calculation. A permeable wall boundary condition has been proposed to give a proper depiction of the phenomenon of a droplet impinging on the surface, which has introduced an iterative treatment for this boundary condition. Once the droplet collection efficiency distribution has been obtained, the three-dimensional ice configuration can be generated under the assumption that droplets all get frozen at their impingement locations and that ice grows in the surface normal direction. For validation purposes, the rime ice accretion on a GLC-305 swept wing model under some specific conditions has been simulated. Comparison with the experimental data has demonstrated the capability of the current method. Furthermore, rime ice accretions under different flight conditions, namely, different angles of attack and different angles of sideslip, have been studied and analysed. Also investigated are the aerodynamic effects of the simulated rime ice accretions.
2.0 SOLUTION OF THE GOVERNING EQUATIONS FOR AIR-DROPLET FLOW
The governing equations for air-droplet flow are established according to the assumptions listed below:
1. The mass of supercooled droplets per unit volume (i.e. liquid water content) is small enough to have its influence on the airflow neglected.
2. The forces exerted on the droplet-phase only include the drag force, arising from its relative motion with respect to the air-phase, self-gravity and buoyancy.
3. The effect of the turbulent behavior of the airflow on droplet motion is not taken into account, that is, the fluctuation terms in the governing equations for droplet phase are omitted.
4. One single droplet is regarded as a sphere of the median volumetric diameter. Assume no collision, distortion, evaporation or any heat transfer occurs for the droplet phase.
5. Upon impingement, the entire droplet attaches to the surface without bounce or splash.
2.1 Solution of the governing equations for the air phase
The governing equations for the air phase are the same as before, based on Assumption 1 mentioned above. No coupling with the droplet phase enables these equations to be solved independently. Here we use the three-dimensional steady-state incompressible Reynolds-averaged Navier-Stokes equations with a k-ε turbulence model(Reference Jones and Launder17). Although well known, we will repeat them here in a conservative form of a generalised transport variable Φ.
where Φ stands for 1, ux, uy, uz, T, k and ε in the continuity equation, component momentum equations and scalar transport equations (i.e. energy, turbulent kinetic energy and turbulence dissipation rate) respectively. The symbols ρa, U, ![]() ${\Gamma _\Phi }$ and
${\Gamma _\Phi }$ and ![]() ${S_\Phi }$ denote the air density, air velocity vector, corresponding diffusion coefficient and source term, respectively.
${S_\Phi }$ denote the air density, air velocity vector, corresponding diffusion coefficient and source term, respectively.
As the air phase is assumed to be incompressible and only the steady state is of interest, the SIMPLE algorithm(Reference Patankar18) is adopted to deal with the pressure-velocity coupling. To ensure a bounded solution procedure, the convection terms are discretised using the MINMOD scheme(Reference Zhu and Rodi19). The physical boundary conditions specified for the air flowfield involve the following types:
1. Velocity inlet boundary: The velocity is set to be the free stream velocity while the turbulent kinetic energy k is determined as a fraction of the kinetic energy of the free stream and ε is then obtained by specifying the turbulent length scale.
2. Outflow boundary: Zeroth-order extrapolation is employed to determine the dependent variables and the velocity distribution is then scaled to satisfy the overall mass continuity.
3. Wall boundary: The no-slip condition is applied along with the standard wall function(Reference Launder and Spalding20).
2.2 Governing equations for the droplet phase
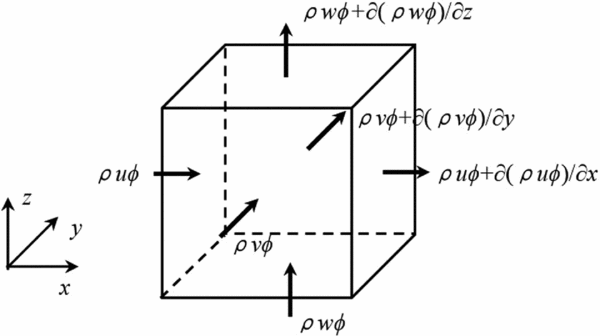
With the droplet regarded as a kind of pseudo-fluid, a fixed control volume is considered for the conservation of its mass and momentum as shown in Fig. 1. The governing equations of conservative form in the three-dimensional case can be readily written as:

Figure 1. Schematic of conservation laws for a fixed control volume.
Here ![]() $\bar \rho $, V,
$\bar \rho $, V, ![]() ${S_\Phi }$ denote the apparent density of the droplet phase (i.e. local liquid water content), droplet velocity vector and the source term, respectively. Φ is a generalised transport variable which represents 1, vx, vy, vz in the continuity equation and momentum component equations, respectively.
${S_\Phi }$ denote the apparent density of the droplet phase (i.e. local liquid water content), droplet velocity vector and the source term, respectively. Φ is a generalised transport variable which represents 1, vx, vy, vz in the continuity equation and momentum component equations, respectively.
Compared with the steady-state Euler equations for airflow, they indeed have the same form. The only difference exists in the detailed expressions for the source terms. According to the assumptions made above, the external forces imposed on the droplet phase only involve the drag force, self-gravity and buoyancy which can all be classified into the category of volume force. Thus, the source terms for the momentum equations are given as follows (assuming that y-axis points in the opposite direction of the gravity force):
where the symbols μ, ρw and D denote the molecular viscosity coefficient of air, density of water and droplet volumetric diameter, respectively, while CD and Red denote the drag coefficient and local Reynolds number for the droplet motion, respectively. The expression of Red can be written as:
An empirical formula has been adopted for evaluating the combined variable CDRed as follows(Reference Snellen, Boelens and Hoeijmakers21):
Note that the energy equation is not included here since it is redundant under the above assumptions and the temperature for one droplet particle will remain unchanged along its streamline.
2.3 Solution of the governing equations for the droplet phase
2.3.1 Boundary conditions for the droplet flowfield
The physical boundary conditions specified in the droplet flowfield calculation mainly involve the following types:
1. Farfield boundary: The velocity of droplet phase is set to be the same as the air free stream velocity with the droplet apparent density equal to the liquid water content of the free stream.
2. Outflow boundary: Zeroth-order extrapolation is employed to determine both the velocity and apparent density of droplet phase.
3. Wall boundary: A kind of permeable wall is proposed to properly depict the droplet impingement phenomenon on the wing surface(Reference Cao, Zhang and Sheridan10). The details will be given below.
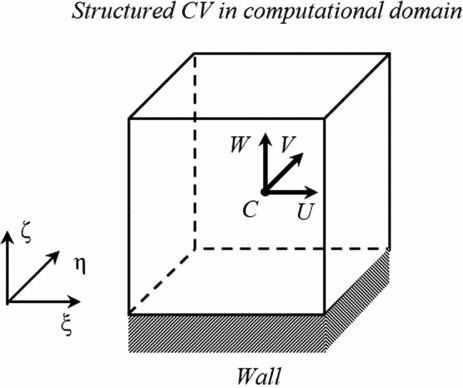
Since multi-block structured grid with finite volume discretisation is used for flowfield calculation, the physical domain needs to be transformed into the computational domain in which a cubic control volume adjacent to the wall is illustrated in Fig. 2. Corresponding contravariant velocity components have been indicated at the center. From this figure, it is clear that only the component W, which is perpendicular to the wall, determines the occurrence of droplet impingement. Thus, this wall boundary is treated in different ways according to the sign of the contravariant velocity component W.

Figure 2. A transformed cubic control volume adjacent to the wall in computational domain.
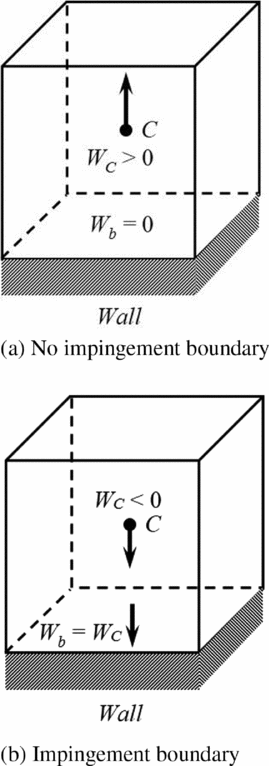
(1) For non-negative Wat the centre, which implies no impingement occurs, both the mass and momentum fluxes through the bottom face of the control volume (coincide with the wall) are set to zero. As a consequence, the boundary value for the primitive variables, namely, the apparent density and velocity components, does not matter.
(2) For the case of negative W, droplet impingement on the wall should be expected. Based on Assumption 5 mentioned at the beginning of this section, there is no information propagated from the wall into the surrounding droplet flowfield. Thus, the extrapolated boundary condition is appropriate for this case. The zeroth-order extrapolation is used to specify the boundary values of all the primitive variables.
The illustration for the permeable wall boundary condition is given in Fig. 3.

Figure 3. Illustration for the permeable wall boundary condition.
2.3.2 Solution procedure for the droplet flowfield
Though steady-state governing equations are given above, we will consider their transient counterparts, and a local time marching procedure is adopted to accelerate the convergence to the steady-state solution(Reference Sherrie, Robert and Christopher22). The discretised form of droplet-governing equations in the body-fitted curvilinear coordinate system is as follows:
Here Q stands for the conservative variables, namely, the apparent density ![]() $\bar \rho $ and the product variables
$\bar \rho $ and the product variables ![]() $\bar \rho {v_i}$, which are solved directly in the solution procedure. U, V and W denote the droplet-contravariant velocity components in the computational coordinate frame while J is the Jacobi factor. Note that the source term for the momentum equation can be readily linearised with SQ being negative to improve the diagonal dominance of the resulting matrix. The face values of the dependent variables are still determined through the MINMOD scheme with deferred correction method employed(Reference Khosla and Rubin23). Finally, it should be mentioned that as the solution for the droplet flowfield is an iterative process, the permeable wall boundary condition needs to be updated after each outer iteration according to the new value of W at the near-wall control volume centre.
$\bar \rho {v_i}$, which are solved directly in the solution procedure. U, V and W denote the droplet-contravariant velocity components in the computational coordinate frame while J is the Jacobi factor. Note that the source term for the momentum equation can be readily linearised with SQ being negative to improve the diagonal dominance of the resulting matrix. The face values of the dependent variables are still determined through the MINMOD scheme with deferred correction method employed(Reference Khosla and Rubin23). Finally, it should be mentioned that as the solution for the droplet flowfield is an iterative process, the permeable wall boundary condition needs to be updated after each outer iteration according to the new value of W at the near-wall control volume centre.
3.0 THREE-DIMENSIONAL RIME ICE PREDICTION
3.1 Local droplet collection efficiency
Once the droplet flowfield solution has converged, the droplet impingement property can be readily obtained from the flowfield information in the control volume just adjacent to the wall surface. With the normal droplet velocity vnw and apparent density ![]() ${\bar \rho _w}$ on the wall boundary known, the local droplet collection efficiency is defined by the formula below:
${\bar \rho _w}$ on the wall boundary known, the local droplet collection efficiency is defined by the formula below:
where, the symbols LWC, v∞ denote the free stream liquid water content and droplet velocity, respectively. Thus, the mass flux of impinging droplets can be calculated as:
3.2 Rime ice shape generation
As mentioned above, due to the sufficiently low temperature considered in the rime ice regime, impinging droplets get frozen immediately and completely at their impingement locations without any runback water. Therefore, the mass of ice accreted at a certain location is equal to that of impinging droplets. Assuming that ice accretes in the direction normal to the surface, the ice height formed during a time interval ΔT can be calculated as
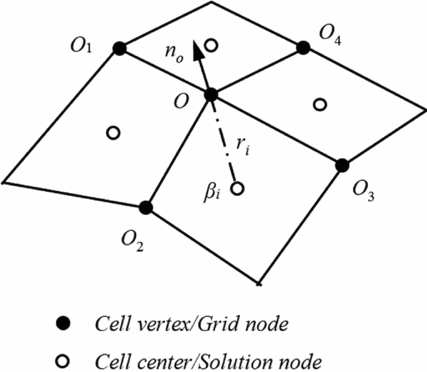
Keeping in mind that the grid points of the surface mesh, i.e. the mesh cell vertices, locate right on the wall surface while the centroid of the surface cell may not, deformation of the icing surface should be made through manipulating those grid points. However, in our flowfield calculations, the centroid-based scheme has been employed thus some transformation is needed to determine the ice height at each cell vertex. From Equations (10) and (11) it is clear that, during a given time interval, the local ice height is only determined by the local droplet collection efficiency β and the problem now reduces to determine the local collection efficiency value at the cell vertex. Inverse distance weighted averaging between the centre values of those cells sharing the vertex is adopted. The expression is given below with the symbols illustrated in Fig. 4.

Figure 4. Determination of droplet collection efficiency and ice growth direction at grid node.
 $$\begin{equation}
{\beta _o} = \frac{{\sum\limits_i {r_i}^{ - 1}{\beta _i}}}{{\sum\limits_i {r_i}^{ - 1}}}
\end{equation}$$
$$\begin{equation}
{\beta _o} = \frac{{\sum\limits_i {r_i}^{ - 1}{\beta _i}}}{{\sum\limits_i {r_i}^{ - 1}}}
\end{equation}$$Finally, the displacement of the grid vertex is made along the local outward normal vector no, which can be obtained by
3.3 Rime ice simulation procedure
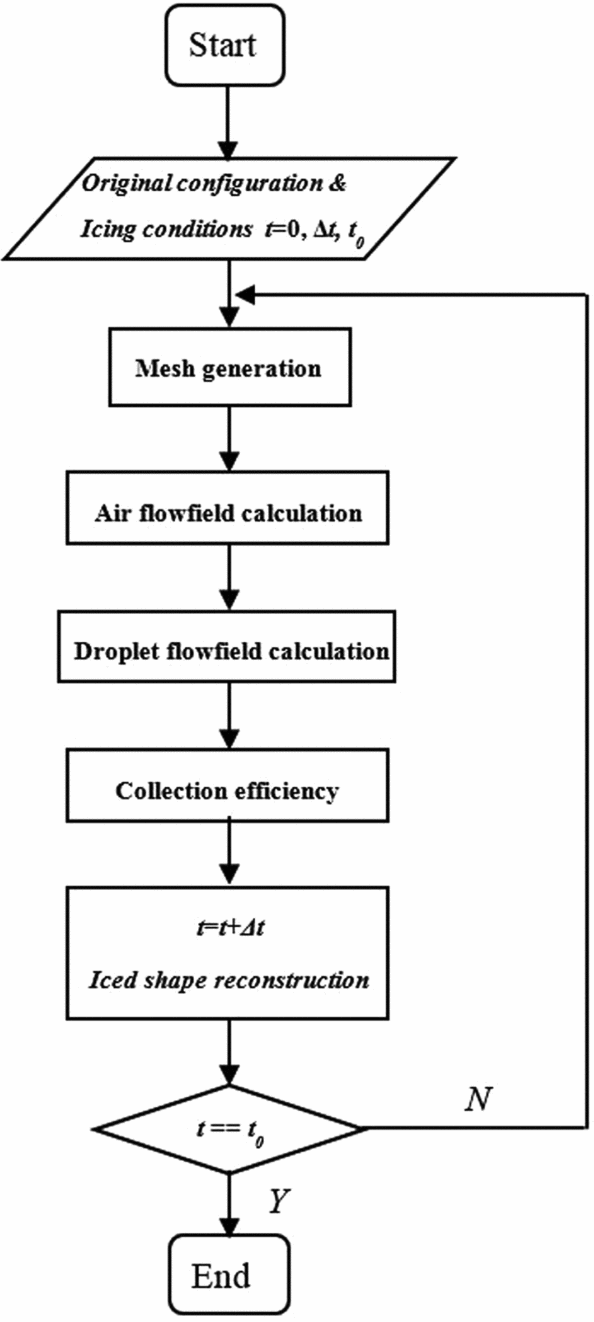
As ice accreted on the surface has changed the original body configuration thus having an influence on the surrounding air-droplet flowfield, the ice accretion is actually a time-varying process. The pseudo-steady assumption is only valid when the influence of the iced shape on the flowfield is not so much that the change in the local droplet collection efficiency can be neglected. To obtain better accuracy, a multi-step ice growth procedure is performed in this paper and the flow chart is given in Fig. 5.

Figure 5. Flow chart for multi-step simulation procedure.
4.0 RESULTS AND ANALYSIS
4.1 Method validation
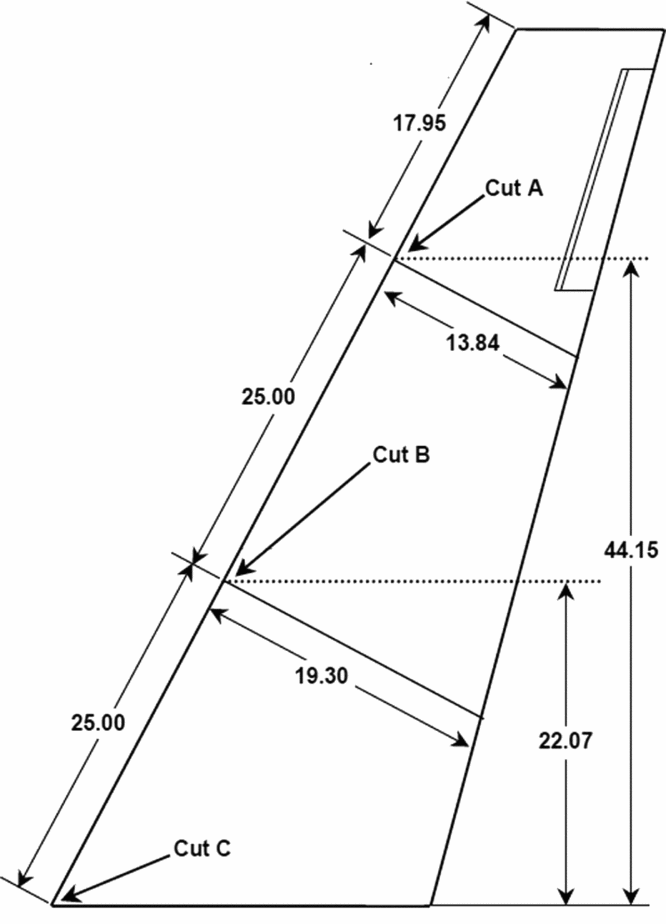
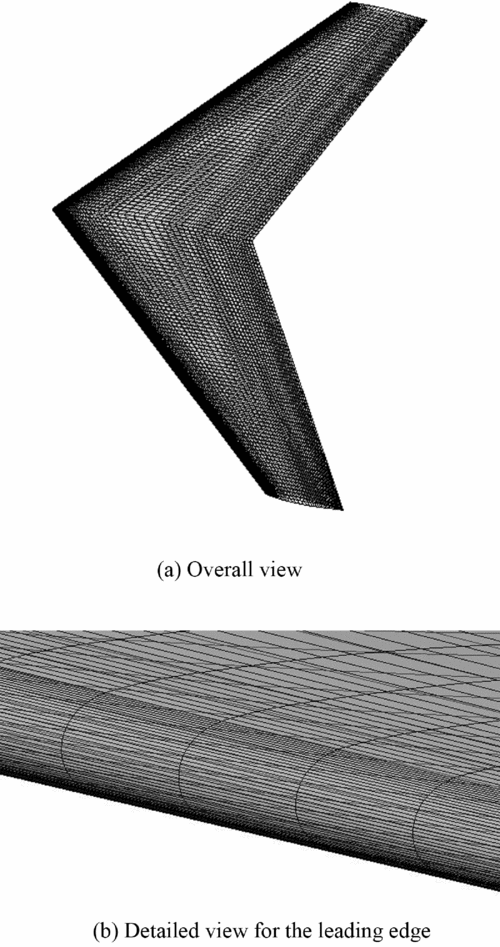
For the purpose of validation of the current method, three-dimensional rime ice accretion under some specific conditions on a GLC-305 swept wing model has been simulated and compared with the corresponding experimental data and LEWICE results at the three characteristic sections(Reference Papadakis, Yeong, Wong, Vargas and Potapczuk24). In addition, the effects of angle-of-attack as well as sideslip on rime ice accretion have been investigated and analysed with some important conclusions drawn for flight security in icing environment. Figure 6 gives the detailed half-span planform for the GLC-305 wing model. Also labelled are the locations for the three characteristic sections. Figure 7 shows the computational mesh on the wing surface, based on whose vertices the ice shape is generated.

Figure 6. Detailed half-span planform for the GLC-305 wing model with three characteristic cuts (all dimensions in inches).

Figure 7. Computational mesh on the wing surface.
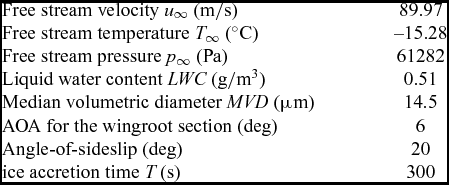
The icing conditions adopted for the validation case are listed in Table 1.
Table 1 Icing conditions for the validation case
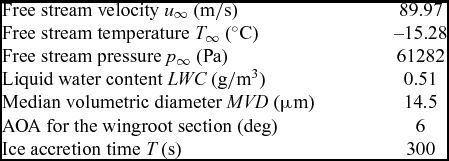
As mentioned above, the whole ice accretion process is divided into several sub-processes, each with an appropriate time interval. Here three sub-processes are simulated in sequence with each lasting for 100 seconds during which both the air and droplet flowfields are treated as steady.
Figure 8 shows the distribution of local droplet collection efficiency on the icing surface in each sub-process. Only one half span is given in this figure due to its symmetry characteristic. It is clear that through (a) to (c) the value for the collection coefficient at the tip is larger than that near the root. This phenomenon can be interpreted as a combination of leading-edge curvature variation (corresponding to local chord size) and backward sweep. And the latter one can only be taken into account through direct modelling and simulation for three-dimensional objects. In addition, by comparison of the distribution patterns for the three sub-processes, it can be found that, as ice accretes, the impingement region moves downward while the area with high droplet collection coefficient gets broader.

Figure 8. Local droplet collection efficiency distribution on the icing surface in each sub-process.
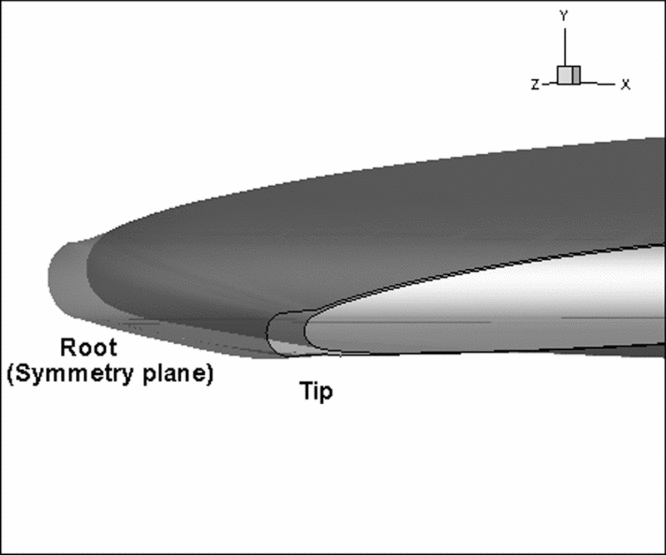
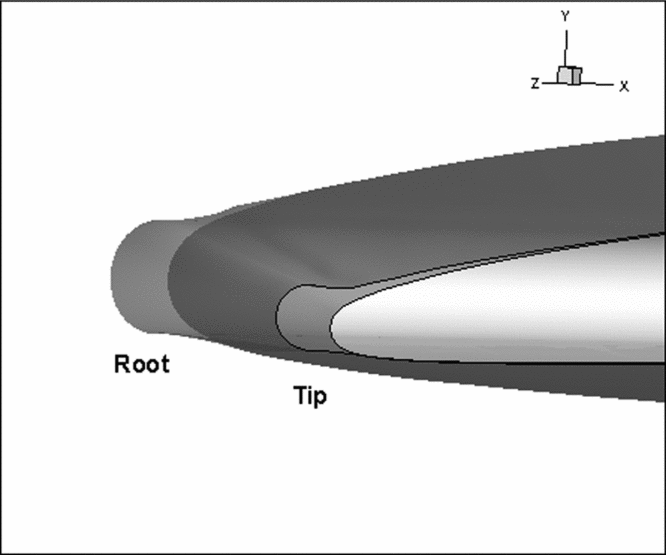
Figure 9 shows the predicted three-dimensional rime ice configuration finally formed at the leading edge. For validation purposes, the predicted ice shapes at the three characteristic sections are given in Fig. 10 as well as the experimental data and LEWICE results. It is clear that the current results are in better agreement with the experimental data in the ice-growth pattern and total amount. In fact, as the LEWICE results are based on simulation for two-dimensional aerofoil ice accretions, the three-dimensional flow features have been omitted, thus resulting in deviation in the impingement property evaluation.

Figure 9. Predicted result of the three-dimensional rime ice configuration at the leading edge.

Figure 10. Predicted ice shapes at the three characteristic sections compared with experimental data and LEWICE results.
Furthermore, Fig. 11 shows the evolution of sectional ice shapes corresponding to the multi-step simulation procedure. As can be seen from this figure, the ice accretion is getting more severe with ice growth especially near the wing tip, which is in accordance with the variation in collection efficiency distribution mentioned before. Hence, it is important and necessary to de-ice the aircraft surface before it takes off.

Figure 11. Evolution of sectional ice shapes for the multi-step simulation procedure.
4.2 Effect of flight conditions on rime ice accretion
4.2.1 Angle-of-attack
Now we keep the same parameters as in the previous case but only change the angle-of-attack to 0°. For clarity and completeness, the current icing conditions are listed in Table 2.
Table 2 Icing conditions for the case with angle-of-attack altered
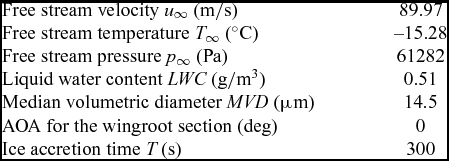
The three-dimensional ice configuration and ice shapes at the three characteristic sections are given in Figs 12 and 13, respectively. Keeping in mind that the current ice accretion is still symmetric about the root section plane, it is enough to treat the half span of the wing model. By comparing the corresponding sectional ice shapes in Figs 10 and 13, it can be seen that the ice accretion region has moved towards the upper surface. However, due to the discharge effect of the three-dimensional flow and the consequent induced velocity, the effect of angle-of-attack on ice accretion is not as significant as that for two-dimensional cases. This is illustrated by examining the LEWICE results based on the two-dimensional simulation given in Fig. 10(c).

Figure 12. Predicted three-dimensional rime ice configuration at the leading edge at 0° angle-of-attack.

Figure 13. Predicted sectional ice shapes at 0° angle-of-attack.
4.2.2 Angle-of-sideslip
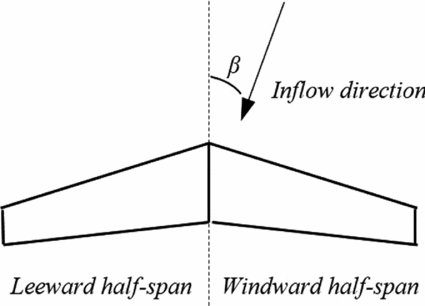
One of the advantages of the direct three-dimensional simulation approach is that the flight conditions with sideslip can be treated straightforwardly without any simplification or assumption adopted for pseudo-three-dimensional simulation. Indeed, ice accretions occurring under sideslip conditions are expected to be a more serious threat to flight security on account of asymmetric ice configuration and more severe ice accretion on the windward half-span. Here the windward/leeward half-span is specified according to the sideslip direction, as illustrated in Fig. 14. We choose a moderate sideslip angle, namely, 20° for simulation. The other conditions remain the same as the validation case and are listed in Table 3.

Figure 14. Illustration for windward/leeward half-span specification.
Table 3 Icing conditions for the case with moderate sideslip angle

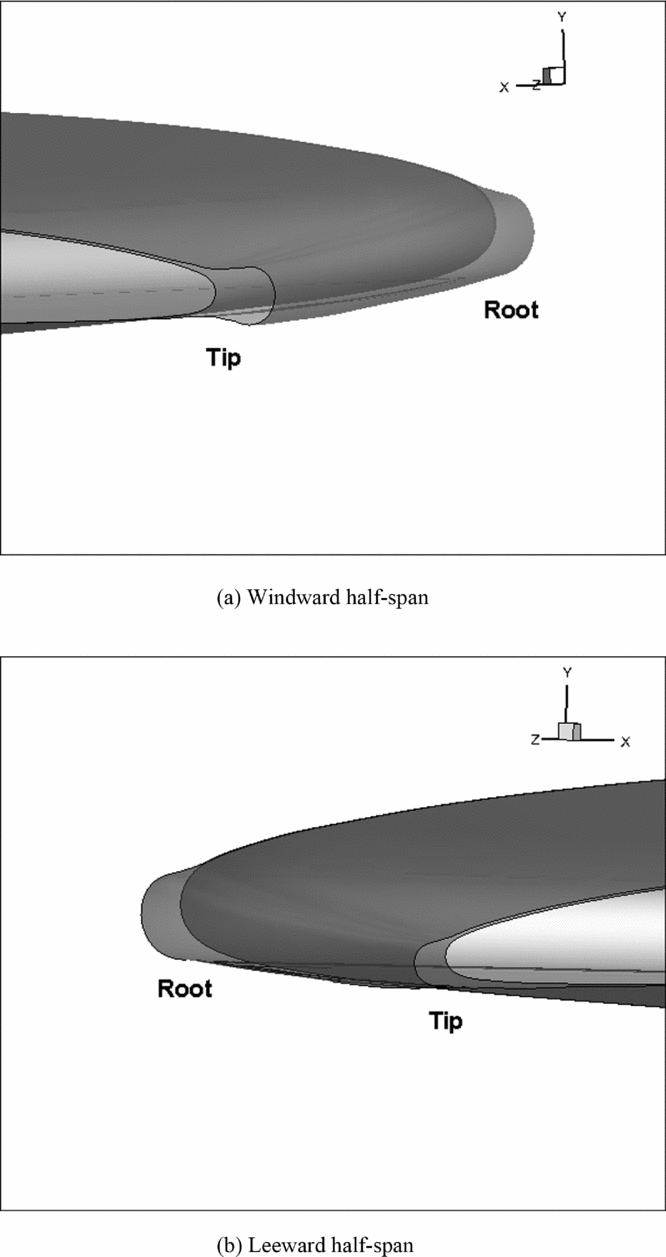
Figures 15(a) and (b) show the predicted ice configuration at the leading edge of the windward and leeward half-span, respectively. To make it clearer, the ice shapes at the characteristic section A on both sides are given in Fig. 16 for comparison. Note that both the icing area and the ice thickness on the windward side are larger than those on the other side, along with the ice growth pattern tending more toward the upper surface. As a consequence, pilots should avoid sideslip as far as possible when they are facing an icing environment.

Figure 15. Predicted three-dimensional rime ice configuration at the windward/leeward half-span leading edge in sideslip flight.

Figure 16. Predicted ice shapes at section A on windward/leeward side.
4.3 Aerodynamic effects analysis
With the ice accretion on the leading edge, the original geometry of the wing has been changed, thus bringing about some effects on aerodynamic performance. Figure 17 shows the pressure contour plot on the section corresponding to the mean aerodynamic chord (MAC) along with the streamlines around the leading edge for the validation case. By comparing Figs 17(a) and (b), it can be found that both the suction side and the pressure side have a more severe variation in the pressure coefficient about the extreme value with the accreted ice adhered to the leading edge. This can be interpreted by the leading edge curvature variation due to the ice accretion. The ice accretions formed in the other two cases with different flight conditions have similar influences on the surrounding air flowfield.

Figure 17. Pressure contour and streamlines plot for the MAC section of the clean and iced wing of the validation case.
The lift and drag coefficient values, i.e. CL and CD, for the iced wing of each case studied as well as the clean one under an angle-of-attack of 6° without sideslip are given in Table 4. The lift coefficient remains almost the same while the drag coefficient is increased by about 10% for each case simulated. Also given are the experimental data in Reference Papadakis, Yeong, Wong, Vargas and PotapczukRef. 24 which exhibit similar variations of the aerodynamic force coefficients. Since the rime ice configuration is regular, the loss in aerodynamic performances is not significant. But it needs to be emphasised that although it seems to have little effects on the longitudinal aerodynamics, the ice accretion formed under sideslip conditions can affect the lateral aerodynamics more significantly.
Table 4 Effects of ice shapes on CL and CD

*LS denotes the smooth LEWICE ice shape.
1 – Validation case; 2 – Case with angle-of-attack altered; 3 – Case with sideslip.
5.0 CONCLUSIONS
This paper presents a complete procedure for directly simulating three-dimensional rime ice accretions. Some conclusions can be drawn from an investigation of rime ice simulations on a swept wing model as follows:
1. Eulerian approach based on the two-phase flow theory has an advantage in droplet impingement calculation over the Lagrangian one especially when an object of three-dimensional, complicated configuration is treated. The permeable wall boundary condition not only depicts the droplet impingement phenomenon more properly but also has been found to further stabilise the solution procedure in computational practice.
2. In spite of regular ice shapes, multi-step growth procedure is still recommended in rime ice simulation as it can give an accurate prediction of the ice shape near the limits. The time interval chosen for each step should be determined as a compromise between accuracy and efficiency.
3. Ice accretions under different flight conditions have been studied. Although the angle-of-attack still affects the ice accretion region, its influence has become weakened due to three-dimensional flow features. It is worth noting that severe ice accretion may occur under sideslip conditions and it should be simulated in a direct manner due to its intrinsic nature.
4. Direct simulation for three-dimensional ice accretions on an aircraft wing can naturally take the flow in span-wise direction into consideration. The span-wise flow is significant in conditions of large swept angle or sideslip flight. In these cases, traditional numerical methods based on two-dimensional simulation may result in large errors. Thus, direct three-dimensional approaches are in urgent need of development.


