Introduction
Paranoia is a central symptom of psychosis. Delusions of reference and delusions of persecution occur in at least 50% of cases of schizophrenia (Sartorius et al. Reference Sartorius, Jablensky, Korten, Ernberg, Anker, Cooper and Day1986; Cutting, Reference Cutting1997). However, paranoid thoughts also occur in the non-clinical population (e.g. Verdoux et al. Reference Verdoux, Maurice-Tison, Gay, van Os, Salamon and Bourgeois1998; Peters et al. Reference Peters, Joseph and Garety1999; Martin & Penn, Reference Martin and Penn2001; Freeman et al. Reference Freeman, Dunn, Garety, Bebbington, Slater, Kuipers, Fowler, Green, Jordan and Ray2005a, Reference Freeman, Garety, Bebbington, Smith, Rollinson, Fowler, Kuipers, Ray and Dunnc). At least 10–15% of the general population regularly experience paranoid thoughts (Freeman, Reference Freeman2007). Increasingly there are studies of paranoia across the continuum of severity (see reviews by Bentall et al. Reference Bentall, Corcoran, Howard, Blackwood and Kinderman2001; Freeman, Reference Freeman2007; Garety et al. Reference Garety, Bebbington, Fowler, Freeman and Kuipers2007). However, current research lacks a measure that is both specific to paranoid thoughts and reliable and valid for both clinical and non-clinical groups.
Clarifying a definition of ‘paranoia’
Single-symptom research requires confidence that researchers are isolating the same elements of psychopathology and thus clear definitions of the phenomenon of interest are needed. This has been addressed specifically for persecutory delusions by criteria proposed by Freeman & Garety (Reference Freeman and Garety2000). For individuals to hold persecutory beliefs, they must believe that harm is occurring, or is going to occur to them and that the persecutor has the intention to cause that harm. Ideas of reference are specifically excluded because they do not contain the element of intention to harm. Nonetheless ideas of reference and persecution are often related. It has been suggested that a ‘hierarchy’ of paranoia exists, extending from mild social evaluative concerns, through ideas of social reference, to persecutory beliefs concerning, mild, moderate and severe threat (Freeman et al. Reference Freeman, Garety, Bebbington, Smith, Rollinson, Fowler, Kuipers, Ray and Dunn2005c). Startup & Startup (Reference Startup and Startup2005) have defined delusions of reference by themes of observation (ideas relating to surveillance and gossip of the individual) and communication (ideas relating to the communication of information about the individual, e.g. through hints, double meanings, on the TV, newspaper headlines, radio, etc.) and found that observation beliefs (i.e. ideas relating to more interpersonal concerns), were particularly associated with persecutory delusions. It is therefore important that persecution and social reference are considered within the spectrum of ‘paranoia’.
Existing measures of paranoia
There are a number of questionnaire assessments of paranoia, but the most widely used is the Fenigstein & Vanable (Reference Fenigstein and Vanable1992) Paranoia Scale (PS). It was developed to assess ideas ‘reminiscent of paranoia’. It is therefore a scale with a broad conception of paranoia. Many items are not overtly persecutory, and reflect more depressive themes (e.g. ‘My parents and family find more fault with me than they should’; ‘I'm sure I get a raw deal from life’). In addition to item content concerns, we would argue that paranoid ideas are not all-or-nothing occurrences but phenomena that vary along a number of dimensions (e.g. Brett-Jones et al. Reference Brett-Jones, Garety and Hemsley1987; Garety & Hemsley, Reference Garety and Hemsley1987; Peters et al. Reference Peters, Joseph and Garety1999). The key dimensions are conviction, preoccupation and distress. Current measures of paranoia do not make distinctions between dimensions and, furthermore, are rarely devised with both clinical and non-clinical populations in mind. The measures have also not been devised for assessing change in levels of paranoia.
We argue that there is a need for a new measure of paranoia – one that is specific to current definitions (Freeman & Garety, Reference Freeman and Garety2000), dimensional in terms of content (i.e. considers a hierarchy of paranoid thoughts) and severity (assesses preoccupation, conviction and distress), is valid and reliable for both clinical and non-clinical populations and is sensitive to clinical change. This was the rationale for the development of the Green et al. Paranoid Thought Scales (GPTS). It is predicted that the GPTS will have associations with the PS (Fenigstein & Vanable, Reference Fenigstein and Vanable1992) and dimensional aspects of the Peters et al. Delusions Inventory (PDI; Peters et al. Reference Peters, Joseph and Garety1999) and Psychotic Symptom Rating Scales (PSYRATS; Haddock et al. Reference Haddock, McCarron, Tarrier and Faragher1999). Further, because existing research indicates an association between paranoia and depression and anxiety (e.g. Johns et al. Reference Johns and van Os2004; Freeman et al. Reference Freeman, Garety, Bebbington, Slater, Kuipers, Fowler, Green, Jordan, Ray and Dunn2005b, Reference Freeman, Garety, Bebbington, Smith, Rollinson, Fowler, Kuipers, Ray and Dunnc; Startup et al. Reference Startup, Freeman and Garety2007), associations between the GPTS and Beck Depression Inventory (BDI; Beck et al. Reference Beck, Steer and Brown1996) and Beck Anxiety Inventory (BAI; Beck et al. Reference Beck, Epstein, Brown and Steer1988) are also anticipated. Finally in line with current evidence, the relationship between ideas of social reference and persecution is predicted to reflect a ‘hierarchy’ of paranoid ideas (Freeman et al. Reference Freeman, Garety, Bebbington, Smith, Rollinson, Fowler, Kuipers, Ray and Dunn2005c).
Method
Construction of an item pool for GPTS development
Item selection
Ninety-five items formed the initial pool. Initially 30 statements of paranoid thinking (15 ideas of social reference and 15 ideas of persecution) were generated by examining existing measures that incorporate paranoid items and by drawing on the clinical experience of the research group. The measures were the PS (Fenigstein & Vanable, Reference Fenigstein and Vanable1992), the Paranoia and Suspiciousness Questionnaire (PSQ; Rawlings & Freeman, Reference Rawlings and Freeman1996), the PDI (Peters et al. Reference Peters, Joseph and Garety1999), the Schizotypal Personality Questionnaire (SPQ; Raine, Reference Raine1991); the Oxford-Liverpool Inventory of Feelings and Experiences (O-Life; Mason et al. Reference Mason, Claridge and Jackson1995), the Paranoia Checklist (Freeman et al. Reference Freeman, Dunn, Garety, Bebbington, Slater, Kuipers, Fowler, Green, Jordan and Ray2005a), the State Social Paranoia Scale (Freeman et al. Reference Freeman, Pugh, Green, Valmaggia, Dunn and Garety2007) and the Schedules for Clinical Assessment in Neuropsychiatry (SCAN; WHO, 1992). No item generated was identical to that of an existing measure, although content was similar in some cases. Consistency in the content of the new items was ensured by generating persecutory items in line with Freeman & Garety's (Reference Freeman and Garety2000) criteria and ideas of social reference in line with probes from the SCAN and criteria building on the work of Startup & Startup (Reference Startup and Startup2005): ‘The person holds the belief that some neutral event has special personal significance/refers to them personally by means of observation or communication by another’.
An aim of the GPTS was to incorporate the dimensions of belief strength (conviction), preoccupation and distress. In an attempt to keep the measure simple to complete, without the use of additional flanking scales, these dimensions were incorporated into the initial 30 statements selected for content. For example, ‘I was convinced someone wanted to harm me’. Ten items reflecting each of the dimensions were generated for persecutory statements and 10 items for each of the dimensions were also generated for social reference statements.
In addition, items were also included without conviction, preoccupation and distress dimensions (i.e. simple statements of social reference and statements of persecution), e.g. ‘People have been dropping hints for me’, ‘Certain individuals have had it in for me’, and items which reflected an idea of reference but ‘built-in’ a statement of intent, e.g. ‘People wanted me to feel threatened, so they stared at me’. These items were included as attenuations of stronger persecutory beliefs.
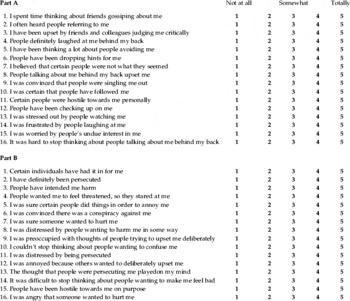
In total 95 items formed the initial pool administered to a development sample. Each item was scored on a five-point Likert scale (from ‘Not at all’, through ‘Somewhat’ to ‘Totally’). Individuals were asked to complete the items in reference to the preceding month.
Participants
The main development sample totalled 403 individuals. Fifty of these individuals had a current persecutory delusion at the time of participating (as defined by Freeman & Garety, Reference Freeman and Garety2000) and were in contact with services with a current diagnosis of a psychotic illness (i.e. schizophrenia, schizo-affective disorder, delusional disorder, psychotic depression, bipolar affective disorder confirmed by case-note review). The remaining 353 individuals had no history of mental illness, which was confirmed when they were approached for their participation.
Clinical sample
Individuals with a current persecutory delusion (as defined by Freeman & Garety, Reference Freeman and Garety2000) that rated mild to severe on the Scale for Assessment of Positive Symptoms (SAPS; Andreasen, Reference Andreasen1984), elicited by probes from the SCAN, and a diagnosis of psychosis were invited to take part in the study. Further inclusion criteria were: aged 18–65 years; English as a first language; and the absence of a history of brain injury, the absence of a known organic cause to their psychosis and the absence of a primary diagnosis of drug or alcohol dependency (confirmed by case-note review and discussion with clinical team).
Sixty-seven individuals were approached via in-patient and community mental-health services. These were individuals either referred to the study by a member of their clinical team or by identifying them through clinical notes. Ten refused to participate and seven did not meet the delusion score criteria. This left a sample of 50 patients with persecutory delusions who were in contact with services. Thirty-one individuals were in-patients on acute wards (21 voluntary, 10 under section) and 18 individuals were out-patients being treated in the community. Twenty-four individuals had suffered a relapse in their mental state in the 3 months preceding assessment, and all 50 individuals were on a medication regime at the time of testing. Clinical diagnoses were varied: 33 individuals were diagnosed with paranoid schizophrenia, three with schizo-affective disorder, five with bipolar-affective disorder, five with delusional disorder and four with psychotic depression. There were 34 male and 16 female participants – with an age range of 19–62 years (mean=43.2, s.d.=12.4). The majority of the group were white (n=43) and unemployed (n=45).
Non-clinical sample
Individuals aged 18–65 years, literate, with English as a first language, but without a history of mental illness were invited to participate. Individuals working or studying at King's College London and the Open University were approached by a circular email. In total, 405 individuals [King's College London (n=337), Open University (n=68)] gave consent to participate and 353 returned complete datasets.
The 353 individuals who returned completed data ranged in age from 18 to 60 years (mean=26.1, s.d.=8.9). In total, 242 were female (68.6%) and 111 male (31.4%). The majority were white (77.4%) and had completed A-Level education (81%). Individuals who did not return complete datasets, and were therefore excluded from further analysis did not differ significantly in age, sex, ethnicity or education from those who were included in the development sample. Exact response rates are not available since this sample was collected by circular email. Circular emails are estimated to reach 31 400 individuals at King's College London. The 337 individuals who initially consented to participate from King's College London therefore represent a response rate of approximately 1.1%.
Procedure
Time point 1 (T1: baseline)
All participants were administered the pool of paranoid items (endorsing them on a five-point likert scale from ‘Not at all’ to ‘Totally’) and four other self-report measures in order to assess concurrent and convergent validity. The experimenter sat with patients whilst they completed the measures. The clinical group's persecutory beliefs were also assessed on PSYRATS (Haddock et al. Reference Haddock, McCarron, Tarrier and Faragher1999). The non-clinical sample was provided with access to the measures online using the internet or via the post. Measure completion was timed.
T1: Self-report measures
Paranoia Scale (PS; Fenigstein & Vanable, Reference Fenigstein and Vanable1992)
The PS is a 20-item self-report trait measure of paranoid ideation developed for use in the general population. Scores may range from 20 to 100, with higher scores indicating higher levels of paranoia. In the original development sample, a mean score of 42.7 (s.d.=10.2) is quoted. The data suggested a single, general factor of paranoia with a Cronbach's α of 0.84 indicating good internal consistency. The test–retest correlation was 0.70 confirming good stability.
Beck Depression Inventory II (BDI-II; Beck et al. Reference Beck, Steer and Brown1996)
The BDI-II is a well-established 21-item scale designed to measure the presence and severity of depressive symptoms within the last 2 weeks. Scores range from 0 to 63 with higher scores indicating higher levels of depression.
Beck Anxiety Inventory (BAI; Beck et al. Reference Beck, Epstein, Brown and Steer1988)
The BAI was developed to measure anxiety, independently of depression, whilst preserving convergent validity. The scale consists of 21 items. Scores may range from 0 to 63 with higher scores indicating higher levels of anxiety. Items are endorsed for the last week only.
Ten items from the Peters et al. Delusions Inventory (PDI; Peters et al. Reference Peters, Joseph and Garety1999)
This measure has been designed to measure delusional ideation in the normal population. The presence of a particular belief is confirmed by answering ‘yes’ to a statement of experience. An assessment of distress, preoccupation and conviction is made for each positively endorsed statement on Likert scales from 1 to 5. Higher scores indicate higher levels of distress, preoccupation and distress. The 10 items administered as part of the current study were selected from the ‘persecution’, ‘suspiciousness’ and ‘paranoid ideation’ components of the measure.
Psychotic Symptom Rating Scales (Delusions Subscale) (PSYRATS; Haddock et al. Reference Haddock, McCarron, Tarrier and Faragher1999)
The PSYRATS is an interview-based measure designed to measure a number of different dimensions of delusions in relation to the last week, i.e. amount and duration of preoccupation, intensity of distress, conviction and disruption of life associated with the persecutory delusion. These items are rated by the interviewer on a five-point scale (0–4), with higher scores reflecting greater preoccupation, conviction and distress.
Time point 2 (T2: test–retest)
A total of 164 individuals from the baseline non-clinical sample volunteered to be contacted again 2 weeks later to complete the 95 GPTS pool items for a second time. All returned complete datasets.
Time point 3 (T3: clinical change)
Thirty individuals from the clinical group agreed to be contacted at 6 months following their initial assessment in order to complete the 95 pool items for a second time, and for current levels of persecutory delusions to be assessed on PSYRATS.
Analysis
The 95 items administered to the development sample were first examined for endorsement across the two samples before being investigated for factor structure. Following a factor analysis using oblique rotation, the item pool was reduced to two 16-item scales, one reflecting ideas of social reference and one ideas of persecution. Items were considered for inclusion in these scales by examining item-scale correlation, item variance, the level of item endorsement; and an item's ability to discriminate between non-clinical and clinical groups. Full details are provided below. Data are then presented exploring the reliability and validity of the scales (all correlations reported are two-tailed and Mann–Whitney U tests are presented to compare scores between the clinical and non-clinical groups), their sensitivity to clinical change and the relationship between ideas of reference and persecution.
Results
Extracting the Paranoid Thought Scales (GPTS)
Percentage endorsement (endorsement referring to a score of ⩾2) of the 95 pool items ranged from 7.4% to 78.7% across both samples, with a mean endorsement of 30% (s.d.=13.2%). Items with endorsement below 10% (n=2) were eliminated before conducting any further analysis. The Cronbach's α coefficient of the remaining 93 items was found to be high for both the non-clinical sample (α=0.98) and the clinical sample (α=0.97) indicating extremely good internal consistency at this stage. The range of item-scale correlations for the 353 complete non-clinical cases ranged from 0.44 to 0.79.
Item scores (93 items only) for the 353 non-clinical cases were submitted to a principal components analysis (PCA) with scree plot. The Kaiser–Meyer–Olkin measure of sampling adequacy was 0.96 and Bartlett's test of sphericity was highly significant [χ2(4278)=31555.5, p<0.0001] indicating the data were suitable for a PCA.
Using Cattell's (Reference Cattell1966) criterion a scree plot suggested the data were best described by two components, explaining 49.7% of the variance in the sample. Two components were therefore extracted using an oblique rotation. Component 1 comprised 60 items and explained 44.2% of the variance in the sample. Forty-three out of these 60 items fitted Freeman & Garety's (Reference Freeman and Garety2000) definition of persecution and therefore this component was labelled ‘persecution’. Component 2 comprised 33 items, explaining 5.5% of the variance in the sample. Twenty-two of the 33 items were considered to reflect ideas of social reference and so this component was labelled as such.
Two scales were therefore derived, one reflecting ideas of social reference and one reflecting ideas of persecution. Items were selected by considering a number of attributes: the overall face validity of the scales (i.e. inclusion of items that were varied in content); the need to reflect multiple dimensions (conviction, preoccupation and distress); factor loading (above 0.4); item-scale correlation (against the original 93 items); item variance; the level of item endorsement; and an item's ability to discriminate between non-clinical and clinical groups.
The scales and their norms
Based on the above criteria, 32 items were selected – 16 items reflecting ideas of social reference and 16 items reflecting ideas of persecution rated on five-point likert scales from 1 (Not at all) to 5 (Totally). Four items from each dimension were chosen (conviction, preoccupation and distress) and four items simply reflecting a statement of a paranoid thought. The scales are administered independently, but can be totalled for an overall score.
Social reference
This is a 16-item scale, focusing on ideas of social reference relevant to paranoia, consistent with the SCAN and the criteria laid out above. Total scores can range from 16 to 80 with higher scores reflecting higher levels of paranoia. The mean total score for the 353 non-clinical cases was 26.8 (range 16–72, s.d.=10.4). The mean total score for the 50 clinical cases was 46.4 (range 16–80, s.d.=16.4). Four-item subscales of conviction, preoccupation and distress can also be calculated with scores ranging from 4 to 20. The mean scores for these were 6.5 (s.d.=2.8), 6.5 (s.d.=3.0), 7.1 (s.d.=3.1) respectively for the non-clinical sample and 11.9 (s.d.=4.6), 11.3 (s.d.=5.0), 11.1 (s.d.=4.8) respectively for the clinical sample.
Persecution
This is a 16-item scale, focusing on ideas of persecution, consistent with the criteria laid out by Freeman & Garety (Reference Freeman and Garety2000). Total scores can range from 16 to 80 with higher scores reflecting higher levels of paranoia. The mean total score for the 353 non-clinical cases was 22.1 (range 16–77, s.d.=9.2). The mean total score for the 50 clinical cases was 55.4 (range 24–80, s.d=15.7). Four-item subscales of conviction, preoccupation and distress can also be calculated with scores ranging from 4 to 20. The mean scores for these were 5.8 (s.d.=2.5), 5.1 (s.d.=2.4), 5.4 (s.d.=2.5) respectively for the non-clinical sample and 14.6 (s.d.=4.5), 13.1 (s.d.=4.7), 14.1 (s.d.=5.1) respectively for the clinical sample.
There were no sex differences noted on any of the GPTS scales in either group. In the non-clinical sample there were weak but significant inverse relationships between age and GPTS scores. The older the individual, the lower the GPTS score. For reference, persecution and the total score the relationships with age were as follows: ρ=−0.20, p<0.001; ρ=−0.14, p<0.001; ρ=−0.18, p<0.001 respectively.
GPTS reliability
Cronbach's α values for the scales are given in Table 1. The scales and their dimensional subscales demonstrated adequate internal consistency across both samples. A total of 164 individuals from the general population repeated the GPTS 2 weeks (T2) following the initial completion (T1) to assess test–retest reliability. The intra-class correlation coefficients between the GPTSREF, GPTSPERS and GPTSTOTAL scores at T1 and T2 were highly significant: 0.88 (GPTSREF), 0.81 (GPTSPERS), and 0.87 (GPTSTOTAL).
Table 1. Internal consistency of the scales

GPTS validity
Concurrent and convergent validity were investigated by examining the relationship between the GPTS and scores on the PS and PDI, BDI-II and BAI. In the clinical group validity checks of the dimensions were also made against scores on PSYRATS. In both samples the Paranoid Thoughts Scales were significantly correlated with scores on the PS, BDI-II and BAI (see Table 2). In the non-clinical sample GPTS dimensions significantly correlated with dimensions of the PDI (Spearman's ρ ranged from 0.37 to 0.57, p<0.01; full data tables are available from the first author). Similarly, in the clinical sample dimensions of the GPTS correlated significantly with appropriate dimensions of PSYRATS, e.g. the GPTS preoccupation total score was significantly correlated with PSYRATS preoccupation and distress scores (ρ=0.43, p<0.01 and ρ=0.30, p<0.05 respectively) but not PSYRATS conviction score (ρ=0.06, p>0.05) supporting the validity of the new scales (tables of all the correlations are available from the first author).
Table 2. Associations between the Green et al. Paranoid Thought Scales, the Paranoia Scale, Peters et al. Delusions Inventory and the Beck Depression and Anxiety Inventories in the non-clinical and clinical samples

GPTS, Green et al. Paranoid Thought Scales; PS, Paranoia Scale; PDI, Peters et al. Delusions Inventory; BDI, Beck Depression Inventory; BAI, Beck Anxiety Inventory.
* Spearman's ρ is significant at the 0.05 level.
** Spearman's ρ is significant at the 0.01 level.
Criterion validity was investigated by comparing responses on the GPTS between the two samples. Of the 32 items, 30 were endorsed significantly more frequently by the clinical group. The average endorsement for the 32 items across the sample as a whole was 34.7%. Endorsement was higher for items of reference (40.7%) than persecution (28.7%). Total scores across all the scales were significantly higher in the deluded group (see Table 3). The clinical group also scored significantly higher on dimensions of distress, preoccupation and conviction on both the GPTS and the PDI (Mann–Whitney U test all significant, p<0.0001). It should also be noted, however, that the range of GPTS total scores between non-clinical and clinical samples did overlap considerably (see Table 3). Six per cent of individuals from the non-clinical sample scored above the mean score for the clinical group on GPTSREF, 2% above the mean for GPTSPERS and 3% above the mean total score.
Table 3. Group comparisons across all measures
GPTS, Green et al. Paranoid Thought Scales; PS, Paranoia Scale; PDI, Peters et al. Delusions Inventory; BDI, Beck Depression Inventory; BAI, Beck Anxiety Inventory.
** Mann–Whitney U test significant at the 0.001 level.
Sensitivity to clinical change
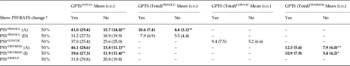
No additional intervention was made available as part of the current study. However, since recruitment occurred at the point of relapse in many cases, some natural recovery was anticipated. Thirty individuals from the clinical sample were contacted at 6 months following their initial baseline assessment (T1) to complete the items for the GPTS pool for the second time, and be interviewed for ratings on PSYRATS. The ability of the new measure to capture 50% change in scores on PSYRATS was investigated as this level of change has previously been cited as clinically important (e.g. Tarrier et al. Reference Tarrier, Yusopoff, Kinney, McCarthy, Gledhill, Haddock and Morris1998).
There were changes in the mean scores for all items of PSYRATS, the GPTS and its dimensions, with effect sizes between −0.24 and −1.0. Changes in PSYRATS item scores were significantly and positively correlated with changes in GPTS scores over time (T3–T1) (full data available on request from first author) suggesting some level of sensitivity to clinical change with the new measure.
The ability of the GPTS to capture a 50% change in symptom ratings was investigated by comparing the mean change in GPTS scores of individuals who showed a 50% change in their scores on PSYRATS and those who did not (see Table 4). A significantly greater change in GPTS scores was noted in individuals showing 50% change in their PSYRATS scores of preoccupation and distress. There were also greater GPTS changes (although not statistically significant) for individuals showing 50% change in their PSYRATS conviction and disruption to life scores.
Table 4. Mean scores on GPTS scales for individuals who did and did not show change on PSYRATS items at a criterion of 50%

PTS, Paranoid Thought Scales; PSYRATS, Psychotic Symptom Rating Scales; GPTS, Green et al. Paranoid Thought Scales.
PTS scores in bold indicate a significant difference between individuals showing change on PSYRATS and those who did not.
** Independent-sample t test significant at 0.01 level.
* Independent-sample t test is significant at 0.05 level.
(*) near significant p<0.1
The relationship between ideas of social reference and ideas of persecution
Significantly higher scores were noted for the reference scale compared to the persecution scale in the non-clinical sample [t(352)=−12.6, p<0.0001]. In the clinical sample the opposite pattern was observed. There were significantly higher scores on the persecution scale compared to the reference scale [t(49)=−4.4, p<0.0001].
In order to investigate the relationship between individual items and the scales, the total number of GPTS items endorsed by each person was first calculated (endorsement referring to a score of ⩾2) (Sturt, Reference Sturt1981; Freeman et al. Reference Freeman, Garety, Bebbington, Smith, Rollinson, Fowler, Kuipers, Ray and Dunn2005c). The count of paranoid thoughts could therefore range from 0 to 32. The mean difference for the paranoid thought count was then calculated between those with and without each paranoid thought (correcting for the contribution due to that item). The mean difference was significantly associated with the frequency of item endorsement in the non-clinical sample (r=−0.88, p<0.0001). This indicates that rarer thoughts were associated with a higher total score than more common ones and is consistent with a hierarchical arrangement of paranoid thoughts. Endorsement was consistently higher across all items in the clinical sample (mean=73.8, s.d.=10.1) but the range of endorsement was more varied in the non-clinical sample (mean=28.8, s.d.=15.7). The most commonly endorsed item in the non-clinical sample was ‘I have been upset by friends and colleagues judging me critically’, the most rarely endorsed was ‘I was convinced there was a conspiracy against me’.
Discussion
The aim of this study was to design a psychometric instrument capable of measuring paranoid thoughts multi-dimensionally across the continuum. Two factors were extracted from the factor analysis, ‘ideas of social reference’ and ‘ideas of persecution’, leading to the development of the GPTS. The separation of ideas of social reference from ideas of persecution in the new scales provides a method of assessment that is both comprehensive and flexible. The measure was also designed to be quick and easy to administer, and to have sensitivity to clinical change. No other instrument is currently available in the literature with these properties.
The internal consistency of the scales was good and test–retest reliability was demonstrated at 2 weeks follow-up. The new scales correlated well with the PS and the PDI, demonstrating good levels of concurrent validity. Interestingly, the GPTSREF scale showed a stronger relationship with the PS than the GPTSPERS scale, particularly in the clinical sample. This therefore highlights a potential weakness of the PS and the need for independent measures of persecution and social reference. The scales also demonstrated good convergent validity with measures of depression and anxiety. Higher levels of paranoia were associated with higher levels of depression and anxiety, consistent with the hypothesis that paranoid beliefs build upon emotional concerns (Freeman et al. Reference Freeman, Garety, Kuipers, Fowler and Bebbington2002, Reference Freeman, Garety, Bebbington, Slater, Kuipers, Fowler, Green, Jordan, Ray and Dunn2005b, Reference Freeman, Garety, Bebbington, Smith, Rollinson, Fowler, Kuipers, Ray and Dunnc; Smith et al. Reference Smith, Fowler, Freeman, Bebbington, Bashforth, Garety, Kuipers and Dunn2006). However, it is of interest that despite efforts to ensure items in the GPTS were not confounded by affective items, the size of correlation between BDI scores and the GPTSREF and GPTSTOTAL scores remained comparable to that of the PS, and stronger than the correlation noted between PDI and BDI scores.
The results support a dimensional view of paranoia (e.g. Johns & van Os, Reference Johns and van Os2004). Average endorsement of an item on the GPTS was 28.8% of the non-clinical sample and 73.8% of the clinical group. The data also confirm that even thoughts with strong levels of threat, e.g. ‘I was convinced there was a conspiracy against me’ are endorsed by a proportion of the general population. The difference in scores between the clinical and non-clinical samples on the GPTS was highly significant confirming the criterion validity of the scales, but there was also overlap in the range of scores between the two groups. This is of note, since all the deluded individuals had current persecutory delusions and were currently being treated for a psychosis.
The impact of a particular thought will depend not simply on its presence but also on its interpretation (Garety et al. Reference Garety, Kuipers, Fowler, Freeman and Bebbington2001). As Garety & Hemsley (Reference Garety and Hemsley1994) suggest, delusional beliefs are not just statements of experience but also evaluations of mental events. Factors that determine the severity of a delusional belief include the strength of belief, emotional impact and the amount of time spent thinking about it. It therefore confirms the validity of the new scale that the deluded group scored significantly higher on the dimensions of conviction, preoccupation and distress than the non-clinical group. These dimensions were also shown to demonstrate sensitivity to clinical change.
Ideas of social reference were more common in the non-clinical group than ideas of persecution, with the opposite pattern of results observed for the clinical sample. A hierarchical relationship was also noted in the non-clinical sample, whereby endorsement of rare items was significantly associated with a higher GPTS total score. Rarer items tended to be those with a stronger persecutory content, and therefore these data are consistent with the findings from previous studies and models of persecutory delusions (Freeman et al. Reference Freeman, Garety, Kuipers, Fowler and Bebbington2002). Collectively what these data suggest is that whilst ideas of social reference may be present without ideas of persecution, ideas of persecution are commonly dependent on the presence of ideas of reference. Theoretically, therefore, it will be useful to assess the presence of these ideas independently.
There are limitations to the study. Foremost, the non-clinical sample was not epidemiologically representative. It was self-selected, recruited via email and consisted mainly of university students. The age of the non-clinical sample was therefore significantly lower than that of the clinical sample. Consistent with previous web-based studies a higher proportion of females completed the measures. The response rate was low at King's College London, probably as a consequence of a circular recruitment email and no information is available on individuals who did not choose to participate. It is therefore difficult to ascertain how ‘typical’ those recruited by email are compared to those recruited by other means. Whilst a check was made of the time participants took to complete the measures online, and all appeared reasonable, no information is available on how honest or accurate these answers are. Indeed, an issue for questionnaire studies in general is whether the experiences assessed are actually unfounded, or based on real experiences and therefore well judged and appropriate (Freeman et al. Reference Freeman, Slater, Bebbington, Garety, Kuipers, Fowler, Met, Read, Jordan and Vinayagamoorthy2003). Nevertheless, the scale did correlate with an interview measure of delusional ideation in the clinical population.
In summary, a symptom-specific measure of paranoid thinking has been developed, which has shown robust psychometric properties across two independent samples. This new measure can allow independent assessment of ideas of reference and persecutory thoughts, in a quick and simple self-report format. The scales provide a multi-dimensional assessment of paranoid thinking, reliable and valid for both clinical and non-clinical samples and sensitive to clinical change. It is intended that the scales can be used to aid research into the causes of paranoia and as a clinical tool to assess the efficacy of treatment interventions.
Appendix
Green et al. Paranoid Thought Scales
Please read each of the statements carefully.
They refer to thoughts and feelings you may have had about others over the last month.
Think about the last month and indicate the extent of these feelings from 1 (Not at all) to 5 (Totally).
Please complete both Part A and Part B.
(N.B. Please do not rate items according to any experiences you may have had under the influence of drugs.)
Acknowledgements
Thanks to Professor Richard Bentall and Professor David Hemsley for their comments on this work. This work was sponsored by a Wellcome Trust Prize Studentship.
Declaration of Interest
None.