Introduction
Lichens are symbiotic organisms that consist of a fungal partner (the mycobiont) as the exhabitant, and one or more photosynthetic green alga or cyanobacterium partners (photobionts) as the inhabitant (Nash Reference Nash and Nash2008). The mycobiont and photobionts are generally considered to form a mutualistic symbiosis in which the biological fitness of both partners is increased (Lewis Reference Lewis, Rayner, Brasier and Moore1987). Symbiosis between mycobiont and photobiont in lichens is now widely accepted as a source of evolutionary innovation that has pushed morphological evolution to a level of complexity that is not reached elsewhere in the fungal kingdom (Honegger Reference Honegger, Margulis and Fester1991).
The morphology of lichen thalli is determined primarily by the exhabitant, that is the mycobiont (Hawksworth Reference Hawksworth1988). The mycobionts, which are mostly ascomycetes (Tehler & Wedin Reference Tehler, Wedin and Nash2008), reproduce sexually and disperse ascospores which are assumed to relichenize in the field, although asexual mycobiont reproduction also occurs via symbiotic propagules such as soredia, blastidia, or isidia (Honegger & Scherrer Reference Honegger, Scherrer and Nash2008). Ascospores, which are produced sexually in apothecia, and asexual propagules, which contain mycobiont hyphae and photobiont cells, are observed on many lichens. For most species, the association of the mycobiont with the photobiont during lichen reproduction, and the balance between the sexual and asexual reproductive modes, remain to be determined.
The reproductive modes of the green-algal photobionts are poorly studied and are assumed to be mostly asexual, sometimes forming motile zoospores with flagella or immotile autospores lacking flagella (Friedl & Büdel Reference Friedl, Büdel and Nash2008). Although no physical evidence of sexual reproduction, such as the fusion of gametes or meiotic tetrads, has been observed in any green-algal photobiont (Ahmadjian Reference Ahmadjian1987; Friedl & Rokitta Reference Friedl and Rokitta1997), a molecular analysis of Trebouxia photobionts suggests that they can recombine (Kroken & Taylor Reference Kroken and Taylor2000). The reproduction of photobionts should be further explored.
In addition to the reproductive modes of the lichen partners, the association between them is also of much interest. Ohmura et al. (Reference Ohmura, Kawachi, Kasai, Watanabe and Takeshita2006) reported that mycobionts in Parmotrema tinctorum (Delise ex Nyl.) Hale, a foliose lichen with a worldwide distribution, loosely and not specifically select their partner Trebouxia photobionts, probably through occasional exchange of their photobionts. Recently, based on anatomical observations and molecular analyses, the coexistence of two different taxa of Trebouxia (working names, TR1 and TR9) was determined within each thallus of Ramalina farinacea in all of the populations analyzed (Casano et al. Reference Casano, Del Campo, García-Breijo, Reig-Armiñana, Gasulla, Del Hoyo, Guéra and Barreno2011). Ohmura et al. (Reference Ohmura, Kawachi, Kasai, Watanabe and Takeshita2006) suggested that genotypic variation in photobiont occurs in three ways: by photobiont selection from the asexual propagules that are derived from thalli containing several photobionts; by the incorporation of a new photobiont living outside the thallus; and by the fusion of thalli that contain different photobionts. However, no decisive evidence for photobiont change has been reported yet.
As dissociation between both bionts and their reproduction generally accompanies various genetic changes in a population, genetic analysis may be effective in exploring the association and reproduction of both lichen partners. Molecular methods have enabled the inference of dispersal manner of propagules and extent of recombination by comparing genotypes without directly observing sexual morphology (Kroken & Taylor Reference Kroken and Taylor2001). Several kinds of molecular markers have been developed, including randomly amplified polymorphic DNA (RAPD) (Heibel et al. Reference Heibel, Lumbsch and Schmitt1999; Dyer et al. Reference Dyer, Murtagh and Crittenden2001), nuclear ribosomal DNA (nrDNA) (Bridge & Hawksworth Reference Bridge and Hawksworth1998), chloroplast LSU rDNA (del Campo et al. Reference del Campo, Casanoa, Gasullab and Barrenob2010) and the algal internal transcribed spacer (ITS) region of rDNA (Kroken & Taylor Reference Kroken and Taylor2000; Helms et al. Reference Helms, Friedl, Rambold and Mayrhofer2001; Cordeiro et al. Reference Cordeiro, Reis, Cruz, Stocker- Wörgötter, Grube and Iacomini2005; Ohmura et al. Reference Ohmura, Kawachi, Kasai, Watanabe and Takeshita2006; Robertson & Piercy-Normore Reference Robertson and Piercey-Normore2007; Kotelko et al. Reference Kotelko, Doering and Piercey-Normore2008), and have been applied to study the population genetic structure (Zoller et al. Reference Zoller, Lutzoni and Scheidegger1999; Högberg et al. Reference Högberg, Kroken, Thor and Taylor2002) and dispersal modes (Walser et al. Reference Walser, Zoller, Büchler and Scheidegger2001) of lichens. Chemical markers (Culberson et al. Reference Culberson, Culberson and Johnson1988, Reference Culberson, Culberson and Johnson1993) and isozymes (Fahselt Reference Fahselt1988; Hageman & Fahselt Reference Hageman and Fahselt1992; Fahselt et al. Reference Fahselt, Alstrup and Tavares1995) have also been used. The resolution of these molecular markers is sufficient for analyzing variations among populations (Lutzoni et al. Reference Lutzoni, Pagel and Reeb2001), but not for analyses on finer scales, such as variation within a population or within a single thallus (Ohmura et al. Reference Ohmura, Kawachi, Kasai, Watanabe and Takeshita2006).
Microsatellite markers (SSR markers) are highly variable and informative markers that have been used for genetic analyses (Powell et al. Reference Powell, Morgante, Andre, Hanafey, Vogel, Tingey and Rafalski1996). They have been successfully applied to fungi (e.g. Lian et al. Reference Lian, Hogetsu, Matsushita, Guerin-Laguette, Suzuki and Yamada2003) and unicellular algae (Shen Reference Shen2008). A few studies using SSR markers have examined the lichen fungus Lobaria pulmonaria (L.) Hoffm. (Walser et al. Reference Walser, Sperisen, Soliva and Scheidegger2003; Werth et al. Reference Werth, Gugerli, Holderegger, Wagner, Csencsics and Scheidegger2007), and SSR markers were recently developed for a lichen alga (Dal Grande et al. Reference Dal Grande, Widmer, Beck and Scheidegger2010; Widmer et al. Reference Widmer, Dal Grande, Cornejo and Scheidegger2010). Investigations using SSR markers should reveal new aspects of lichen reproduction at scales ranging from within-thallus to intercontinental.
In this study, we developed SSR markers for both the mycobiont and photobiont partners of P. tinctorum, and analyzed the SSR genotypes of associated bionts 1) within individual thalli, 2) among thalli on the same tree trunk, and 3) among thalli on all trees within a 100 m2-quadrat. Based on these analyses, we discuss the mutual association of both bionts and their reproductive modes.
Materials and Methods
Field sampling
A 10×10 m quadrat was established in the southernmost Pinus thunbergii Parlatore windbreak on the Kujukurihama coast, in Ichinomiya-machi, Chiba Prefecture, Japan (35°20·3′N, 140°23·6′E) (Fig. 1A). Parmotrema tinctorum thalli on pine trunks were sampled in the quadrat on October 6 and December 16, 2009, for analyses at three levels: 1) within-thallus, using five complete thalli from three trees (No. 9, 23, and 41); 2) within-tree, using 14 and five thalli obtained at different heights (10–175 cm) on trees No. 9 and No. 17, respectively; and 3) within-quadrat, using 57 thalli from 51 trees in the quadrat. At the sampling, x-, y- and z-coordinates of all sampled thalli were recorded. In addition, a thallus was sampled from each of 10 trees outside the quadrat ranging from 10–200 m geographic distance (Fig. 1B), and from each of 10 trees in Otaki-machi, Chiba Prefecture, Japan, with distances from 0·5 to 12 km (Fig. 1A, C) on November 16, 2007; these were used for recombination analysis on a larger scale. Voucher specimens were deposited in the Section of Forest Botany (TOFO) of the herbarium at the University Museum, University of Tokyo, Japan.
Fig. 1 Sampling sites of Parmotrema tinctorum thalli. A, location of sampling at Ichinomiya-machi and Otaki-machi; B & C, large-scale sampling points (dots) around the quadrat; B, Ichinomiya-machi; C, Otaki-machi, the numbers near dots indicate the number of thalli sampled; D, Pinus thunbergii trees (dots) in the quadrat, numbers attached to dots are the tree numbers.
DNA extraction from mycobiont
To prepare DNA for microsatellite marker development for the mycobiont, an approximately 1 cm2 lobule fragment of a thallus sampled at the windbreak was sandwiched between two glass slides, to which double-faced tape (NW-N20, Nichiban, Tokyo, Japan) had been attached by pressing tightly with a finger. The glass slides were pulled apart, dividing the thallus fragment into two layers: one with both mycobiont and photobiont cells, and the other with mostly mycobiont cells. As the latter layer was still contaminated with a few photobiont cells, the contaminating photobionts were removed from the layer together with most of the mycobiont cells by pressing another glass slide with double-faced tape onto it and separating the slide glasses. After observation under a dissecting microscope to confirm that the residual thin mycobiont cell layer was not contaminated with photobiont cells, small pieces of the double-faced tape with the attached mycobiont layer were cut out with a razor blade and transferred to a 2 ml tube containing three 3-mm zirconium balls. After adding a CTAB solution and homogenizing with Micro Smash (MS-100, Tomy Seiko, Tokyo, Japan), mycobiont DNA was extracted after Zhou et al. (Reference Zhou, Miwa and Hogetsu1999) and stored at −30°C until use.
DNA extraction from photobiont
To prepare DNA for microsatellite marker development of photobiont, a P. tinctorum thallus was collected from University Forest in Chiba, The University of Tokyo (35°9·6′N, 140°8·8′E). The voucher specimen of this thallus was deposited in the herbarium. An approximately 1 cm2 fragment was excised from the edge of the thallus, washed with tap water for 1 h, and then ground in 3 ml of sterilized distilled water (SDW) with a sterilized mortar and pestle. The suspension was passed sequentially through sterilized 500- and 150-µm stainless steel sieves. After several rinses with SDW, each of the thallus particles remaining on the 150 µm filter was cultured on a yeast-malt agar slant (0·2% yeast extract, 2% malt extract, 2% agar) in a test tube at 15°C in the dark. After 2 months, the green colonies were transferred to 20 ml of 1× Bold's Basal Medium (BBM; Bischoff & Bold Reference Bischoff and Bold1963) in 100 ml Erlenmeyer flasks and cultured at 23°C under fluorescent lamps with an 18 h light/6 h dark cycle on a rotary shaker at 100 rpm. After 3 weeks, 2 ml of cell suspension was transferred to 20 ml of fresh BBM and cultured for 1 week under the same conditions. The photobiont cells from 2 ml of the culture were collected by centrifugation at 19 000×g for 10 min and used for DNA extraction. For photobiont DNA preparation, DNA was extracted from the pelleted cells using a DNeasy Plant Mini Kit (QIAGEN, Hilden, Germany), according to the manufacturer's instructions, and stored at −30°C until use.
DNA specificity test
Extracted DNAs of both photobiont and mycobiont were confirmed to be uncontaminated with each other by ITS region examination. To amplify fungal- and algal-specific ITS regions by PCR, ITS primer pairs specific for fungal, ITS1F (Gardes & Bruns Reference Gardes and Bruns1993) and ITS4 (White et al. Reference White, Bruns, Lee, Taylor, Innis, Gelfand, Sninsky and White1990), and algal, ITS1T (Kroken & Taylor Reference Kroken and Taylor2000) and LR1 (Vilgalys & Hester Reference Vilgalys and Hester1990), were used, respectively. PCR consisted of a 2 min denaturation at 94°C, followed by 30 cycles of 94°C for 30 s, 55°C for 30 s, and 72°C for 1 min, with a final 10 min at 72°C. The PCR products were checked by electrophoresis in 1% agarose gels (Agarose S, Nippon Gene, Tokyo, Japan) containing 5% (v/v) GelRed Nucleic Acid Gel Stain, 10 000× in water (Biotium, Hayward, CA, USA), and photographed with a FAS-III system (Toyobo, Osaka, Japan). A 100-bp DNA ladder (Toyobo) was used as a size standard.
Microsatellite marker development
Microsatellite markers were developed from both mycobiont and photobiont DNA samples using the method of Wu et al. (Reference Wu, Kurokochi and Hogetsu2009).
SSR and ITS analysis of thalli
For the within-thallus analysis of thalli Nos 1–5, each thallus was scanned and a 2·7 cm lattice was superimposed onto the image using Adobe Photoshop CS4, as in Fig. 2. Then, using forceps, a c. 3 mg piece was sampled from within each lattice square and transferred to a 2 ml tube containing three 3-mm zirconium balls. The small pieces in 2 ml tubes were homogenized at 4 500 rpm with MicroSmash for 2 min. DNA was extracted and stored for mycobiont/photobiont SSR analysis with the same method as explained above for mycobiont DNA extraction.

Fig. 2 Phylogenetic dendrogram of ITS rDNA sequences from Parmotrema tinctorum photobionts using the neighbour-joining method. The photobiont sample used for SSR marker development was signified “Tc” (Accession No. AB573822). The other samples that were sequenced in the present study are represented by DNA sample number given in Table 2 with their photobiont SSR genotype in italics in parentheses. Sequences from GenBank are indicated by species name followed by the accession number of the samples in parenthesis. Trebouxia sp. RCOM1 and Trebouxia sp. RG1 represent photobionts from Ramalina complanata and Ramalina gracilis, respectively. Numbers at bold branches indicate bootstrap values. An ITS sequence of T. jamesii was used as the outgroup.
For the within-tree and within-quadrat analyses, a small fragment was sampled from the marginal lobe of each thallus, homogenized and treated for homogenization and DNA extraction as mentioned above.
To amplify SSR markers, PCR was performed using the BioTaq PCR Kit in a 5 µl reaction mixture containing 0·4 µM of the forward primer (Table 1), 0·04 µM reverse primer (Table 1) with a tail of M13f and 0·4 µM of M13f primer, of which one tenth (0·04 µM) was 5′-labelled with Texas Red. The PCR-amplified products were denatured by heating at 94°C for 5 min and separated using the SQ-5500E DNA sequencer, and their band sizes were estimated from DNA size standards using FRAGLYS 3.0 software (Hitachi Electronics Engineering).
Table 1. Microsatellite loci of mycobiont and photobiont in Parmotrema tinctorum.

*‘tail’ indicates a tail sequence: TGTAAAACGACGGCCAGT; **‘Ta’ represents annealing temperature; ***The nucleotide sequence data will appear in the DDBJ/EMBL/GenBank nucleotide sequence databases with the accession numbers provided.
For algal species identification, ITS regions of all DNA samples (Table 2) were amplified using the alga-specific primer pairs. The ITS-PCR products were cloned as described in Wu et al. (Reference Wu, Kurokochi and Hogetsu2009) and sequenced.
Table 2. SSR Genotypes of both photobiont and mycobiont partners at within-thallus, within-tree, and within-quadrat levels. Trebouxia sp. RG1 is a photobiont from Ramalina gracilis. Photobiont species are recognized based on ITS region blast.

*Sample numbers 79, 93 and 113 are repeated in within-thallus and within-tree analyses and sample no. 303 is repeated in within-tree and within-quadrat analyses.
†The samples included or not included in the analyses are represented by “+” and “−”, respectively.
Data analysis
The determined photobiont ITS sequences including ITS1, the 5.8S rRNA gene and ITS2 were aligned with those of several Trebouxia species registered in DDBJ (Ohmura et al. Reference Ohmura, Kawachi, Kasai, Watanabe and Takeshita2006) using Clustal W (Thompson et al. Reference Thompson, Higgins and Gibson1994), and a phylogenetic dendrogram of photobiont ITS sequences was drawn by the neighbour-joining method (Saitou & Nei Reference Saitou and Nei1987) using MEGA ver. 4.0 (Tamura et al. Reference Tamura, Dudley, Nei and Kumar2007) with 1000 bootstraps. Our ITS sequences used for this analysis are available in the DDBJ/EMBL/GenBank nucleotide sequence databases at the accession numbers in Table 2. The ITS sequence of T. jamesii (Hildreth et Ahmadjian) Gärtner (accession GQ375361) was included as the outgroup. Photobiont species were identified from their positions in the dendrogram, and the validity of the species identification was confirmed by comparing all photobiont ITS sequences after trimming SSU and LSU rDNA sequences from 3′ and 5′ ends, respectively, with those in the DDBJ database using BLAST (>99% identity).
A representative with a complete SSR genotype or with one unamplified locus was selected from within-thallus squares that were compatible with the same complete SSR genotype, and included in the analyses. Thalli for within-tree analysis were also included. Unamplified loci were regarded as missing data in the analysis of molecular variance (AMOVA), autocorrelation, and index of association (IA). Similarity dendrograms of multilocus genotypes for both bionts were constructed by the neighbour-joining method (Saitou & Nei Reference Saitou and Nei1987) with Populations ver. 1.2.30 (Langella Reference Langella1999) after 1 000 permutations. AMOVA analysis was performed by dividing photobionts into 9 subgroups that paired with the same mycobiont genotypes, that is P1, P2, P3, P4, P5, P6, P7, P8, and P11 using GenAlEx ver. 6.3 (Peakall & Smouse Reference Peakall and Smouse2005). Photobionts that paired with the mycobiont genotypes of P9, P10, and P12 were omitted from the analysis due to having only one sample for each genotype.
Spatial autocorrelations of mycobiont and photobiont genotypes were analyzed to show the degree of relationship between physical distance and genotype similarity using GenAlEx ver. 6.3 (Peakall & Smouse Reference Peakall and Smouse2005). Physical distances between individual thalli were calculated from x-, y- and z-coordinates of thalli, and positive or negative correlation coefficient (r) values in the distance classes that showed significant spatial autocorrelation were shown. To characterize the effective mode of reproduction, we used population genetic approaches based on the fact that variable loci distributed throughout the genome remain associated when clonal reproduction occurs, while recombination with sexual reproduction leads to the dissociation of independent variable loci (Högberg et al. Reference Högberg, Kroken, Thor and Taylor2002). Linkage disequilibrium (LD) between paired loci was calculated using Arlequin ver. 2.000 (Schneider et al. Reference Schneider, Roessli and Excoffier2000). Significance levels (P<0·05) of linkage were adjusted for multiple comparisons using a sequentially rejective Bonferroni test (Holm Reference Holm1979).
The overall index of association (IA) values for each biont were also calculated using MultiLocus ver. 1.2 (Agapow & Burt Reference Agapow and Burt2001). This statistical test is designed to analyze and detect associations between alleles at different loci by measuring recombination occurring among sequences (Maynard-Smith et al. Reference Maynard-Smith, Smith, O'Rourke and Spratt1993). Significant values reject the null hypothesis of no association of alleles in different loci, indicating clonal reproduction. Each observed IA value from randomness was tested (P<0·05) by comparing each calculated value with a set of overall IA values obtained from 10 000 randomizations.
Results
ITS analysis
ITS sequences obtained from P. tinctorum were between 636–665 bp in length, and according to the phylogenetic analysis belong to three clades containing registered sequences in the database for T. corticola (Archibald) Gärtner (Ohmura et al. Reference Ohmura, Kawachi, Kasai, Watanabe and Takeshita2006), T. higginsiae (Hildreth & Ahmadjian) Gärtner (Ohmura et al. Reference Ohmura, Kawachi, Kasai, Watanabe and Takeshita2006) and an unknown Trebouxia species (Cordeiro et al. 2005), respectively (Fig. 2). The species of each sample was identified according to the clade in which it was included. BLAST with ITS DNA sequences registered in the database confirmed validity of the identification with more than 99% identity.
The ITS sequence determined from the photobiont DNA used for photobiont SSR marker development, signified Tc (accession AB573822), was positioned in the photobiont T. corticola clade (Fig. 2).
Development of SSR markers
The purity of the fungal and algal DNA samples used to develop SSR markers was examined by PCR amplification with fungus- and alga-specific ITS markers. With the fungus-specific ITS marker ITS1F/ITS4, PCR amplification of the fungal DNA produced a thick band on agarose gels, whereas no PCR product band was observed with the alga-specific ITS marker ITS1T/LR1. The opposite was seen with PCR amplification of the algal DNA. These results showed that the DNA samples extracted as mycobiont and photobiont DNA belonged to the target fungus and alga, with no substantial contamination of the counterpart DNA.
Four and five SSR markers were developed for the mycobionts and photobionts, respectively (Table 1). All of the mycobiont (Pat36, Pat40, Pat41, and Pat56) and photobiont (Tc16, Tc20, Tc25, Tc28, and Tc29) markers were used in the subsequent SSR polymorphism analysis. For every lichen sample, every marker produced one or no band on electrophoresis with the sequencer; thus, we concluded that each marker represented a single SSR locus in the haploid genome.
PCR amplification of DNA samples with photobiont SSR markers sometimes resulted in no band. In such cases, we indicated its genotype by attaching the letters a, b, c, d and e for Tc16, Tc20, Tc25, Tc28, and Tc29, respectively, to the name of a complete genotype with which alleles amplified from the sample were compatible (Table 3). Genotype Tabcde was given to those photobionts that had unamplified PCR for all loci (Table 3). In the case of mycobiont genotypes, there was only one unamplified locus, Pat41, in sample No. 187 which was indicated by attaching letter c to the genotype (i.e. P9c; Table 3).
Table 3. Allele sizes of each SSR genotype for mycobiont loci Pat36, Pat40, Pat41 and Pat 56 and photobiont loci Tc16, Tc20, Tc25, Tc28 and Tc29, respectively. “−” represents unamplified locus. In case of unamplified loci, letter “c” for locus Pat41, and letters “a”, “c”, “d” and “e” for loci Tc16, Tc25, Tc28 and Tc29, respectively, were added to their complete genotypes. P9c, T14e, T17c, T19e T24d and T34a are not complete genotypes. Tabcde had unamplified loci for Tc16, Tc20, Tc25, Tc28 and Tc29.
SSR-genotype analysis at the within-thallus level
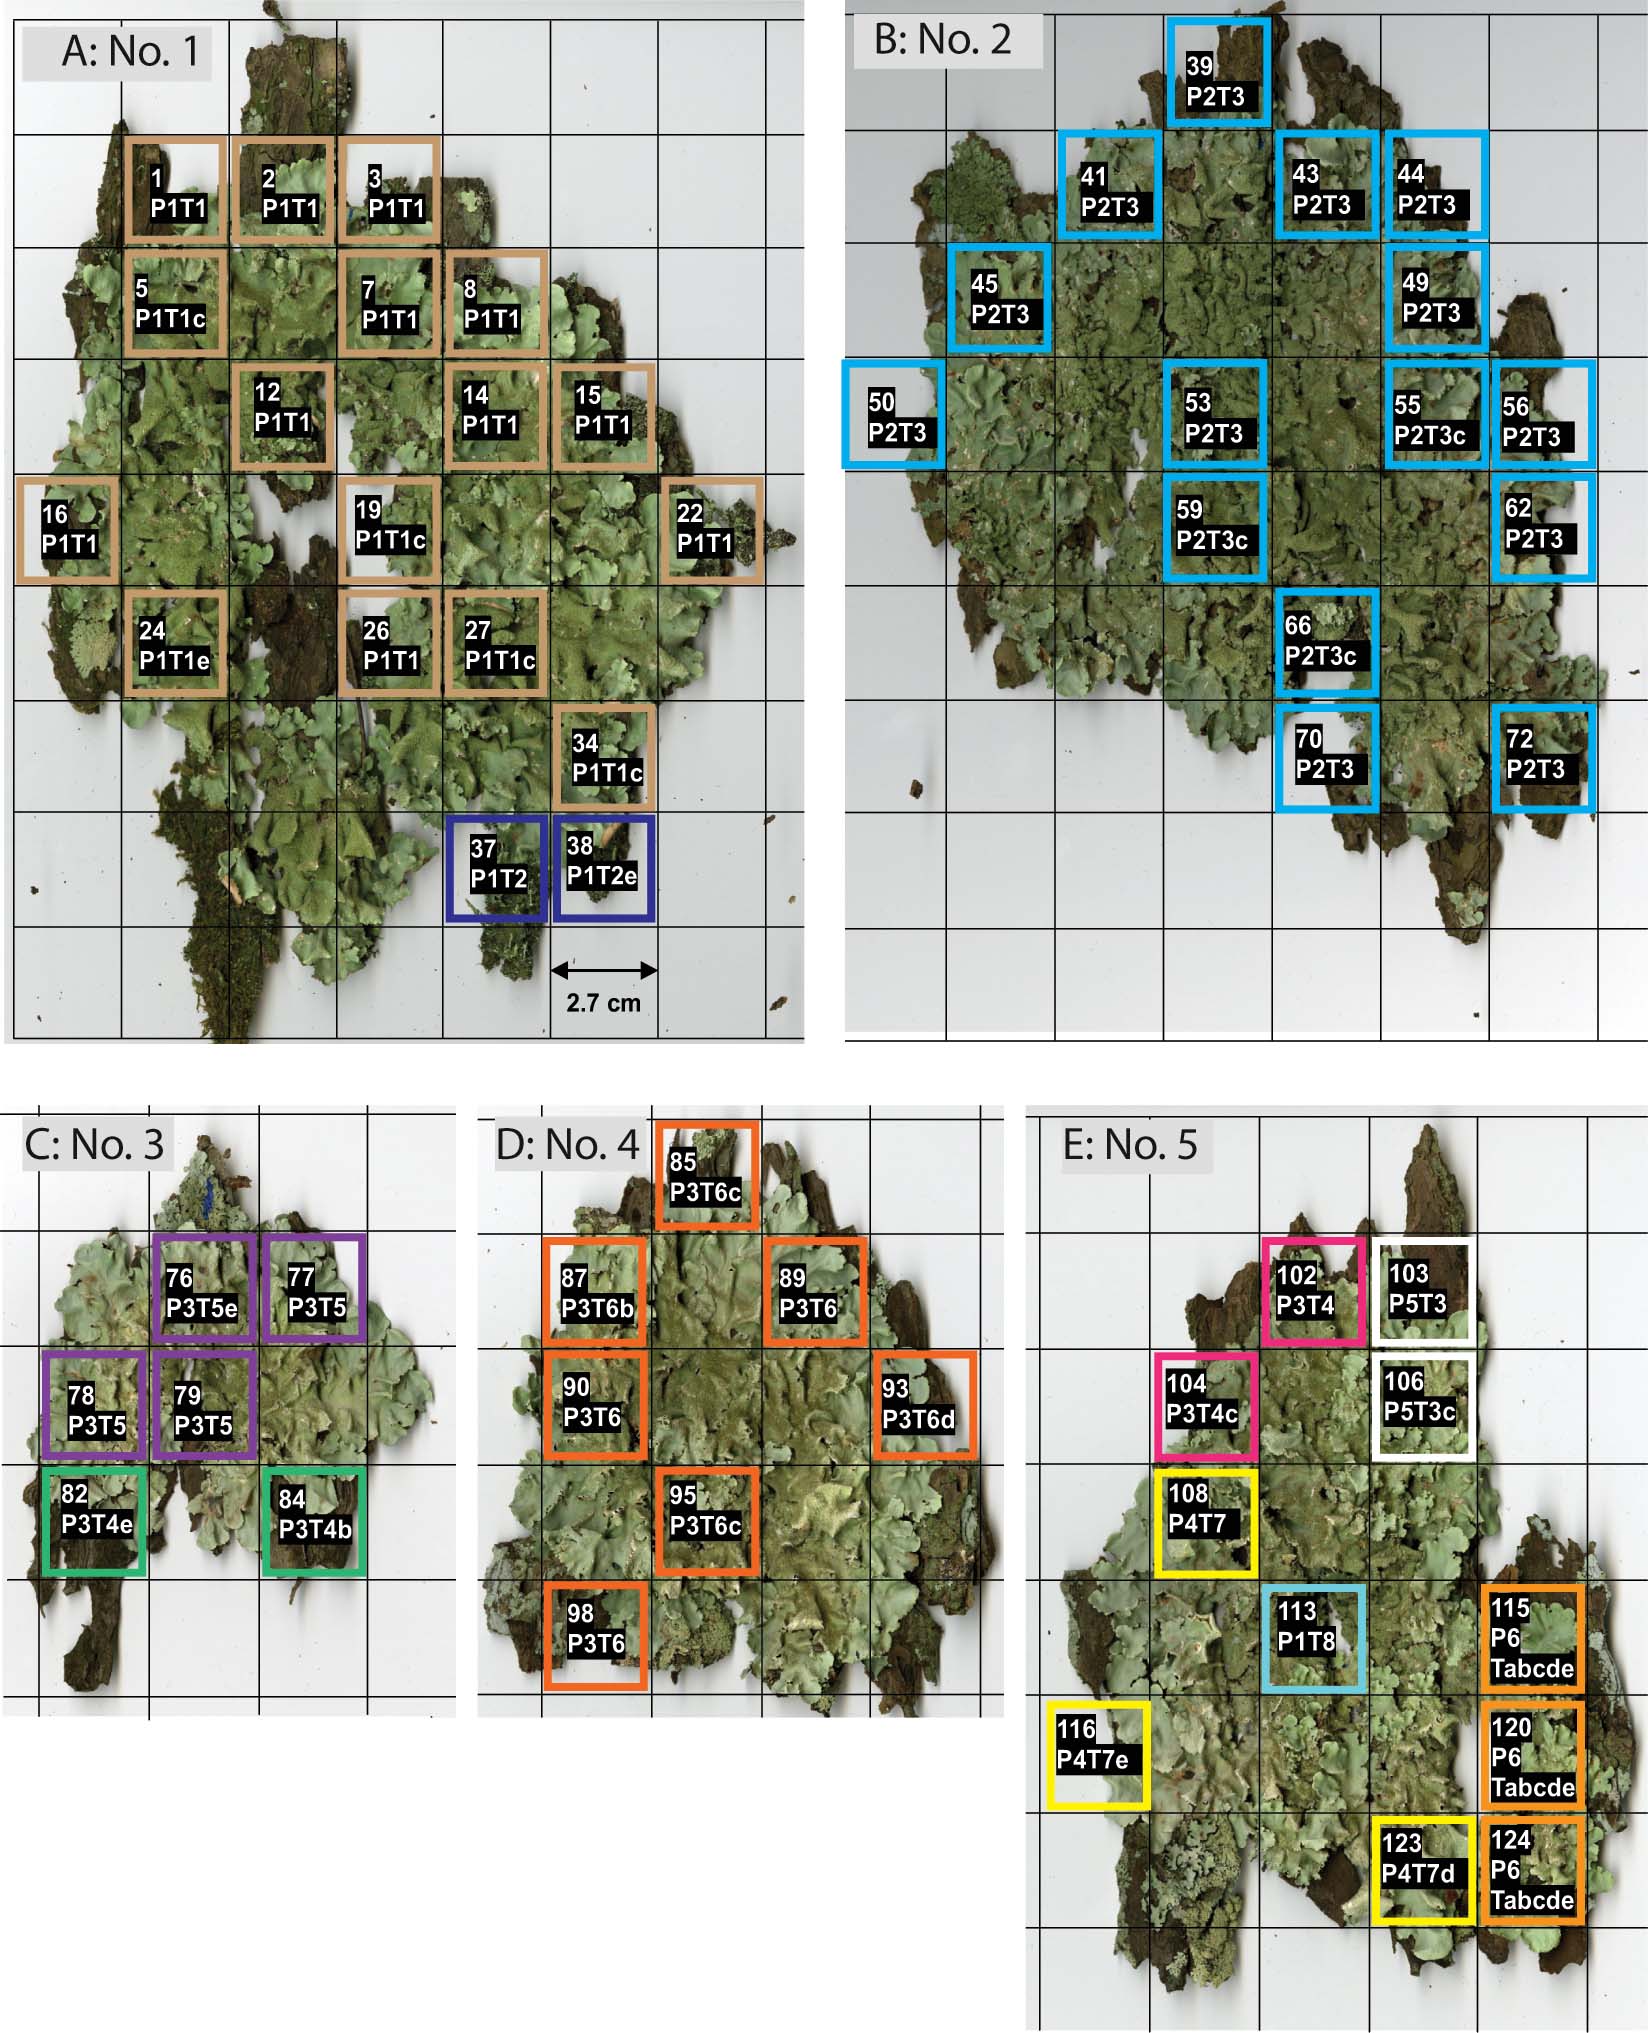
In thallus No. 1 on tree No. 41, all 18 squares contained only mycobiont genotype, P1 (Fig. 3A). Eleven squares were entirely photobiont genotype T1, and 5 had genotypes compatible with T1, of which four had no allele at Tc25 (genotype T1c); and one, at Tc29 (genotype T1e). One square had just genotype T2, and one square had a genotype compatible with T2 which had no allele at Tc29 (genotype T2e). Consequently, there were at least two combination genotypes (i.e., genotypes compatible with P1T1 and P1T2), and they did not appear to be intermingled, but to occur in discrete patches in the thallus.

Fig. 3 Within-thallus distribution of Parmotrema tinctorum genotypes. A thallus portion was taken from each square in the 2·7 cm lattice, and its mycobiont and photobiont genotypes were determined by PCR of SSR markers. A, thallus No. 1 on tree No. 41; B, thallus No. 2 on tree No. 23; C, thallus No. 3 on tree No. 9; D, thallus No. 4 on tree No. 9; E, thallus No. 5 on tree No. 9. The sample number and genotype are written in the first and second lines on each square, respectively. Letters a, b, c, d or e are attached to the genotypes having unamplified loci. Genotype Tabcde represents Trebouxia. sp. RG1 in thallus No. 5. Squares outlined by the same colour in each thallus represent the same genotype.
Thallus No. 2 on tree No. 23 contained mycobiont genotype, P2, and photobiont genotype T3, in which only one compatible genotype, T3c (Fig. 3B), was observed. Therefore, all of the genotypes were compatible with P2T3.
In thallus No. 3 on tree No. 9, all squares contained genotype P3 (Fig. 3C). Two squares contained photobiont genotypes compatible with T4, that is T4b and T4e. Of the other four, three consisted of T5 and one was T5e. All of the genotypes were compatible with P3T4 and P3T5, and both types seemed to have a patchy distribution in the thallus.
In thallus No. 4 on tree No. 9, all squares had mycobiont genotype P3 (Fig. 3D). The photobiont genotype was T6 in three squares. In the other 4 squares, one had genotype T6b, two had T6c, and one T6d. All of the lichen genotypes were compatible with P3T6 (Fig. 3D).
Thallus No. 5 on tree No. 9 had the greatest mycobiont genotypic diversity of all thalli examined. One, two, two and three of 11 squares contained mycobiont genotypes P1, P3, P5 and P6, respectively. The squares from thallus No. 5 contained photobiont genotypes compatible with T3, T4, T7, T8, or an unamplified genotype (Tabcde). Of the 11 squares, 1, 2, 3, 2, and 3 squares were compatible with P1T8, P3T4, P4T7, P5T3, and P6 with the unamplified photobiont genotype, respectively. The photobiont that combined with P6 was identified in the phylogenetic ITS analysis as Trebouxia sp. isolated from Ramalina gracilis (Pers.) Quél. (Trebouxia sp. RG1, Cordeiro et al. 2005), which is a different Trebouxia species from T. corticola (Fig. 2).
For the samples extracted from unnumbered squares in Fig. 3, no DNA was amplified with either the SSR marker primers or with ITS rDNA-specific primers for either photobionts or mycobionts. As satisfactory PCR results were usually obtained from marginal lobules, but not from central parts, we concluded that the quality or amount of DNA extracted from the central part of lobules was too low to be amplified by PCR.
The mycobiont and photobiont genotypes in thallus No. 5 were dispersed throughout the mycobiont and photobiont genotype-distance dendrograms, respectively (Fig. 4A & B). Since the genotypes in the same or neighbouring clades are supposed to be genetically similar, genotypes of both bionts in thallus No. 5 may not be necessarily similar to each other.

Fig. 4 Genotype similarity dendrograms of Parmotrema tinctorum genotypes using the neighbour-joining method. A, mycobiont genotypes; B, photobiont genotypes. All genotypes are listed in separate tables alongside the dendrograms; thalli or tree numbers of genotypes which were not included in within-thallus or within-tree analyses are represented by ![]() and
and ![]() , respectively. The number of genotypes associated with the mycobionts (i.e. photobiont genotypes in A) or photobionts (i.e. mycobiont genotypes in B) can vary from 1–9 and 1–3, respectively. Only complete genotypes containing all SSR loci were used for constructing the dendrograms and genotypes P9 (from mycobiont) and T14, T17, T19, T24 and T34 (from phtobiont) were excluded due to having one unamplified locus.
, respectively. The number of genotypes associated with the mycobionts (i.e. photobiont genotypes in A) or photobionts (i.e. mycobiont genotypes in B) can vary from 1–9 and 1–3, respectively. Only complete genotypes containing all SSR loci were used for constructing the dendrograms and genotypes P9 (from mycobiont) and T14, T17, T19, T24 and T34 (from phtobiont) were excluded due to having one unamplified locus.
SSR-genotype analysis at the within-tree level
In all, six mycobiont and seven photobiont genotypes were found in 14 thalli on tree No. 9; and three of each in five thalli on tree No. 17 (Table 2, Fig. 5). The mycobiont genotypes P3 and P5 were found in the upper thalli of tree No. 9, (i.e., four P5 and five P3 ranging from 53 to 175 cm), and the P3 genotype was in the upper three of five thalli in tree No. 17. The photobiont genotypes showed an almost similar pattern to the mycobiont in the uppermost thalli, in which genotypes T3 and T5 occupied the upper 6 out of 14 thalli of tree No. 9 (three for each of T3 and T5), and for tree No. 17, T6 genotype was in the upper three out of five. The combination genotypes of P5T3 and P3T5 were observed in two and three of the upper parts of tree No. 9, whereas P3T6 occupied the upper three of the six thalli in tree No. 17. Three of the 14 photobiont samples on tree No. 9 had genotype Tabcde, which was identified as T. higginsiae in the phylogenetic analysis (Fig. 2).

Fig. 5 Within-tree distribution of Parmotrema tinctorum genotypes in trees No. 9 and 17. Genotype P3T6 was observed from the uppermost part of tree No. 17. Genotypes P3T5 and P5T3 were distributed from 85 to 175 cm and P5Tabcde and P10Tabcde from 95 to 145 cm in tree No. 9. Other genotypes of tree No. 9 did not show any similarity.
Mycobiont and photobiont genotypes on the same tree were both distributed throughout the similarity dendrograms (Fig. 4A & B), indicating that the photobiont genotypes on the same tree were not necessarily similar to each other.
SSR-genotype analysis at the within-quadrat and large-scale levels
In the quadrat, there was only one mycobiont and 6 out of 27 photobiont genotypes that contained unamplified loci (Table 2). Thalli from trees No. 33 and 49 that had a photobiont genotype Tabcde were identified in the phylogenetic analysis as Trebouxia sp. RG1 and T. higginsiae, respectively, and other photobiont SSR genotypes were placed in the clade of T. corticola (Fig. 4). Because no PCR fragment was amplified from DNA from thalli on tree numbers 3, 7, 8, 10, 16, 19, 22, 27, 28, 29, 30, 35, 36, and 38 with ITS rDNA-specific primers for photobionts, these samples were excluded from analyses.
In the photobiont similarity dendrogram (Fig. 4B), genotypes paired with mycobiont genotypes P1, P3, or P11 tended to cluster within neighbouring clades. In other words, mycobiont genotypes P1, P3, or P11 in the quadrat tended to be paired with genetically similar photobionts. The AMOVA analysis result showed that the value of PhiPT (i.e., the genetic diversity among subgroups), was 0·337 (P value=0·001), indicating significant genetic differentiation among subgroups at P<0·05. This also supported the tendency of mycobiont genotypes for pairing with genetically similar photobionts.
Spatial autocorrelation analysis indicated significantly positive values of correlation coefficient (r) in the first (0–1 m, r=0·083) and third (2–3 m, r=0·077) distance classes and negative ones in the 7th (6–7 m, r=−0·060) and 8th (7–8 m, r=−0·067) distance classes of mycobionts, respectively, and the other eight distance classes showed no significant spatial autocorrelation. Only one positive value in the first distance class (0–1 m, r=0·064) was found in photobionts (Fig. 6); the other 11 classes showed no significance.

Fig. 6 Spatial autocorrelation of Parmotrema tinctorum mycobiont and photobiont in the quadrat. A, mycobiont; B, photobiont. Dotted lines indicates 95% confidence limits; values significantly different from zero (based on 1 000 permutations) are marked by asterisks.
Based on 10 000 randomizations, the observed overall IA value of mycobiont genotypes in the quadrat was 0·02 (P value=0·31). This indicated that mycobiont SSR loci were not significantly associated with each other within the non-significant range of a randomized dataset. By contrast, the observed overall IA value of photobiont genotypes was 0·54 (P value=0·001), indicating significant associations among loci. The overall IA values for both bionts at the large-scale level were also calculated for comparison. The overall IA values of mycobiont and photobiont genotypes were 0·04 (P value=0·32) and 0·17 (P value=0·17), respectively, indicating that no significant association was detected in either biont.
LD analysis performed with mycobiont locus pairs at within-quadrat level indicated no significant P-value (Table 4), whereas P values for all photobiont locus pairs were significantly small, showing the linkage between locus pairs. LD analysis for all locus pairs of both mycobiont and photobiont in samples from the large-scale region provided no significant P-values. These results were consistent with the resulting of overall IA values.
Table 4. P-value for linkage disequilibrium among pairs of mycobiont and photobiont loci at within-quadrat and large-scale levels. Significance levels (P<0·05) of linkage were adjusted for multiple comparisons using a sequentially rejective Bonferroni test; significant values are shown in bold.
Discussion
SSR polymorphism analysis
A few recent studies of lichens have used SSR markers. Walser et al. (Reference Walser, Sperisen, Soliva and Scheidegger2003) first isolated SSR markers for the lichen-forming ascomycete Lobaria pulmonaria and examined genetic variability on different scales. They detected genetic variation among L. pulmonaria thalli, within individual trees and between continents, and found SSR markers to be ideal tools for studying dispersal, population differentiation, and microevolution in lichens. Werth et al. (Reference Werth, Gugerli, Holderegger, Wagner, Csencsics and Scheidegger2007) analyzed gene flow at a landscape level in the mycobiont of L. pulmonaria using SSR markers, and reported that gene movement in L. pulmonaria was restricted spatially. Thus, investigations using SSR markers have revealed new aspects of the mechanism of lichen reproduction at various levels.
Given that lichens are composed of both mycobionts and photobionts, SSR polymorphism analysis should be applied to both partners inhabiting the same lichen thallus. Despite the above-mentioned studies of lichen mycobionts using SSR markers and the recent development of photobiont SSR markers (Dal Grande et al. Reference Dal Grande, Widmer, Beck and Scheidegger2010; Widmer et al. Reference Widmer, Dal Grande, Cornejo and Scheidegger2010) for L. pulmonaria, no simultaneous analysis of both mycobionts and photobionts in the same thalli using SSR markers has been reported yet. As far as we are aware, our study is not only the first report of SSR marker development for both bionts in P. tinctorum, but also the first trial of simultaneous SSR polymorphism analysis of both bionts of lichens.
SSR genotype analysis at the within-thallus level
All of the mycobiont genotypes within each of thalli Nos 1–4 appeared to be substantially identical. This is similar to L. pulmonaria, in which no genotypic variation was found for mycobiont SSRs in the thalli examined (Walser et al. Reference Walser, Sperisen, Soliva and Scheidegger2003).
During thallus development in foliose lichens, the mycobiont layers in the initial thallus simply expand and occasionally fuse with another one (Schuster et al. Reference Schuster, Ott and Jahns1985). Indeed, Moxham (Reference Moxham1981) observed the fusion of a detached lobule with the parent thallus in Xanthoria parientina (L.) Beltram, and Armstrong (Reference Armstrong1984) experimentally proved that fusion between thalli occurs. When a lichen thallus simply expands from the initial propagule without thallus fusion, the mycobiont genotype would be the same within the thallus. However, when the thallus fuses with another thallus, the fused thallus would include different mycobiont genotypes, and the different mycobiont genotypes would occur in sectors. Therefore, these P. tinctorum thalli Nos 1–4 may have simply expanded from the initial thalli without thallus fusion.
In thallus No. 5, there were several mycobiont genotypes, suggesting that this thallus was a composite of different thalli. The mycobionts in thallus No. 5 may have originated from independent small thalli that were established in close proximity, and fused with each other during thallus expansion.
Unlike the mycobionts, photobiont genotypes compatible with two specific genotypes, T1 and T2, and T4 and T5 were distributed in patches in thalli Nos 1 and 3, respectively. Given that both thalli simply expanded from the initial stage without fusion, the photobiont layer would also expand by proliferation of photobiont cells. If photobiont cells proliferate by simple somatic cell division under a tight association with mycobiont layer expansion, the genotype of the photobiont layer would be the same everywhere in the thallus. Therefore, multiple photobiont genotypes detected within thalli Nos 1 and 3 might mean the prior inclusion of multiple photobiont genotypes in the initial thallus.
It has been stated repeatedly that free-living stages of Trebouxia species, the most common lichen-forming algal species, have not been observed (Ahmadjian Reference Ahmadjian1987), or at least are inconspicuous (Wornik & Grube Reference Wornik and Grube2010). Nevertheless, Sanders & Lücking (Reference Sanders and Lücking2002) and Sanders (Reference Sanders2005) have suggested that the scarcity of free-living Trebouxia does not necessarily indicate its rarity in nature. Sanders & Lücking (Reference Sanders and Lücking2002) demonstrated that new free-living photobiont cells can be incorporated into a developing initial thallus, and suggested that algal populations within a lichen thallus are not genetically uniform and that their genetic compositions change in the course of development. Thus, it might also be possible that the multiple photobiont genotypes in the present study arose from the incorporation of a new free-living photobiont cell having a different genotype from the outside during thallus development.
SSR-genotype analysis at the within-tree level
Different mycobiont genotypes co-existed on the same trunk, as shown in L. pulmonaria (Walser et al. Reference Walser, Sperisen, Soliva and Scheidegger2003). In the mycobiont similarity dendrogram (Fig. 54A), the genotypes on the same tree were distributed throughout the dendrogram. This suggests that these unrelated genotypes on the same tree were randomly derived from different thallus origins.
Nevertheless, three of five thalli on tree No. 17 had the same mycobiont and photobiont genotypes, genotype P3T6 at the heights 65, 76 and 115 cm, respectively (Fig. 5). This suggests that these thalli developed clonally through isidium dispersal from a pioneer thallus on the tree. Several thalli on tree No. 9 also showed the same genotypes, three P3T5 and two P5T3, indicating isidium dispersal within the tree (Fig. 5). However, low within-population variation for both bionts may lead to the same combination in spite of sexual recombination. This hypothesis should also be considered as a possibility.
SSR-genotype analysis at the within-quadrat and large-scale levels
The photobiont similarity dendrogram revealed a tendency for closely related photobiont genotypes to be paired with the same mycobiont genotype, such as P1, P3, and P11 (Fig. 4B). AMOVA also indicated that photobiont genotypes paired with the same mycobiont genotype significantly resembled each other.
In general, P. tinctorum thalli may be derived from either ascospores or isidia. Because a mycelium developed from an ascospore is thought to independently and randomly capture a free-living photobiont with a different genotype as its counterpart, thalli derived from ascospores may end up with a variety of photobiont genotypes, and show no genotypic linkage between the bionts. On the contrary, thallus establishment through isidium dispersal could maintain the genotypic combination between both bionts. Therefore, the genotypic linkage found in the present study reflects thallus proliferation through isidium dispersal and subsequent diversification of photobionts.
The IA values for the mycobionts were small enough (i.e., showed insignificant amounts of linkage among tested loci) to infer the presence of recombination at both within-quadrat and the broader scale. This indicate that mycobionts might mainly reproduce sexually, via ascospore dispersal from apothecia. Based on the similarity among photobiont genotypes in thalli with the same mycobiont genotypes, we have inferred above that thalli within a quadrat sometimes propagated via isidium dispersal. Therefore, both sexual and asexual reproduction may be important in the propagation of P. tinctorum. To precisely determine the balance between the two modes, more detailed investigations are necessary.
The significantly large IA value for photobionts indicated linkage between loci on the within-quadrat scale, and showed that photobionts mainly reproduced clonally through isidium dispersal at this small spatial scale. Simultaneously, the small IA value for photobionts was small on the broader scale indicates that photobionts could also reproduce sexually.
Reproductive mode of P. tinctorum
Considering our results, we hypothesized that both P. tinctorum bionts associate and reproduce as follows. During thallus development on the tree trunk, thalli sometimes fuse with each other, forming a new composite thallus with sectors of different mycobiont genotypes. Association between both bionts in a thallus can be altered, probably by incorporation of a new photobiont into the thallus, resulting in sectored photobiont genoypes. Mycobiont cells usually reproduce sexually, although the lichen thalli can proliferate through isidium dispersal. Since the mycobiont mycelium initiated from ascospores develops into a thallus by incorporating new free-living photobiont cells, the association is frequently reset by the mycobiont sexual reproduction. The photobiont usually reproduces asexually by somatic cell division, and also sexually, even at a low frequency.
We are grateful to Sakie Nohara of the Chiba Prefectural Forestry Research Center for assistance with fieldwork, and to Yukiko Takahashi and Yukiko Yokoyama of the Laboratory of Forest Botany, the University of Tokyo, for assistance in isolation of the photobiont algal cells. This study was supported in part by Grants-in-Aid from the Japanese Society of Promoting Sciences (JSPS) (No. 16101008 and No. 22657005). Reviewers have substantially improved the manuscript and should be acknowledged here.