


Introduction
Schema-Focused Therapy (SFT) has become increasingly popular, which is reflected in its implementation in many clinical and forensic institutes. A large Dutch outcome study comparing SFT with Transference Focused Psychotherapy (TFP) on changes in borderline personality disorder criteria, quality of life, cost-effectiveness and drop-out demonstrated that SFT was superior to TFP (van Asselt et al., Reference van Asselt, Dirksen, Arntz, Giesen-Bloo, van Dyck, Spinhoven, van Tilburg, Kremers, Nadort and Severens2008; Giesen-Bloo et al., Reference Giesen-Bloo, van Dyck, Spinhoven, van Tilburg, Dirksen, van Asselt, Kremers, Nadort and Arntz2006). Despite the growing interest in SFT, empirical tests of central SFT concepts lag behind.
One of the central concepts in SFT is the so-called “schema modes” that represent the moment-to-moment emotional and cognitive states and coping responses that are active at a given point in time. Schema modes can be triggered by emotional events and an individual may shift from one mode into another. This way, the mode concept describes the rapid shifting in emotion and behaviour demonstrated by patients suffering from severe personality disorders (PDs) (Lobbestael, van Vreeswijk and Arntz, Reference Lobbestael, Leurgans and Arntz2007; Young, Klosko and Weishaar, Reference Young, Klosko and Weishaar2003). According to SFT, PDs are characterized by specific sets of modes. Young et al. (Reference Young, Klosko and Weishaar2003) identified 10 schema modes that can be grouped into four broad categories. The first category of modes is the maladaptive child modes that develop when certain basic emotional needs were not adequately met in childhood. The second category of modes is the dysfunctional coping modes that reflect an overuse of the coping styles of overcompensation, avoidance or surrender. Dysfunctional parent modes are the third mode category and they reflect internalized behaviour of the parents towards the patient as a child. Finally, there is the Healthy Adult mode, which includes functional cognitions, thoughts and behaviours (Young et al., Reference Young, Klosko and Weishaar2003). Next to the 10 modes, additional modes have been put forward to give a better description of specific PDs (Arntz and Bögels, Reference Arntz and Bögels2000; Lobbestael et al., Reference Lobbestael, van Vreeswijk and Arntz2007; Young et al., Reference Young, Klosko and Weishaar2003). Until now, three studies assessed mode presence in samples with PDs (Arntz, Klokman and Sieswerda, Reference Arntz, Klokman and Sieswerda2005; Lobbestael, Arntz and Sieswerda, Reference Lobbestael, Arntz and Sieswerda2005; Lobbestael, van Vreeswijk and Artnz, Reference Lobbestael, Vreeswijk and Arntz2008).
A first step in adequate mode assessment is the development and psychometric validation of a mode questionnaire. The mode questionnaires used so far only covered a limited set of modes. Therefore an international group recently developed the Schema Mode Inventory (SMI, Young et al., Reference Young, Arntz, Atkinson, Lobbestael, Weishaar, van Vreeswijk and Klokman2007) that purports to measure 16 schema modes. So far, no research has been done on the psychometric properties of the newly developed SMI. Because of the large number of SMI items (N = 270), the first goal of the current study was to develop a short version of the SMI. The second aim of this study was to provide reliability and validity data on this short SMI. Specifically, the factor structure of the short SMI was tested, as well as internal consistency of and the inter-correlations between the subscales. Next, test-retest reliability was estimated over a 4-week period. Since modes are hypothesized to be especially prominent in PD populations, it was tested whether schema modes scores monotonically increased from non-patient controls to Axis I patients to Axis II patients. Finally, concurrent validity of the SMI (i.e. convergent and divergent validity) was investigated.
Method
Participants
Data were analyzed from 863 participants, including 319 non-patient controls without psychopathology, 136 patients with Axis I and 236 patients with Axis II disorders. Thirty-seven participants were patients who did not meet the minimum required number of traits of any of the Axis I or II diagnoses. Sixteen participants were screened as non-clinical participants, but met some criteria on Axis I or II without fulfilling the complete diagnostic criteria for a specific disorder. Due to missing values, there were no SCIDs available for 119 non-patient controls. The data of 691 participants (319 non-patients controls, 136 Axis I and 236 Axis II patients) were used to assess monotonically increase of the modes. Fifty non-patients were used to assess test-retest reliability, and 348 participants (187 patients and 161 non-patients) for construct validity. The complete sample (N = 863) was used to assess the other research questions. Patients were recruited from general outpatient settings, chronic and acute inpatient and forensic mental health-care treatment institutes within the Netherlands and Belgium. The patients of the clinics and prisons were contacted to participate in this study by their therapists who were informed about the in- and exclusion criteria of the patients targeted for this study. The therapists provided general verbal information and an information letter of this study to these patients and if the patients indicated that they were willing to participate, they were contacted by the experimenter. Non-patient controls were recruited by means of advertisement. General exclusion criteria were age < 18 and > 70 years, intoxication by alcohol or drugs during testing, IQ below 80, and not being a native speaker of Dutch.
Of the 863 participants, 42.9% were male, 57.1% female. Mean age of the sample was 34 years (SD = 11.80, range 18–70). Ninety-six percent were Dutch, 2.8% Belgium, 0.9% had another nationality. One percent received no education, 6% attended primary school, 34.3% high school or low-level vocational studies, 27% completed secondary education and 31.7% a higher education. Thirty-nine percent were married, 60.8% were single. Of all patients, 58.5% were recruited from outpatient and 29.4% from inpatient settings and 12.1% from a forensic institute. Of the 744 participants who underwent SCID interviews, 12.4% had a borderline PD, 8.1% avoidant PD, 6.3% depressive PD, 4.9% antisocial PD, 4.6% obsessive-compulsive PD, and 3.5% paranoid PD. Other PDs occurred in 3% or less of the cases. Regarding Axis I diagnoses, 25.5% had an anxiety disorder, 19.8% a mood disorder, 14.3% substance abuse, 7.9% an eating disorder, and 4.6% a somatoform disorder.
Materials
Schema Mode Inventory, long version. English items were translated into Dutch using back translation; the most widely used and accepted method for obtaining equivalence between the source and target language. We used a forward translation from English to Dutch, a back translation from Dutch and English, and compared these two translations by a review team. Both forward and back translators and members of the review team were bilingual professionals who were also familiar with psychological terms. The two translators were blind to each other. Finally, the Dutch items were pilot tested on a small Dutch sample (n = 10, Wang, Lee and Fetzer, Reference Wang, Lee and Fetzer2006). A total of 270 items had to be scored on frequency using a 6-point scale ranging from “never or hardly ever” to “always”. An overall score was calculated from the scale sum score divided by the number of items in that scale. The higher the score, the more frequent were the manifestations of the modes. Items of the SMI reflected emotions, cognitions or behaviours. The number of items per scale ranged from 10 to 31. In order to reduce bias in the factor analysis and to minimize response tendencies, the items of the different SMI subscales were presented in a fixed random order. Administration time of this long SMI was about 40 minutes (for a description of the modes see Lobbestael et al., Reference Lobbestael, Vreeswijk and Arntz2008).
Screening instruments. The Structured Clinical Interview for DSM-IV Axis I and Axis II disorders (SCID I and SCID II, First, Spitzer, Gibbon, Williams and Benjamin, Reference First, Spitzer, Gibbon, Williams and Benjamin1994; First, Spitzer, Gibbon and Williams, Reference First, Spitzer, Gibbon and Williams1997) were used to assess DSM-IV Axis I and II diagnoses. Interviewers were psychotherapists or master-level students of psychology with at least one year clinical experience. Interviewers were extensively trained in a 2-day workshop in SCID administration by the first author of this manuscript and performed at least 10 SCID interviews in training sessions before administering the SCID interviews for this study autonomously. One hundred and fifty-one interviews of this study were rated twice (by means of audio taping the original interview), and yielded high inter-rater reliabilities values (Kappa values of SCID I diagnoses varied from .61 to .83, with a mean of .71; ICC for SCID II between .69 and .95, with a mean of .82; Lobbestael, Leurgans and Arntz, in press). Raters were blind to each other's diagnoses and to the patient's diagnoses.
Temperament and Character Inventory (TCI; Cloninger, Przybeck, Svrakic and Wetzel, Reference Cloninger, Przybeck, Svrakic and Wetzel1994). The TCI identifies seven basic personality dimensions based on Cloninger's psychobiological theory of personality, including four temperament and three characteristic dimensions. The TCI comprises 25 facets, and 13 of these were assessed for the current study, making a total of 96 items that had to be answered in a true-false format. Psychometric properties of the Dutch TCI were adequate (Duijsens, Spinhoven, Goekoop, Spermon and Eurelings-Bontekoe, Reference Duijsens, Spinhoven, Goekoop, Spermon and Eurelings-Bontekoe2000). Cronbach's α of the TCI subscale varied between .43 and .80 in the current sample. Research in Dutch samples demonstrated that the TCI subscales had adequate internal consistencies, with Cronbach α ranging from .62 to .90 with an average of .78 and good test-retest values (between .77 and .90, Duijsens and Spinhoven, Reference Duijsens and Spinhoven2000; Duijsens et al., Reference Duijsens, Spinhoven, Goekoop, Spermon and Eurelings-Bontekoe2000). Positive correlations were hypothesized to be found between the TCI revengefulness scale and the Angry Child and the Bully and Attack modes; TCI impulsiveness and Impulsive Child; TCI inpersistence and purposeless with Undisciplined Child; TCI uninhibited optimism with Happy Child; TCI detachment with Detached Protector; TCI persistence with Demanding Parent, and TCI self-acceptance and uninhibited optimism with the Healthy Adult mode. A negative correlation was expected between TCI independence and the Compliant Surrender mode.
Irrational Belief Inventory (IBI; Timmerman, Sanderman, Koopmans and Emmelkamp, Reference Timmerman, Sanderman, Koopmans and Emmelkamp1993). The IBI measures five dimensions underlying irrational beliefs (Ellis, Reference Ellis1962). This study only included the 14 Rigidity scale items that measured high moral values, that had to be scored on a 5-point Likert scale, ranging from “strongly agree” to “strongly disagree”. Psychometric properties of the Dutch IBI were adequate (Koopmans, Sanderman, Timmerman and Emmelkamp, Reference Koopmans, Sanderman, Timmerman and Emmelkamp1994). Cronbach's α of this subscale was .79 in the current sample. Research indicated that the Rigidity scale is highly reliable (α = .85) and has good validity (Koopmans et al., Reference Koopmans, Sanderman, Timmerman and Emmelkamp1994). The sum of the rigidity items was hypothesized to correlate with the Punitive Parent mode.
State-Trait Anger Scale (STAS; Spielberger, Jacobs, Russel and Crane, Reference Spielberger, Jacobs, Russel, Crane, Butcher and Spielberger1983). The STAS measures trait and state anger. Each scale has 10 items with four response categories, ranging from “almost never” to “almost always”. Psychometric properties of the Dutch STAS were adequate (van de Ploeg, Defares and Spielberger, Reference van de Ploeg, Defares and Spielberger1982). Cronbach's α of this subscale was .95 in the current sample. The scale validity was good to excellent for the trait anger (varied between .88 and .94; mean = .91), and good for the state scale (between .75 and .88; mean = .81). Test-retest reliability for trait anger was high (α = .78, van de Ploeg et al., Reference van de Ploeg, Defares and Spielberger1982). Since the SMI-r is trait-defined, trait anger was hypothesized to correlate positively with the Angry and Enraged Child, and the Bully and Attack modes.
Personality Disorder Belief Questionnaire (PDBQ; Dreessen and Arntz, Reference Dreessen and Arntz1995). The PDBQ assesses PD-specific beliefs. This study only included the Narcissism scale consisting of 20 assumptions that had to be rated on 100 VAS-scales, anchoring “I don't believe this at all” and “I believe this completely”. No previous study assessed the PDBQ Narcissism scale but internal consistency of the Narcissistic scale of the Personality Belief Questionnaire (which resembles the PDBQ very much) proved to be good (α = .85, Butler, Brown, Beck and Grisham, Reference Butler, Brown, Beck and Grisham2002). Furthermore, Cronbach α of this subscale was .93 in the current sample. The Narcissism scale of the PDBQ was expected to show a positive correlation with the Self Aggrandizer mode.
Loneliness Scale (LS; de Jong Gierveld and van Tilburg, Reference de Jong Gierveld and van Tilburg1999). The LS defines loneliness as a subjective experience that is not directly related to situational factors. The LS is an 11-item questionnaire referring to social and emotional loneliness that has to be scored on a 5-point scale ranging from “yes” to “no”. Psychometric properties of the LS were adequate (de Jong Gierveld and van Tilburg, Reference de Jong Gierveld and van Tilburg1999). Cronbach's α of this subscale was .98 in the current sample. Scale reliability was between .80 and .90 (Cronbach's α or rho), the scale homogeneity with Loevingers’ H varied in the .30 to .50 range (de Jong Gierveld and van Tilburg, Reference de Jong Gierveld and van Tilburg1999). The LS was expected to show a positive correlation with the Vulnerable Child mode.
Relationship Scales Questionnaire (RSQ; Griffin and Bartholomew, Reference Griffin, Bartholomew, Bartholomew and Perlman1994). The RSQ contains 30 attachment statements. The current study only included the four items of the Fearfulness attachment that had to be rated on a 5-point scale, ranging from “not at all like me” to “very much like me”. Internal consistency of this scale in the current sample was α = .77. Fearful attachment was hypothesized to correlate positively with the Vulnerable Child mode and the Detached Protector mode.
Utrecht Coping List (UCL; Schreurs, van de Willige and Brosschot, Reference Schreurs, van de Willige and Brosschot1993). The UCL measures 7 types of coping behaviour of which only the Palliative reaction pattern (distraction seeking to not having to think about the problem) was included for this study. The 8 items had to be scored on a 4-point Likert scale from “seldom or never” to “very often”. Psychometric properties of the UCL proved to be adequate (Schreurs et al., Reference Schreurs, van de Willige and Brosschot1993). Cronbach's α of this subscale was .72 in the current sample. The palliative scale has a reasonable reliability (Cronbach α's vary from .64 to .76, mean = .69, test-retest vary from .52 to .69, mean = .57, Schreurs et al., Reference Schreurs, van de Willige and Brosschot1993). Palliative reaction was expected to correlate with the Detached Self-Soother mode.
Childhood Trauma Questionnaire (CTQ; Bernstein and Fink, Reference Bernstein and Fink1998). The CTQ (28 items) consists of 5 clinical scales: physical, emotional and sexual abuse, and physical and emotional neglect, and a 3-item minimization/denial scale to detect maltreatment under-reporting. Each had to be scored on a 5-point Likert scale ranging from “never true” to “very often true”. Psychometric properties of the CTQ proved to be adequate (Bernstein et al., Reference Bernstein, Stein, Newcomb, Walker, Pogge, Ahluvalia, Stokes, Handelsman, Medrano, Desmond and Zule2003; Scher et al., Reference Scher, Stein, Asmundson, McCreary and Forde2001). Cronbach's α of this subscale was .94 in the current sample. All 5 scales showed adequate to good reliability (mean α ranging from .69 to .94), and the reliability for the entire measure was .91. Self-report responses on the CTQ scales are highly stable over time and show good convergent and divergent validity with trauma histories that have been ascertained by other measures (Bernstein et al., Reference Bernstein, Stein, Newcomb, Walker, Pogge, Ahluvalia, Stokes, Handelsman, Medrano, Desmond and Zule2003; Scher, Stein, Asmundson, McCreary and Forde, Reference Scher, Stein, Asmundson, McCreary and Forde2001). A positive relationship between the CTQ and the Vulnerable Child mode was expected.
Procedure
Participants were tested individually. First, SCID I and II were administered, which took 1–4 hours. In the next 2-hour session, participants filled out the SMI and the questionnaires to assess construct validity. All participants signed informed consent and received a financial compensation of 5 euros. This study was approved by the Medical Ethical Committee of the Academic Hospital in Maastricht.
Statistical analyses
Construction of the short SMI out of the long SMI. Since mild deviations from normality were found in SMI item scores, ratings were square root transformed. The factor structure of the long version of the SMI (270 items) was assessed by means of Confirmatory Factor Analyses (CFA), employing Structural Equation Modeling (SEM, LISREL software 8.54, Jöreskog and Sörbom, Reference Jöreskog and Sörbom2001). The fits of three models were tested: (1) The original structure of the SMI with 16 subscales, which was the most differentiated model. (2) An eight-factor model in which the modes were clustered thematically. This semi-parsimonious model contained three childhood factors: vulnerability (Lonely and Abandoned/Abused Child), anger (Angry and Enraged Child), and lack of discipline (Impulsive and Undisciplined Child); three maladaptive coping factors: surrender (Compliant Surrender), avoidance (Detached Protector and Detached Self-Soother) and overcompensation (Self-Aggrandizer, Over Controller and Bully/Attack mode); one maladaptive parent factor (Punitive and Demanding Parent); and one healthy factor (Happy Child and Healthy Adult). (3) A four-factor model reflecting the four main mode categories: dysfunctional child modes, dysfunctional parent modes, dysfunctional coping modes and healthy modes. Because the Happy Child mode differs markedly from the other child modes in that it is the only non-pathological mode, the Happy Child mode was combined with the Healthy Adult mode into one adaptive factor in this four-factor model. This final model was the most parsimonious. Missing data were estimated by means of multiple imputation for missing value analyses, using the regression method in which all SMI items were the predictors. The goodness-of-fit was evaluated using the comparative fit index (CFI), the Non-Normed Fit Index (NNFI), the Standardized Root Mean Square Residual (SRMR), the Root Mean Square Error of Approximation (RMSEA), the χ2-test and the degrees of freedom. Following Hu and Bentler (1999), CFI, NNFI, values above .95, SRMR values below .08, and RMSEA values below .07 are considered indicative of a good fit.
Second, the Multiple Group Method (MGM; Holzinger, Reference Holzinger1944) was used to select the items for the short SMI for each scale of the model that showed the best fit in the CFA. MGM is based upon a correlation matrix of each item with each scale. The method consists of (a) constructing the subscales as simple sums of the items assigned to that particular subscale; (b) computing the item-rest correlations within each subscale (i.e. the correlation between an item and the sum of all items belonging to the subscale, except for the considered item). If an item correlated strongest with the subscale to which it was assigned to a priori, that item fitted well with that scale. If not, this item was removed from the long SMI version to develop the short SMI. It was aimed that each subscale of the short SMI would consist of a maximum of 10 items. The 10 items were chosen that correlated the strongest with their a priori hypothesized scale and that loaded higher on their hypothesized scales than on their non-hypothesized scales.
Reliability and validity of the short SMI. First, CFA was performed for three models of the short SMI: the 14-, 8- and 4-factor models (for a more detailed explanation see the statistical analyses section of the long SMI). Second, internal consistency of the SMI subscales was assessed by calculating Cronbach's α: following Nunnally and Bernstein (Reference Nunnally and Bernstein1994), Alpha coefficients higher than .70 were considered acceptable. Third, inter-correlations between the subscales of the short SMI were calculated with correlations corrected for attenuation due to imperfect internal reliability values of the subscales. These attenuated correlations give an estimate of the correlations between subscales if reliabilities would be perfect, thus a better estimate of the true correlations than raw correlations. Fourth, test-retest reliability over a 4-week period was calculated in a healthy sample using the intra-class correlation coefficient (ICC) and 95% confidence intervals. Finally, ANOVA trend analyses were used to test the hypothesis that scores on the subscales of the short SMI would monotonically increase from non-patient controls, to Axis I patients, to Axis II patients. Linear and quadratic effects were evaluated. In addition, linear regression analyses were performed for each mode (defined as the dependent variable) with the number of Axis I disorders and the strength of Axis II disorders (calculated by adding all scores of all PD criteria) as predictors. This way, it could be assessed whether the modes were predicted by the number of Axis I disorders and/or the severity of Axis II disorders. Furthermore, it was evaluated whether the number of Axis I disorders had an additional value over and above the severity of Axis II disorders in explaining the scores on the short SMI modes by calculating R2 Change values by means of stepwise linear regression with Axis I disorders as predictors in step 1 and Axis II severity as predictors in step 2. These stepwise linear regression analyses were also performed with the severity of Axis II disorders as the predictor in step 1, and the number of Axis I disorders as the predictor in step 2, to assess the incremental value of Axis I pathology above Axis II pathology in explaining mode scores. Concurrent validity was assessed by means of correlations corrected for attenuation between the short SMI subscales and the construct questionnaires. Pearson values of .70 or more were considered to be indicative of good convergent validity, while values of .30 or lower reflect good divergent validity.
Results
Construction of the short SMI
Table 1 provides the goodness-of-fit indices for the three models of the long SMI. The CFI and NNFI values of all models were above .95. SRMR values were too high for all models, while the RMSEA was below .08 for the most differentiated and the semi-parsimonious models. The differences between the chi-squares of the three models were significant (p < .001 for all models), indicating that the 16-factor model provided a better fit than the 8- and 4-factor solutions for the long SMI, also indicated by CFI, NNFI, and RMSEA.
Table 1. Goodness-of-fit indices of the long (270 items) and short (118 items) SMI (N = 863)

Note: CFI = Comparative Fit Index; NNFI = Non-Normed Fit Index; SRMR = Standardized Root Mean Square Residual; RMSEA = Root Mean Square Error of Approximation; χ2 = chi-square; df = degrees of freedom; * this model is significantly better than the other models at the p<.001 level. In all 6 cases, the more differentiated models were significantly better (p’s<.001) than the less differentiated models.
MGM analyses were used to select the items best presenting the 16 different modes. Ten items were selected for seven SMI subscales that loaded uniquely on their a priori hypothesized scale; Angry Child, Enraged Child, Happy Child, Self-Aggrandizer, Punishing Parent, Demanding Parent and Healthy Adult mode. For seven other subscales, only 4 to 9 items appeared to load uniquely on their subscales; Impulsive Child (9 items), Undisciplined Child (6 items), Compliant Surrender (7 items), Detached Protector (9 items), Detached Self-Soother (4 items), Bully and Attack (9 items) and Demanding Parent (9 items). For the subscales of the Abandoned and Abused Child and for the Over Controller, not enough items could be selected that loaded uniquely on these scales. Because of high theoretical resemblance between the scales of the Lonely Child and that of the Abandoned and Abused Child, these two scales were clustered together, constituting the Vulnerable Child mode, which parallels Young's 10 mode division (Young et al., Reference Young, Klosko and Weishaar2003). Ten items were selected that represented this Vulnerable Child mode in a unique way. The Over Controller subscale was left out of the short SMI version and subsequent analyses. In conclusion, the short version of the SMI consisted of 14 subscales, and the number of items ranged between 4 and 10, with a mean of 8.4 items per scale, with a total of 124 items.
Factor structure of the short SMI
The first factor analyses revealed inadequate item loadings for 6 items; one item of the Undisciplined Child, one of the Enraged Child, one of the Impulsive Child, and three of the Demanding Parent mode. Subsequently, these items were removed from the questionnaire, leading to N = 118 items. Table 1 provides the goodness-of-fit indices for three models of the short SMI. CFI and NNFI values of all models were above .95. The SRMR was only below .08 and the RMSEA below .07 for the most differentiated model, which indicates an adequate fit for this model. The differences between the chi-square values of the three models were significant (p < .001 for all models), indicating that the 14-factor model provided a better fit than the 8- and 4-factor solutions, also apparent from the four fit indices.
Internal consistency, item loadings and correlations between subscales of the short SMI
The internal consistencies of the subscales of the short SMI (see Table 2) were all acceptable (ranging from α = .79 to α = .96), as was their mean (α = .87). Item loadings were adequate (item loadings above .40). Mean item loadings per subscale of the 14-factor solution varied between .53 and .85, with a mean of .68 (see Tables 2 and 3).
Table 2. Internal reliability of the short SMI subscales (N = 863)

Table 3. Item loadings of the SMI for the 14-factor model (N = 863)
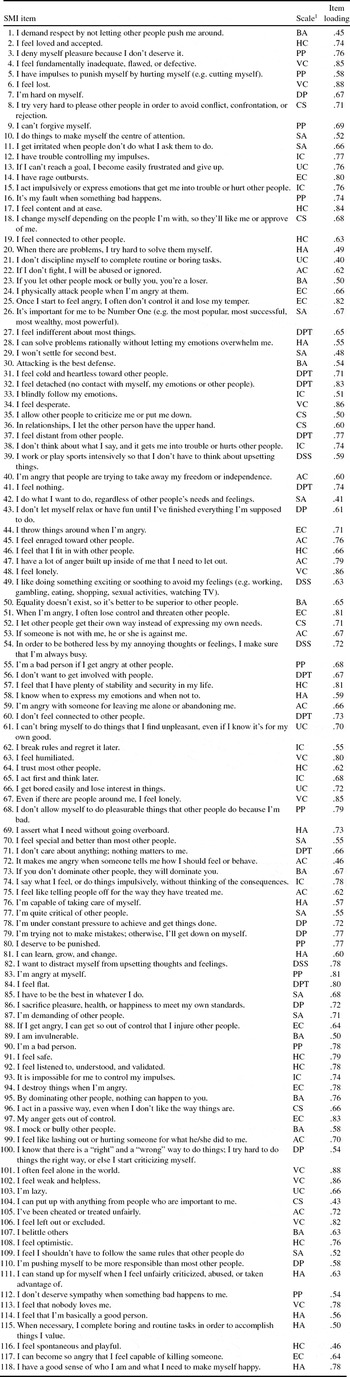
Note. VC = Vulnerable Child; AbC = Abandoned and Abused Child; AC = Angry Child; EC = Enraged Child; IC = Impulsive Child; UC = Undisciplined Child; HC = Happy Child; CS = Compliant Surrender; DPt = Detached Protector; DSS = Detached Self-soother; SA = Self-Aggrandizer; BA = Bully and Attack; PP = Punitive Parent; DP = Demanding Parent; HA = Healthy Adult.
The factor inter-correlations corrected for attenuation between the short SMI subscales are presented in Table 4. All maladaptive modes correlated positively with each other, as did the two adaptive modes. Adaptive modes correlated negatively with all maladaptive modes. Mean intercorrelation of all positive values was .59, and mean intercorrelation of all negative values was –.54. The mean correlation between all maladaptive child modes was .64, the mean correlation between the coping modes was .54, and the maladaptive parent modes correlated .66 with each other. The healthy modes correlated .85 with each other. Despite some high correlations, none of the confidence intervals (± 2 * SE; Anderson and Gerbing, Reference Anderson and Gerbing1988) around the correlation estimates between two subscales included 1.0, suggesting that the SMI subscales do represent distinct constructs.
Table 4. Factor inter-correlations between the short SMI subscales, corrected for attenuation (N = 863)

Note. VC = Vulnerable Child; AbC = Abandoned and Abused Child; AC = Angry Child; EC = Enraged Child; IC = Impulsive Child; UC = Undisciplined Child; HC = Happy Child; CS = Compliant Surrender; DPt = Detached Protector; DSS = Detached Self-soother; SA = Self-Aggrandizer; BA = Bully and Attack; PP = Punitive Parent; DP = Demanding Parent; HA = Healthy Adult.
Test-retest
Fifty out of 319 healthy controls (16%) who filled out the short SMI at baseline, were re-administered the short SMI again 4 weeks later (retest), with a maximum deviation of 3 days. This subsample of 50 non-patients was composed out of 41 students and 9 respondents from the open population, 12 men and 38 women, with a mean age of 26.44 (SD = 11.19, range 18–57), and of which 33 were single and 17 married or lived together. This subsample was significantly younger, t = 3.56, df = 317, p < .001, higher educated, t = 2.55, df = 317, p = .01, and more frequently single, chi-sq. = 51.82, p < .001, df = 1, compared to other non-patients. These differences are inherent to the fact that the retest subsample consisted mainly of students (82%), while other non-patients were mainly respondents from the open population (54.4%). However, there were no significant differences on the scores on the subscales of the short SMI between both groups, using Bonferonni's correction for multiple testing (p = .05/16 = .003), range F(1,226) = 1.47, p = .23 to F(1,226) = 0, p = .99. This indicated that despite both groups not being comparable in biographic characteristics, they were in mode scores.
Table 5 displays means and standard deviations for the baseline and retest measures of all schema modes, along with the paired sample t-tests, ICC values and 95% confidence intervals. Differences in baseline and retest scores were not significant for any of the modes at a p<.001 level. Test-retest reliability of the separate modes ranged from .65 to .92, p's < .001, with a mean of .84. These results indicate adequate test-retest reliabilities for all schema modes of the short SMI.
Table 5. Mean and standard deviations of baseline and retest measurement and test-retest reliability of the short SMI (N = 50)
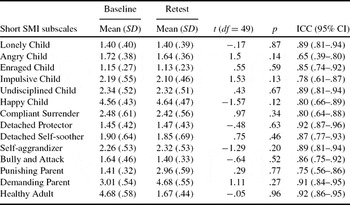
Note. * p < .001
Scores in the subgroups
Mean scores and standard deviations on all modes are presented in Table 6 for non-patient controls, Axis I and Axis II patients, along with the results of the trend analyses. All linear trends were significant (p's < .001) indicating that the scores of all maladaptive modes increased monotonically over these three groups. The scores on the adaptive modes decreased monotonically over the three groups (p’s < .001). In addition, there was a negative quadratic trend for the Angry Child and the Detached Self-Soother, and a positive quadratic trend for the Happy Child mode. This indicated that in these mode scores, there was a large difference between the non-patients and Axis I patients, and a small difference between Axis I and Axis II groups.
Table 6. Means, standard deviations and trend analyses of the short SMI subscales in three subsamples (N = 691)

Note. δ1 = Cohen's δ Axis I patients versus NpCs; δ2 = Cohen's δ Axis II patients versus NpCs;
*significant at p < .05; **significant at p < .001.
The regression weights of Axis I and Axis II pathology on the prediction of the mode scores are presented in Table 7. Regression weights of the Axis I disorders varied from .06 to .36 (weights of the adaptive modes reversed in sign) with a mean of .19. Changes in explained variance due to Axis I pathology above Axis II pathology varied between .3 and 10.4%, with a mean of 3.5%. The number of Axis I disorders predicted 10 out of 14 modes (all but the Enraged, Impulsive and Undisciplined Child, and the Bully and Attack modes) above the severity of Axis II disorders. Regression weights of Axis II severity varied from .13 to .41 (weights of the adaptive modes reversed in sign) with a mean of .31. Changes in explained variance due to Axis II pathology above Axis I pathology varied between 1.3 and 13.6%, with a mean of 8.1%. In both analyses, a reversed effect was found for the Happy Child and Healthy Adult modes, indicating that the more severe the PD and Axis I pathology, the less strong these adaptive modes. These results indicate that although both Axis I and Axis II contributed to the explained variance of most of the modes independently of each other, the effect of Axis II pathology on the explained variance of the modes was stronger.
Table 7. Regression analyses of the number of Axis I disorders and the severity of Axis II disorders on the modes (N = 691)

Note. *significant at p < .05 **significant at p < .001.
Construct validity
Table 8 depicts the Pearson correlations of the predicted and unpredicted associations of the short SMI and the theoretically linked questionnaires. Although all of the expected correlations appeared to be significant (with the exception of the correlation between the short SMI Undisciplined Child and TCI Inpersistence scale), eight predicted associations exceeded a Pearson value of .70. More specifically, good convergent validity was shown between the Vulnerable Child, Enraged Child, Happy Child, and the Demanding Parent modes and their a-priori predicted associations. In addition, although two other predicted strong associations between the Compliant Surrender and Healthy Adult and the other questionnaires were (slightly) lower than .70, these associations were higher than the non-predicted associations of those modes. The adaptive modes of the Happy Child and Healthy Adult correlated highly with the positive TCI scales. Contrary to our expectations, the trait anger of the STAS correlated higher with the modes of the Impulsive Child, the Undisciplined Child, the Detached Self-Soother and the Punishing Parent modes than with their a-priori hypothesized mode scales. Likewise, the Detached Self-Soother and Punishing Parent modes revealed a higher Pearson correlation with the Loneliness Scale, compared to the hypothesized correlations. The non-expected correlations were mostly lower than the expected ones and 135 of these 259 correlations were lower than .30. Thus approximately 52% of the correlations displayed good discriminant validity. In sum, eight of the 21 a-priori predictions of convergent validity were adequately reproduced by the data, while 2 other associations, although not meeting the .70 criterion, pointed in the good direction, providing empirical support for concurrent validity of half of the subscales of the short SMI. In addition, the short SMI displayed moderate discriminant validity.
Table 8. Correlations corrected for attenuation between short SMI subscales and theoretically linked questionnaires (N = 348)

Note. TCI = Temperament and Character Inventory; IBI = Irrational Belief Inventory; STAS = State-Trait Anger Scale; PDBQ = Personality Disorder Questionnaire; LS = Loneliness Scale; RSQ = Relationship Scales Questionnaire; UCL = Utrecht Coping List; CTQ = Childhood Trauma Questionnaire; VC = Vulnerable Child; AC = Angry Child; EC = Enraged Child; IC = Impulsive Child; UC = Undisciplined Child; HC = Happy Child; CS = Compliant Surrender; DPt = Detached Protector; DSS = Detached Self-soother; SA = Self-Aggrandiser; BA = Bully and Attack; PP = Punitive Parent; DP = Demanding Parent; HA = Healthy Adult. Bold figures are significant at p<.05; underlined figures reflect predicted associations.
Discussion
We tested the psychometric properties of a new questionnaire for assessing schema modes; the Schema Mode Inventory (SMI). In order to improve the discrimination between the SMI subscales and to increase feasibility for both research and clinical purposes, a short version of the SMI was developed consisting of 118 items. Results showed an adequate fit for the 14-factor model of this short SMI, acceptable internal reliability of its subscales, moderate to high intercorrelations between the subscales, and reasonable construct validity.
The short SMI proved to be best underlined by a 14-factor model. This indicates that it is preferable to distinguish the modes in separate subscales. Despite the fact that the fit indices of the more parsimonious were only slightly poorer than those of the 14-factor model, there are two reasons why the 14-factor model is preferable. First, although not unusual for large samples, the comparative statistical chi-square tests revealed that the 14-factor model was better than the alternative factor models. In addition, the fact that factors correlate highly does not necessary imply that these factors are the same, which was also exemplified by different correlations obtained with the questionnaires of the construct validity assessment. Second, there are strong content-related reasons to opt for a 14-factor model of the short SMI; therapists confirm the theoretical assumption that there are subtle, but very important differences between the different modes. The Detached Protector and Detached Self-Soother scales for instance are highly correlated. Both refer to emotional withdrawal but the behaviour associated with these two modes is very different; for the Detached Protector mode, robotic-like behaviour and feelings of emptiness are central, while the Detached Self-Soother mode is characterized by active self-soothing behaviour such as overeating. In addition, choosing for example a 4-factor solution would seriously undermine the descriptive ability of the SMI for PD pathology. Saying, for example, that a particular borderline PD patient has a strong maladaptive child mode (one of the four factors), is not informative since the different maladaptive child modes differ highly in nature (e.g. aggressive feelings in the Angry Child mode and feelings of loneliness in the Vulnerable Child mode), and are associated with different developmental features (e.g. the Vulnerable Child is specifically related to childhood abandonment and abuse). Not only are these modes theoretically associated with different PDs, a recent study of our group demonstrated that the Detached Self-Soother and not the Detached Protector mode was associated with obsessive-compulsive PD (Lobbestael et al., Reference Lobbestael, Vreeswijk and Arntz2008). These different pathology correlates between highly associated modes underline the unique contribution of the modes, pleading for a more fine-grained 14-factor model.
Test-retest reliabilities were adequate. Although at first sight this result indicates that mode scores are highly stable over time, some considerations need to be taken into account. First, the retest population consisted mainly of students; it cannot be predicted whether the remaining healthy population would demonstrate equally high stability in mode assessment over time. Second, it could be argued that mode scores in patients with severe PDs will be far more unstable due to their characteristic dysregulation and unstable affects (Clark, Livesly and Morey, Reference Clark, Livesly and Morey1997; Clark and Harrison, Reference Clark, Harrison and Livesly2000). Future studies should investigate the temporal stability of modes in a non-student population and in PD-samples in order to further investigate the theoretical claim of mode instability in PD patients.
Results confirmed that the presence of all dysfunctional modes increased significantly from non-patient controls to Axis I patients to Axis II patients and decreased in a similar way for functional modes. Furthermore, the strength of PDs predicted the presence of all modes over Axis I pathology, while the number of Axis I disorders predicted 13 out of 16 modes above Axis II pathology. In addition, Axis II pathology explained a higher percentage of the variance than Axis I pathology. These data underscore the assumption that schema modes are mainly correlated to PDs.
Although many of the results on the construct validity of the short SMI pointed in the good direction, only half of the associations reached levels we had a priori set with respect to convergent validity. Half of the non-predicted associations demonstrated good discriminant validity. Possibly this moderate construct validity can be ascribed to the fact that modes reflect a combination of several features. For instance, no single emotion is represented in one mode, but rather a combination of emotions, beliefs and behaviours. In contrast, most questionnaires used to assess construct validity represent quite isolated emotions, thoughts or behaviours.
In selecting items for the subscales of the short SMI that loaded uniquely on their hypothesized subscales, insufficient items were found for the Abandoned and Abused Child and for the Over Controller modes. The reason for this might be that the items for these two scales were formulated too broadly and therefore lacked specificity. Another reason might be that, although their developmental origins may differ, it is not possible to distinguish between these variants of the Vulnerable Child mode based on self-report. This issue awaits further tests. We also suggest that the Over Controller subscale should be split into two subscales: the Perfectionistic Over Controller, which would be mainly displayed by patients with an obsessive compulsive PD, and the Suspicious Over Controller that would characterize patients with a paranoid PD. The present SMI did not have enough items specific to these hypothesized constructs to test their existence.
Despite the current study being conducted with a large sample (N = 863), it remains arguable whether this is sufficient for the CFA analyses, due to the large number of items in the SMI (N = 270 for the long SMI and N = 118 for the short SMI). Rules of thumbs with respect to the subject to item ratio differ widely (see e.g. Bentler, Reference Bentler1989; Boomsma, Reference Boomsma, Joreskog and Wold1982; Nunnally, Reference Nunnally1967). Consequently, strict rules regarding sample size have mostly disappeared and been replaced by the view that adequate sample size is partly determined by the nature of the data (see e.g. MacCallum, Zhang, Hong and Widaman, Reference MacCallum, Zhang, Hong and Widaman1999). The fact that we obtained fit sizes of this magnitude in the present sample does not elicit reasons to doubt the adequacy of the sample size of this study.
Clearly, this study is only a small contribution to the validation of constructs used in SFT. A lot of work still needs to be done. With respect to the short SMI, an independent replication and assessment of test-retest reliability in patient samples is important. Because mode conceptualizations of PDs are still in progress, several additional modes have been proposed. For example, Bernstein, Arntz and de Vos (Reference Bernstein, Arntz and de Vos2007) hypothesized that psychopaths are characterized by a Predator mode and a Conning and Manipulative mode. These mode scales should be operationalized and added to the current short SMI. Clearly, it should be critically assessed whether further differentiation of modes is desirable, and to which degree it is still statistically advisable to further add schema modes. Efforts should be made to assess mode-related behaviour, emotion and information processing by means of naturalistic, experimental or observational studies. With regard to mode switching, it would be of special interest to study the effect of mode presence in reaction to mood inductions, as was done by three previous studies by our group (Arntz et al., Reference Arntz, Klokman and Sieswerda2005; Lobbestael and Arntz, Reference Lobbestael and Arntz2010; Lobbestael, Arntz, Cima and Chakhssi, Reference Lobbestael, Arntz, Cima and Chakhssi2009).
Despite SFT research being still in its infancy, this study provides a broad range of psychometric data of the short SMI, and forms a first step in the foundation of a central SFT construct. The psychometric results indicate that the short SMI is a valuable measure that can be of use for mode assessment in SFT.
Acknowledgements
Thanks are due to Annette Lobbes, Christine van Giesen, Minda Dijkstra, Sarah Holla, Tamara Schrijvers and Yvette Heanen for their help in collecting the data. We are grateful for the collaboration of the direction board, staff and patients of the Correctional Institutes “Ter Peel” in Evertsoord and “de Geerhorst” in Sittard; the “Rooyse Wissel” in Venray and Maastricht; the “RIAGG” Maastricht; GGZ Midden Brabant and Midden Limburg; Mutsaersoord, Venray; the Symfora group, Amersfoort; the “Pompekliniek” in Nijmegen; “Lianarons” in Heerlen; GGZ Delfland in Delft and the “Viersprong” in Halsteren – all in the Netherlands – and the Correctional Institute of Brugge and “Medisch Centrum Sint-Jozef”` in Bilzen, both in Belgium.


Comments
No Comments have been published for this article.