

The influence of elected officials’ performance on voters’ decision-making has long been a central question for political scientists (for reviews, see Ashworth Reference Ashworth2012; Healy and Malhotra Reference Healy, Malhotra and Mo2013). The evidence of retrospective voting in national elections is strong, and it emphasizes the impacts of economic conditions, wartime success, and government spending (e.g., Kramer Reference Kramer1971; Kriner and Shen Reference Kriner and Shen2007; Duch and Stevenson Reference Duch and Stevenson2008; Healy and Malhotra Reference Healy and Malhotra2009; Gasper and Reeves Reference Gasper and Reeves2011). Yet, the extensive literature on retrospective voting has focused overwhelmingly on national elections, with limited attention to state-level elections (e.g., Stein Reference Stein1990; Atkeson and Partin Reference Atkeson and Partin1995; Carsey and Wright Reference Carsey and Wright1998; Ebeid and Rodden Reference Ebeid and Rodden2006) and almost none to local elections (but see Berry and Howell Reference Berry and Howell2007; Oliver and Ha Reference Oliver and Ha2007).
Despite this lack of attention, large cities are a critical arena in which to examine retrospective voting. Substantively, large cities make consequential decisions on issues ranging from public safety to economic questions of land use and transportation. Many of these decisions’ consequences are tangible and immediate in the lives of city residents in a way that state- and national-level decisions are not, a fact which might facilitate retrospective voting (see also Arnold and Carnes Reference Arnold and Carnes2012). The failure of New York Mayor John Lindsay to plow Queens after a major snowstorm in 1969—and the political fallout—is just one example among many.
In theory, there are a wide variety of local conditions that might influence mayoral elections, from the local economy to crime rates or even sports victories. This paper develops hypotheses for why several such factors might shape voters’ evaluations of incumbent mayors. For example, local economic conditions are likely to be applicable and influential across big-city elections. Economic conditions are already known to serve as a benchmark for presidential and gubernatorial performance, and they are widely covered by local news outlets. Similarly, crime is a prominent issue in many American cities, one that has already been linked to mayoral approval in New York City (Arnold and Carnes Reference Arnold and Carnes2012).
At the same time, this paper seeks to provide an explanation for how local-level retrospective voting may differ from its national analog, one that has the potential to deepen our understanding of the mechanisms underpinning retrospective voting. To learn about conditions in a nation of ~320 million people, citizens almost necessarily must rely on media outlets. But at the city level, it is plausible that their alternate sources of information could be relevant, including their personal experiences and information conveyed through social networks. It is also possible that such assessments will be relative to a national benchmark. That is, given the prominence of reporting on national conditions, we also expect that local conditions will be assessed relative to national conditions, just as state-level conditions are (Cohen and King Reference Cohen and King2004; Wolfers Reference Wolfers2007).
To test these hypotheses, we compile a novel data set of mayoral elections between 1990 and 2011. When we focus on those elections that featured an incumbent, were not landslides, and had no missing data, we are left with 341 elections in 115 large cities. Drawing on dozens of sources, we are then able to estimate the relationship between local unemployment and general-election support for the incumbent mayor.
Property values and crime rates are salient features of life in some cities, but we find no clear evidence that they shape support for the incumbent mayor. Instead, we identify a strong relationship between a city’s relative economic performance and mayoral support. Overall, when compared with a mayor in a city where the unemployment rate matches the nation’s, a mayor whose city’s unemployment rate is 2.45 percentage points below the national level (i.e., 1 SD) can expect to earn 2.7 percentage points more support.Footnote 1 In all, 13 of the 341 elections in our data set were decided by less than 2.7 percentage points, so these results are substantively meaningful. Using various robustness checks, we demonstrate that these results are not sensitive to seemingly incidental choices in collecting or modeling the data. Nor do they appear to result from selection biases inherent in incumbent mayors’ decisions to seek re-election.
Our results also shed light on the mechanisms that underpin these effects. In aggregate, voters appear unresponsive to year-to-year changes in local conditions—what matters is a city’s performance relative to the rest of the country, not relative to its own past. That makes city-level retrospective voting distinctive from its national-level analog. We also find no strong evidence that retrospective voting differs across cities based on institutions including partisan nominations, partisan balloting, on-cycle elections, mayor–council systems, or mayoral term limits. We do, however, find that the effect holds only in cities at the center of their TV or newspaper media markets, a fact which suggests the importance of local news outlets in conveying information about how the local economy is doing. This evidence bolsters earlier claims that retrospective voting is primarily sociotropic, since we uncover retrospective voting only in places where voters have readily available information about citywide conditions. In the conclusion, we discuss the implications of these findings for retrospective voting and the future direction of mayoral elections. At a time when local news is facing declining audiences, these results suggest that retrospective voting in big-city mayoral elections might be increasingly limited in the years to come.
Retrospective Voting in Mayoral Elections
At the national level, there is a wide range of conditions that might influence voting, including everything from gas prices to homicides or responses to natural disasters. Such conditions are thought to shape vote choices both retrospectively and prospectively, with voters considering past conditions while also projecting future conditions. In this paper, we follow much of the recent research by focusing on retrospective voting.Footnote 2 Specifically, this section reviews the growing body of research on retrospective voting with an emphasis on studies which examine state or local elections. Attentive to the differences between national and local information environments, we then develop a series of hypotheses about the conditions likely to foster retrospective voting in US cities.
Economic Voting in State and Nation
In US politics, there are few facts as widely agreed upon as the role of the economy in shaping support for presidential candidates (e.g., Vavreck Reference Vavreck2009). In explaining this pattern, some emphasize the immediacy of the economy. Since virtually all American voters participate in the economy in some capacity, information about economic conditions is widely available (e.g., Popkin Reference Popkin1994). Yet, as researchers began to probe the relationship at the individual level, they identified an important caveat. Voters appeared to be voting based on their perceptions of national economic performance, not their own personal finances (Kinder and Kiewiet Reference Kinder and Kiewiet1981). Such voting is called “sociotropic,” as it is oriented toward a social group rather than an individual. There is a logic to sociotropic economic voting: while the president or other politicians are unlikely to be the cause of an individual’s promotion or a sudden inheritance, it is more reasonable to think that they can influence economic conditions in the nation as a whole (Kiewiet and Rivers Reference Kiewiet and Rivers1984).
Still, the persistence of presidential voting that is sociotropic, retrospective, and economic raises additional questions, including what information voters use to develop their perceptions of economic performance. While voters have personal experience with their own finances, they must rely on information from the mass media (Hetherington Reference Hetherington1996), their local contexts (Books and Prysby Reference Books and Prysby1991; Ansolabehere, Meredith and Snowberg Reference Ansolabehere, Meredith and Snowberg2011; Reeves and Gimpel Reference Reeves and Gimpel2012; Healy and Lenz Reference Healy and Lenz2014a), or else their social networks (Popkin Reference Popkin1994) to build an image of the national economy. Among those sources, only the mass media is likely to provide a sufficiently broad impression of national economic conditions in a large country. Yet, newspapers and broadcast television are available in virtually all corners of the United States today. At the national level, that fact makes it difficult for researchers to identify the effects of the economic information itself.
In reality, the US federal government has a limited capacity to shape the economy. But such limitations are even more binding at the state and local levels, as states and localities have fewer policy instruments at their disposal, face mandates from higher levels of government (Nivola Reference Nivola2002), frequently have balanced-budget requirements, and must compete with one another for businesses and residents (Peterson Reference Peterson1981; Hajnal and Trounstine Reference Hajnal and Trounstine2010). Such constraints have the potential to influence the type and extent of retrospective voting (Duch and Stevenson Reference Duch and Stevenson2008). When given information about politicians’ roles within the federal system, surveys and survey experiments indicate that voters do take such information into account when assessing those subnational politicians (Arceneaux Reference Arceneaux2006; Malhotra and Kuo Reference Malhotra and Kuo2008).
Nonetheless, there is considerable evidence from state-level voting behavior reinforcing the centrality of the economy in subnational vote decisions. For instance, while disagreeing on other questions, Stein (Reference Stein1990), Atkeson and Partin (Reference Atkeson and Partin1995), Carsey and Wright (Reference Carsey and Wright1998), and Folke and Snyder (Reference Folke and Snyder2012) all find that gubernatorial voting is influenced by state-level economic conditions. Additionally, Ebeid and Rodden (Reference Ebeid and Rodden2006) demonstrate a relationship between the state economy and incumbent governors’ electoral performance, although it weakens in American states that are more dependent on economic sectors that are subject to external shocks such as farming or natural resources. In other words, state-level electorates appear to weigh the state economy more when it is plausibly influenced by the incumbent governor. Like Cohen and King (Reference Cohen and King2004), Wolfers (Reference Wolfers2007) finds that the key question is how the state economy is performing relative to the national economy. Yet, it also concludes that even oil shocks can influence gubernatorial support, suggesting that retrospective voting in state elections is based partly on conditions beyond governors’ control. In a similar vein, Rogers (Reference Rogers2016) finds that national conditions are far more predictive of state legislative outcomes than are state-level conditions, perhaps because media outlets cover national politics more extensively than state or local politics.
Thus at the state level, there is a sizeable literature on retrospective voting, virtually all of it on economic conditions. Yet, while the national-level research has focused on benchmarking across time (but see Kayser and Peress Reference Kayser and Peress2012), the state-level research emphasizes benchmarking against other jurisdictions at the same point in time. Whether voters respond to absolute changes in local conditions or to relative local conditions might well hinge on how economic conditions are presented by journalists.
City-Level Retrospective Voting
To be sure, there have been various studies of vote choice in big-city elections as well, many of which emphasize the role of ethnic and racial divisions or incumbent mayoral performance (e.g., Mollenkopf 1992; Kaufmann Reference Kaufmann2004; Stein, Ulbig and Post Reference Stein, Ulbig and Post2005; Hajnal Reference Hajnal2007; Hopkins and McCabe Reference Hopkins and McCabe2012; Hajnal and Trounstine Reference Hajnal and Trounstine2014). Yet, there is almost no research on retrospective voting in local or mayoral elections that considers more than a single city. One exception is Berry and Howell (Reference Berry and Howell2007), which demonstrates that North Carolina school board members’ re-elections were related to district test scores only when the issue was salient. Even in highly local elections, the results of Berry and Howell (Reference Berry and Howell2007) suggest the importance of the information environment in facilitating retrospective voting.
Still, we should not assume that the lessons of national-level retrospective voting translate straightforwardly to the local level: local elections can differ in critical ways from state and especially national elections (Oliver, Ha and Callen Reference Oliver, Ha and Callen2012). Moreover, US cities differ from one another in various ways that are likely to influence the potential for retrospective voting, from the issues that are most pressing to their political institutions and their media outlets. To ignore retrospective voting in big-city mayoral elections is to miss a valuable opportunity to understand the factors that facilitate retrospective voting.
In developing hypotheses about retrospective voting in big-city mayoral elections, one important question is about the real-world conditions which form the basis of voters’ retrospective judgments. As we saw above, economic performance is a primary source of retrospective voting in national and state elections. Given the centrality of local economic conditions in city politics (Peterson Reference Peterson1981; Stone Reference Stone1989), it is quite plausible that economic factors are paramount at the mayoral level as well. Also, if the state-level precedent holds, we might expect such evaluations to be relative to a national benchmark. Unemployment is but one measure of local conditions, and one that less well-off voters might be especially sensitive to. Unemployment is a metric that is widely covered by local journalists, widely understood by the public, and known to be influential in other elections.Footnote 3
To be sure, retrospective voting in mayoral elections might not be limited to economic conditions alone. Arnold and Carnes (Reference Arnold and Carnes2012) find that not just economic conditions but also crime rates shape citizens’ approval of New York City mayors. In many cities, criminal justice is a central political issue (e.g., Hopkins and McCabe Reference Hopkins and McCabe2012), as well as an issue on which cities have considerable autonomy (Gerber and Hopkins Reference Gerber and Hopkins2011).Footnote 4 One might hypothesize that crime rates will serve as a basis for retrospective voting in big cities.
From research in psychology, we know that when filtering through the vast quantities of available information, people pay particular attention to changes (e.g., Kahneman and Tversky Reference Kahneman and Tversky1979). That attentiveness to change in one’s environment provides one psychological mechanism which may underpin retrospective voting: people’s attention may well be drawn to recent changes in social conditions (Hopkins Reference Hopkins2009), from a spike in the crime rate to an improvement local job prospects. Consistent with this view, Healy and Lenz (Reference Healy and Lenz2014b) show that while voters intend to evaluate candidates on the economy over their term in office, they use recent economic performance as a heuristic.
Still, national politics commonly receive far more attention than subnational events, especially with the rise of cable television and the internet (e.g., Delli Carpini and Keeter Reference Delli Carpini and Keeter1996; Hindman Reference Hindman2009). Given that Americans’ sources of state and local news are often sources of national news as well (Pew Center for the People and the Press 2012), it is plausible that voters may use national-level frames and narratives to make sense of local events (e.g., Hopkins Reference Hopkins2010). That, in turn, provides an alternative mechanism for retrospective voting. In subnational politics, Americans may vote not by comparing conditions today to those in the past, but instead by considering what is cognitively accessible—information about how their state or city is faring relative to the nation as a whole.
The Moderating Role of Media Outlets
When asking about which conditions induce retrospective voting, we should also ask about the city-level factors that facilitate or impede it. We focus here on cross-city variation in the information environment. Individual-level analyses of vote choice frequently contend that when voting retrospectively, voters inquire not about their own personal finances but about the economic situation of the country as a whole (e.g., Kinder and Kiewiet Reference Kinder and Kiewiet1981). Such findings in turn imply an important role for information sources such as mass media outlets in enabling retrospective voting at the national level. Still, in recent decades, virtually every American voter has had access to national television news, making it hard to identify exogenous variation in Americans’ access to information through that medium.
By contrast, city elections provide an especially useful environment in which to examine the role of information environments. Cities vary markedly in their information environments, with some large cities being home to their own local television stations and newspapers while other, similarly sized cities are in media markets dominated by other cities. For example, some cities are the center of a designated market area (DMA) and thus home to local TV news programs while others are not. Prior research has demonstrated that such differences have important consequences for the media voters are likely to have access to—and thus for their knowledge about their representatives in Congress and state politics in general (Carpini, Keeter and Kennamer Reference Carpini, Keeter and Kennamer1994; Arnold Reference Arnold2004).Footnote 5 At the city level, we might expect parallel effects of media availability (see also Zukin and Snyder Reference Zukin and Snyder1984; Shaker Reference Shaker2014). Those cities which are the center of a DMA or else those with their own newspaper are likely to have more news content devoted to their politics and government.
One possible mechanism through which the media might act is informational, by providing basic facts about local conditions that are not otherwise visible to individuals. While much smaller than the United States, cities are still large social aggregates with hundreds of thousands of people, making it difficult for voters to get an accurate image of events from their own experiences. But there is a another potential mechanism through which media coverage might work. As Lane (Reference Lane1962) details, information gleaned in day-to-day life is often “morselized” and not integrated with one’s political views. Mutz (Reference Mutz1994) shows, however, that media coverage can politicize information, providing it with political frames and so making it relevant to political judgments. In this view, media coverage not only provides information but also politicizes it. Given the prominence of both national and local economic coverage, local news outlets might make national–local comparisons an especially natural criterion by which to evaluate incumbent mayors. In the Online Appendix, we use a content analysis of big-city newspapers to show that this expectation is reasonable. Across more than 7000 articles from various newspapers, we see that the local economy is a consistent theme of coverage.
Data Collection and Sources
To examine retrospective voting in big-city mayoral elections, we compile data from a wide range of sources. The elections of interest are general elections for mayors which took place in any American city larger than 133,000 people between 1990 and 2011.Footnote 6 We chose this threshold both because it roughly approximates the lower bound of big cities and because data on election returns becomes notably more sparse just below it. Of course, for some large cities such as Baltimore, Maryland, the winner of one party’s primary is very likely to become mayor, meaning that the most competitive election is the primary. Despite their prominence, such cities are in a decided minority.
To build our data set, we began with the data on city elections described in Gerber and Hopkins (Reference Gerber and Hopkins2011). We then sought information on when each election occurred, the votes received by the top four candidates, the candidates’ party affiliations, their racial and ethnic backgrounds, and whether any of the candidates was an incumbent. For each election, we also recorded whether the election resulted in a change in the party overseeing city hall. In addition, we gathered data on incumbent retirements, including the stated reasons for the retirement. To compile this data, we drew on many sources, including state and local election commissions, official city websites, the data set made available in Ferreira and Gyourko (Reference Ferreira and Gyourko2009), and archived newspaper articles available through LexisNexis or online. Figure 1 presents a map of the cities included in our analyses, distinguishing between cities based on whether they are the center of their DMA (e.g., the largest city within it, denoted by stars) or not (open circles).

Fig. 1 Cities included in the analyses Note: This map shows cities included in our data set. Included cities that are the largest in their media markets are depicted with stars, while open circles indicate those which are not. Honolulu is not shown but is analyzed in this paper.
Alongside these election-specific data, we compiled demographic, crime, institutional, and economic measures at the city, metropolitan statistical area (MSA), state, and national levels, as detailed in the Online Appendix. Of the 1264 elections in our universe, we could not recover the incumbent’s winning margin in 611 (48 percent), typically because no incumbent stood for election. Our focus on competitive elections removes another 154 (12 percent), although as we show below, the results are robust to the inclusion of landslides. We remove another 158 elections due to other missing data (although here, too, the results are not sensitive to this choice). Our final data set consists of 341 elections in 115 different cities between 1990 and 2011.Footnote 7 Tables 4–6 in the Online Appendix show descriptive statistics for the full data set, the data set of all eligible elections (including landslides), and the final data set excluding landslides.
Independent Variables
In theory, there are a wide variety of local conditions and events that might generate retrospective voting. Some—say, economic conditions or traffic—are potential consequences of government policy-making. Others, including how local sports teams perform, are more clearly outside mayoral control. Here, we focus on conditions that are common to many municipalities, including unemployment, income growth, property values, crime, investigations by prosecutors, and victories by professional football and baseball teams.Footnote 8
In prior state-level research, the key predictor is frequently state economic performance relative to national economic performance: the nation serves as a benchmark against which to compare subnational outcomes. As a result, our baseline models include measures of both local and national conditions. Specifically, to measure the impact of local unemployment, we include the US unemployment rate alongside a measure of the difference between the national unemployment rate and the city’s unemployment rate, both measured in the month of the election. As that difference goes up, national unemployment grows relative to city unemployment, and the city’s economy is thriving relative to the nation’s. This variable’s mean is −0.39 with a SD of 2.45, indicating slightly higher baseline unemployment in our cities than in the country as a whole.
There is substantially more variation in unemployment across cities than in the nation over time, so the Pearson’s correlation between this difference and raw city-level unemployment is 0.86. That high correlation means that in practice, it is difficult to distinguish relative comparisons from city-level conditions—and as we detail in the Online Appendix, our results prove robust to either measure. The correlations are markedly lower for two other measures we consider: the difference between national- and city-level personal income and the difference between national and MSA-level property values.
We also consider alternative influences on city-level retrospective voting, both as potential confounders and as explanations in their own right. To measure the violent crime rate, we include both the national violent crime rate as well as the difference between the national and local violent crime rates. Similarly, we measure both national housing prices and the difference between that index and MSA-level home prices.Footnote 9 We do the same for per capita income. For World Series and Super Bowl victories, we include an indicator variable for any such victories within one month of the election. Finally, we combed through newspaper archives using LexisNexis and Google News to identify mayors who were under federal investigation at the time of each election.Footnote 10
When analyzing observational data, it is often difficult to identify ex ante a single statistical model that is the correct model specification. The most credible empirical estimates are thus those which reduce bias by conditioning on likely confounders, avoid including post-treatment variables, and are not sensitive to plausible changes in model specification (Ho et al. Reference Ho, Imai, King and Stuart2007). Here, we follow those three basic tenets. To make the “all else equal” assumption underpinning any causal interpretation of these models more plausible, some include a series of other independent variables that have been employed in recent work (e.g., Hajnal and Trounstine Reference Hajnal and Trounstine2010; de Benedictis-Kessner and Warshaw Reference de Benedictis-Kessner and Warshaw2016). Some are demographic, such as the logged population as well as the share of the population that is Hispanic or Black. Others measure socioeconomic status and resources, including the percentage of the city with a Bachelor’s degree, the median household income in 1990, and the median home value in 1990. We also condition on several explicitly political measures, such as whether the city has a Mayor/Council structure and its Democratic vote share in 1988, the presidential year prior to our earliest observations.Footnote 11 Our baseline models include a measure of national unemployment in the 12 months prior to mayoral election in question, even when those 12 months include more than one calendar year. This fact allows us to also include year fixed effects in select models, although we also present robustness checks in which we omit these fixed effects.
Results: Economic Voting in Mayoral Elections
Our outcome of interest is the share of the total votes won by the incumbent in the general election (see also Trounstine Reference Trounstine2011). Running from an empirical minimum of 0.20 to a maximum of 0.80, the variable’s mean is 0.59 with a SD of 0.13. While the average incumbent seeking re-election wins handily, there is substantial variation in incumbent performance at the ballot box.
Accordingly, we begin in Table 9 in the Online Appendix with a very basic statistical model which includes only our key measures: the unemployment difference between the city and the nation and the national unemployment rate. Doing so, we uncover a coefficient of 0.0055 (SE=0.0028, p=0.06). As the national unemployment rate grows relative to the city’s, the incumbent mayor fares better. This relationship is slightly stronger when including a measure of the logged population and city fixed effects, as the second column shows (β=0.0071, SE=0.0030). It grows stronger still when also conditioning on other city-level control variables, such as the median household income or the city’s percent Black, as the third column demonstrates (β=0.0010, SE=0.004).Footnote 12 African Americans and Hispanics tend to support Democratic candidates at higher rates than non-Hispanic white voters, so it is notable that the key coefficient grows very slightly—to 0.0011 (SE=0.004)—when we modify the baseline model to include interactions between having a Democratic incumbent and the city’s percent Black and percent Hispanic.
In our view, the third model reflects an appropriate balance, as it conditions on a variety of potentially confounding, pre-treatment variables without including any that are likely to be post-treatment. We thus present it in the left-most column of Table 1.Footnote 13 For every 1 percentage point increase in national unemployment relative to local unemployment, incumbent support should increase by 0.010, meaning 1.0 percentage points. That is a sizeable effect, one we illustrate in Figure 2. The figure plots the predicted level of incumbent support (solid line) and associated 95 percent confidence intervals (dashed lines) as the national–local unemployment difference changes. Using gray diamonds, it depicts the actual elections in the data set, and hash marks on the x-axis convey the distribution of the independent variable.
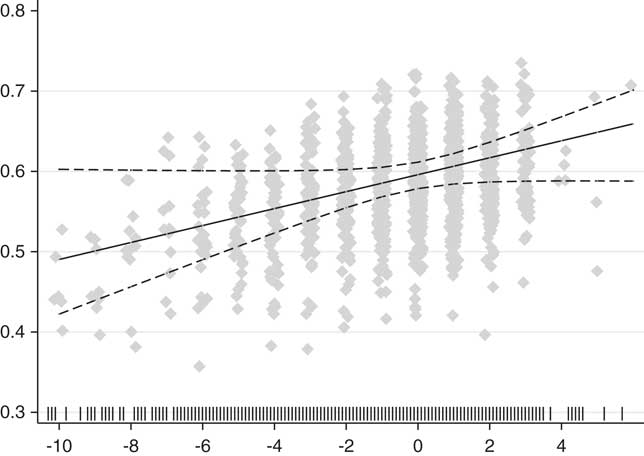
Fig. 2 This figure shows the marginal effect of the difference between national and local unemployment, with gray diamonds representing the observed data points Note: The vertical lines at the bottom illustrate the distribution of the national–city unemployment difference.
Table 1 Regression Models Predicting the Incumbent Vote Share in Big-City Elections, 1990–2011

Note: Standard errors appear in parentheses.
All models include standard errors clustered at the city level.
MSA=metropolitan statistical area.
*p<0.10, **p<0.05, ***p<0.01.
To make these results substantively meaningful, consider elections being held in the same city under two different scenarios. In the first scenario, local and national unemployment are equal. But in the second, the local economy is outperforming the national economy, and local unemployment is 2.45 percentage points lower than the national benchmark. These two scenarios represent a difference of 1 SD—and all else equal, the scenario with lower city-level unemployment should lead to an incumbent advantage of 2.45 percentage points more on average. In our data set, there are 13 incumbents whose margin of victory was less than 2.45 percentage points. There is thus strong evidence of retrospective voting based on local unemployment, a visible and broadly meaningful economic indicator. We probe the robustness of this finding in the Online Appendix.
Certainly, unemployment is not the only measure of economic performance. In fact, forecasting models of presidential elections commonly employ measures of growth rather than unemployment (Bartels and Zaller Reference Bartels and Zaller2001). Accordingly, the next two columns in Table 1 consider different economic indicators, indicators that typically correlate with economic conditions at higher ends of the income distribution than does unemployment. The first is the city’s personal income per capita, which refers to total earnings from wages and investment. The second is a housing price index, a variable emphasized by Fischel’s (Reference Fischel2001) “homevoter hypothesis.” It measures price changes in resold residential properties. For both variables, the difference between national and local performance is statistically indistinguishable from 0 and substantively small. For example, the SD for the difference in annual income is 0.094, so a change of 1 SD is associated with a change of ~0.13 percentage points in incumbent vote share. For housing prices, the evidence is instead suggestive that national conditions themselves correlate with incumbent vote share, albeit not quite at statistically significant levels. Separate models indicate null results when we measure local conditions without considering the deviation from the national benchmark for these alternative economic metrics.
Criminal justice is a central issue in some big cities’ politics, and one on which mayors have substantial discretion (Gerber and Hopkins Reference Gerber and Hopkins2011; Arnold and Carnes Reference Arnold and Carnes2012; Hopkins and McCabe Reference Hopkins and McCabe2012). So our next models include two types of crime, measured against a national baseline: violent crime and homicide. Given local TV news coverage, there is reason to think that homicides in particular might attract attention, a fact which explains why we consider homicide rates separately.Footnote 14 The means are negative for the difference in violent crime and in homicide, at −0.41 and −0.05, respectively, indicating higher levels of both types of crime in these large cities as compared with the United States overall. As Table 1 illustrates, the coefficients for both variables are negative but substantively insignificant and statistically indistinguishable from 0. The best conclusion is that across large US cities, there is not strong evidence that incumbent mayors suffer for relatively high violent crime or homicide rates.
In the final model, we consider indicator variables for cities that won the World Series or Super Bowl within a month of the election, as well as for mayors under federal investigation. The first two of these outcomes could produce significant pro-incumbent feeling (Healy, Malhotra and Mo Reference Healy and Malhotra2010; Miller Reference Miller2013), even though they are outcomes that incumbent mayors are unlikely to influence. On average, only 3.1 percent of our elections took place with such a championship in the recent past. In our baseline specification, the coefficient associated with a World Series championship is almost exactly 0. However, the coefficient associated with a Super Bowl victory is both substantively and statistically significant, at 14.0 percentage points (SE=6.0 percentage points). Given that we are talking about two elections that took place in the wake of a Super Bowl victory, we advise caution in interpreting that particular result.
The measure of federal- and state-level investigations is a coarse attempt to capture the issue of corruption that confronts many city governments. Overall, 13 percent of our elections involve incumbents being investigated. But as the careers of former mayors such as Washington, DC’s Marion Barry and Providence, Rhode Island’s Buddy Cianci suggest, voters’ support can sometimes withstand criminal charges. Here, we find a large correlation in the expected direction, with a coefficient of −0.058 and a SE of 0.028. An official investigation into a mayor should reduce his vote share by 5.8 percentage points on average.
The models above indicate that mayors in cities with lower unemployment relative to other cities enjoy increased support come election day. But in presidential politics, what matters is the change leading up to the election (Healy and Lenz Reference Healy and Lenz2014b), suggesting that national voters benchmark today’s outcomes against those of the recent past. Might the same pattern hold in cities? As detailed in the Online Appendix, we find that it does not: there is little strong or consistent evidence that city voters are benchmarking based on year-to-year changes in local conditions.
Media Availability as Moderator
Retrospective voting in America’s large cities appears to be primarily economic in nature. But US cities vary markedly in their political and governing institutions (Marschall, Ruhil and Shah Reference Marschall, Ruhil and Shah2010)—and if the experience of other countries prove relevant, those institutions might influence city-level retrospective voting (Duch and Stevenson Reference Duch and Stevenson2008; but see Tausanovitch and Warshaw Reference Tausanovitch and Warshaw2014). At the same time, some cities have robust sources of information about local conditions, while others must compete with larger neighbors for attention. Do such differences shape retrospective voting, and if so, which ones?
To answer that question, we subdivide our data set based on a variety of binary moderating variables, and present the key estimates for each subset in Table 2 and Table 10 in the Online Appendix. Dividing the data based on the moderator is an approach that strictly dominates the use of multiplicative interaction terms in terms of reducing bias and model sensitivity, as it enables not only the coefficient of interest but all coefficients to vary across the two samples (see also Hainmueller, Mummolo and Xu Reference Hainmueller, Mummolo and Xu2016). Specifically, the tables’ first columns present the share of observations that have the feature of interest. In the second and third columns, they present the estimated effect without and then with the feature of interest. For these estimates, we use the baseline model from above, but remove a few variables to avoid over-fitting given the small sample sizes in some cases.Footnote 15 The fourth column estimates the difference between these two effects, while the fifth columns indicate the p-value associated with that difference calculated via Wald Tests.
Table 2 Difference in Retrospective Voting by Local Media Availability

Note: This table compares the coefficient estimates on our key independent variable (national minus city unemployment) across subsets of our data. The first column indicates the share of observations with the media outlet in question, while columns two and three show the estimated coefficient given its absence or presence, respectively. Column 4 shows the absolute value of the difference between those coefficients, and column 5 shows the p-value associated with that difference.
*p<0.10, **p<0.05, ***p<0.01.
Broadly, the Online Appendix tables make it clear that electoral and governmental institutions do not have strong or predictable moderating effects in mayoral elections.Footnote 16 The overall impression is of institutional factors playing a limited role in moderating the effect of retrospective voting (see also Tausanovitch and Warshaw Reference Tausanovitch and Warshaw2014; de Benedictis-Kessner and Warshaw Reference de Benedictis-Kessner and Warshaw2016).
Yet, alongside differences in their electoral and governmental institutions, cities also differ markedly in their media environments, differences which are likely to be central in shaping voters’ knowledge of and interest in city-level politics (e.g., Zukin and Snyder Reference Zukin and Snyder1984; Delli Carpini, Keeter and Kennamer Reference Delli Carpini, Keeter and Kennamer1994). The results in Table 2 bear out this hypothesis. They show that for the 87 percent of observations from cities with their own newspaper,Footnote 17 the unemployment–incumbent voting coefficient is 0.016, which is significantly larger than that in other cities. Moreover, for the 49 percent of observations in cities which are the center of their DMA,Footnote 18 the coefficient is 0.017, as compared with just 0.003 elsewhere. For every 1 percentage point improvement in the local unemployment rate relative to the national rate, incumbents should win 1.7 percentage points more of the two-candidate vote share in cities with their own TV stations. That same figure drops to 0.3 percentage points elsewhere. This differential effect also holds when augmenting the baseline models to include any of the measures of institutions outlined above, indicating that it is not simply masking institutional differences. Many more cities have their own newspapers than have their own television stations. Yet in both cases, there is substantively meaningful and statistically significant evidence that media markets enable retrospective voting. In fact, for the 13 percent of elections in cities without newspapers and the 51 percent without their own TV stations, the estimated effect of local unemployment is essentially 0. Where there is no easy way to learn about city-level conditions, there is also no evidence of retrospective voting based on local unemployment.
The result here that is novel, theoretically relevant, and broadly applicable across cities is that for local unemployment, benchmarked nationally. Accordingly, we probe the robustness of that result in a variety of ways in the Online Appendix. There, we show that our core result is not driven by selective decisions to seek re-election. We also consider a wide variety of alternative model specifications, including those which relax the linearity assumption inherent in our basic model. We further iteratively drop cities to identify whether our estimates are driven by outliers. Our core result is highly robust to these and other changes in estimation strategy.
Discussion and Conclusion
There are a wide range of local conditions that could plausibly generate retrospective voting in mayoral elections, from crime rates and property values to economic performance and even World Series titles. Yet like presidents and governors, mayors appear to be evaluated primarily based on local economic performance, with some indication that investigations reduce support. Our research does not rule out that snowstorms, traffic, or crime might cost specific mayors votes—or even their jobs. But it does suggest that across the large US cities analyzed here, retrospective voting is primarily economic in nature. It also suggests that urban voters are comparing local conditions to those in the US generally, not to their own city’s past performance.
Earlier generations of scholarship cast doubt on the idea that pocketbook voting was the primary mechanism of retrospective, economic voting (e.g., Kinder and Kiewiet Reference Kinder and Kiewiet1981). But in national politics, sociotropic alternatives are difficult to test empirically, in part because information about basic conditions is so widely available that levels of exposure are primarily the result of people’s choices. At the city level, they are not. Some cities are home to newspapers and local television stations, while others do without one or both. As a result, there is plausibly exogenous variation in residents’ exposure to information about local government, politics, and conditions.
Berry and Howell (Reference Berry and Howell2007) find that retrospective voting in school board elections hinges on the salience of education as an issue. In a similar vein, we show here that economic retrospective voting in mayoral elections depends on local media outlets. In cities with their own TV stations and newspapers, there is a robust relationship between city-level unemployment and the performance of the incumbent mayor. As the city performs better relative to the nation or in absolute terms, support for the incumbent mayor rises. In cities without local media sources, the relationship disappears. It is plausible that urban issues are tangible and immediate in a way that state and national issues are not; if any type of government in our federal system could generate significant voting based on personal experience, it should be the local level, making this a difficult test for sociotropic voting. Even so, the availability of locally oriented media is crucial in enabling retrospective voting. That might well be because of the information such outlets provide about city-level conditions. But that might also be because the media have an unparalleled capacity to politicize information and to make it consequential for vote choice (e.g., Mutz Reference Mutz1994).
This pattern of findings should encourage additional research on several tracks. For one thing, additional research on individual voters could lead to a better understanding of how voters acquire information about local conditions, and what specific benchmarks they use in evaluating those conditions. Individual-level studies could also illuminate who within a city is more or less likely to vote retrospectively. Although we do not find consistent evidence of overall sociotropic voting on crime, it is plausible that specific groups of voters—say, those in high-crime neighborhoods—are more influenced. At the same time, studies of local media could identify the specific content that enables voters to benchmark local economic conditions. Given the prominence of racial divisions in prior accounts of mayoral voting, future research might consider the role of group- or neighborhood-specific conditions in shaping voting as well (see also Mutz and Mondak Reference Mutz and Mondak1997). Finally, scholars might investigate whether racially charged elections reduce retrospective voting, as inter-group tensions become a primary voting criterion.
In the decades surrounding the turn of the 20th century, many cities hosted ongoing struggles over local political and electoral institutions (e.g., Trounstine Reference Trounstine2009). Yet in contrast to the findings for media outlets, we do not find strong or consistent evidence that electoral and political institutions moderate the extent of retrospective voting. Mayor–council systems, on-cycle elections, partisan nominating procedures, term limits—none of these institutions seem related to the strength of cities’ retrospective voting. It does appear that cities with ward-based elections have higher levels of retrospective voting. However, we suspect that this is due to the nature of the cities which typically have ward-based elections and we encourage future research into that correlation.
This pattern of differing effects depending on the local media environment takes on special importance given the recent transformation of the American media market. As of 1990, 70 percent of Americans were regular viewers of local television news, the same figure that reported regularly reading print newspapers (Pew Center for the People and the Press 2012). By 2012, the audience for local television news had declined to around 50 percent of the population, and the share of newspaper readers was down sharply as well. In fact, local newspapers including the Rocky Mountain News and the Seattle Post-Intelligencer have gone out of print in recent years, and in an increasingly competitive media environment, others are likely to follow. Whether because of the information they provide or the ways in which they frame that information, local news outlets are a critical factor in enabling local political accountability. Their declining audiences are likely to have consequences for local retrospective voting as well.


