


Introduction
A mass gathering, defined as an event that draws more than 1,000 persons to a specific location, presents unique challenges for medical care providers and event planners.Reference DeLorenzo 1 Injuries and medical emergencies can be expected during any large gathering, but accurately predicting the number of patient encounters and transports, and hence, the amount and type of medical resources that will be necessary, can be problematic.Reference Martin-Gill, Brady and Barlotta 2 , Reference Milsten, Maguire, Bissell and Seaman 3 During large public events, health care providers face a wide range of patient complaints, ranging from simple wounds to cardiac arrest. These events have the potential to consume a wide array of medical resources depending on a number of factors, including crowd size, the availability of alcohol, and weather.Reference Hartman, Williamson and Sojka 4 Encounters with critically-ill individuals at mass gatherings are unusual.Reference Varon, Fromm, Chanin, Filbin and Vutpakdi 5 Nevertheless, the proper resources need to be available to meet a wide range of medical conditions and to respond to an unanticipated mass-casualty incident.Reference Hartman, Williamson and Sojka 4
Accurate prediction of the number of medical encounters likely to occur during an event translates into allocation of appropriate medical staffing and resources. Many variables deserve consideration, including the number of individuals expected to attend, the availability of alcohol, the type and duration of the event, local environmental conditions, and potential public health threats.Reference Milsten, Maguire, Bissell and Seaman 3 , Reference Moore, Williamson and Sochor 6 In addition to the likelihood of common medical complaints, mass gatherings present the possibility of catastrophic events. For example, the collapse of a spectator grandstand at a concert would result in far more patient encounters and transports than predicted.
When estimating the medical resources that will be needed for a large event, many emergency care planners rely on their experience with similar events in the past and design their plans so as to comply with local ordinances.Reference Hartman, Williamson and Sojka 4 , Reference Meites and Brown 7 The many descriptive reports published following mass gatherings document patient presentation rates ranging from 0.14 to 90 per 1,000 spectators.Reference DeLorenzo 1 This wide range indicates the need to assess the models that are used to predict the size of crowds and the resources that will be needed to meet their medical requirements.
Among the most recent prediction models cited in the literature are those developed by ArbonReference Arbon, Bridgewater and Smith 8 and Hartman.Reference Hartman, Williamson and Sojka 4 Arbon's approach is based on regression modeling, and the Hartman approach uses certain event characteristics to stratify events into three severity classes. The objective of this study is to compare the accuracy of these two models in predicting the numbers of patients evaluated and transported during the 2011 and 2012 Baltimore Grand Prix (BGP, Maryland USA), an IndyCar Series and American Le Mans Series race held on a city street circuit. While other models have been discussed, many of these have been developed for specific events or locations,Reference Bowdish, Cordell, Bock and Vukov 9 - Reference Bock, Cordell and Hawk 13 or only predict the number of patient encounters without forecasting transports.Reference Bowdish, Cordell, Bock and Vukov 9 The two models were chosen because they were developed to predict both the number of patient encounters and patient transports, in addition to being generalizable to multiple types of events. It was hypothesized that the Arbon method, which utilizes regression model-derived equations to estimate, would be more accurate than the Hartman model, which categorizes events into only three discreet severity types.
Methods
Study Design
This retrospective observational study was based on collected data from patient encounters and transports during the 2011 and 2012 BGP. Data were collected using HC Standard (Global Emergency Resources, Augusta, Georgia USA), an electronic patient tracking system. The deidentified data were analyzed in the aggregate, with a protocol deemed nonhuman subjects research by the Institutional Review Board of the University of Maryland, Baltimore.
Study Setting
All patients who sought evaluation at one of the event-provided first aid stations by a medical care provider during the BGP were included in this study. During the events, medical care providers were stationed in first aid tents for the public, a medical tent for race crews and drivers, or were members of roving Emergency Medical Services (EMS) teams that moved through the venue. Medical staffing was provided as a cooperative effort between the Baltimore City Fire Department and the Department of Emergency Medicine of the University of Maryland School of Medicine, with The Johns Hopkins University School of Medicine's Department of Emergency Medicine also cooperating in 2011. Faculty emergency physicians from these EDs, along with emergency medicine residents from their respective training programs, were on site at the first aid tents and the drivers’ medical tent. Nurses and prehospital care providers were also present at all treatment locations.
During the 2011 BGP, the first aid tents were staffed with one faculty emergency physician, one resident emergency physician, two ED nurses, and two Advanced Life Support (ALS) providers. In 2012, the first aid tents were staffed with one faculty emergency physician, one emergency medicine resident, one nurse practitioner, and two ALS providers. In both 2011 and 2012, the drivers’ medical tent was staffed with one emergency physician, one emergency medicine resident, two ED nurses, and two ALS providers.
The locations of the first aid tents and the drivers’ medical tent are depicted in Figure 1. After analysis of medical tent utilization at the 2011 BGP, the three first aid tents were consolidated into two tents for the 2012 BGP. The tents were stocked with basic first aid supplies, intravenous fluids, and a limited supply of medications. The medical care providers at the drivers’ medical tent had the capability to perform basic musculoskeletal and chest radiography.
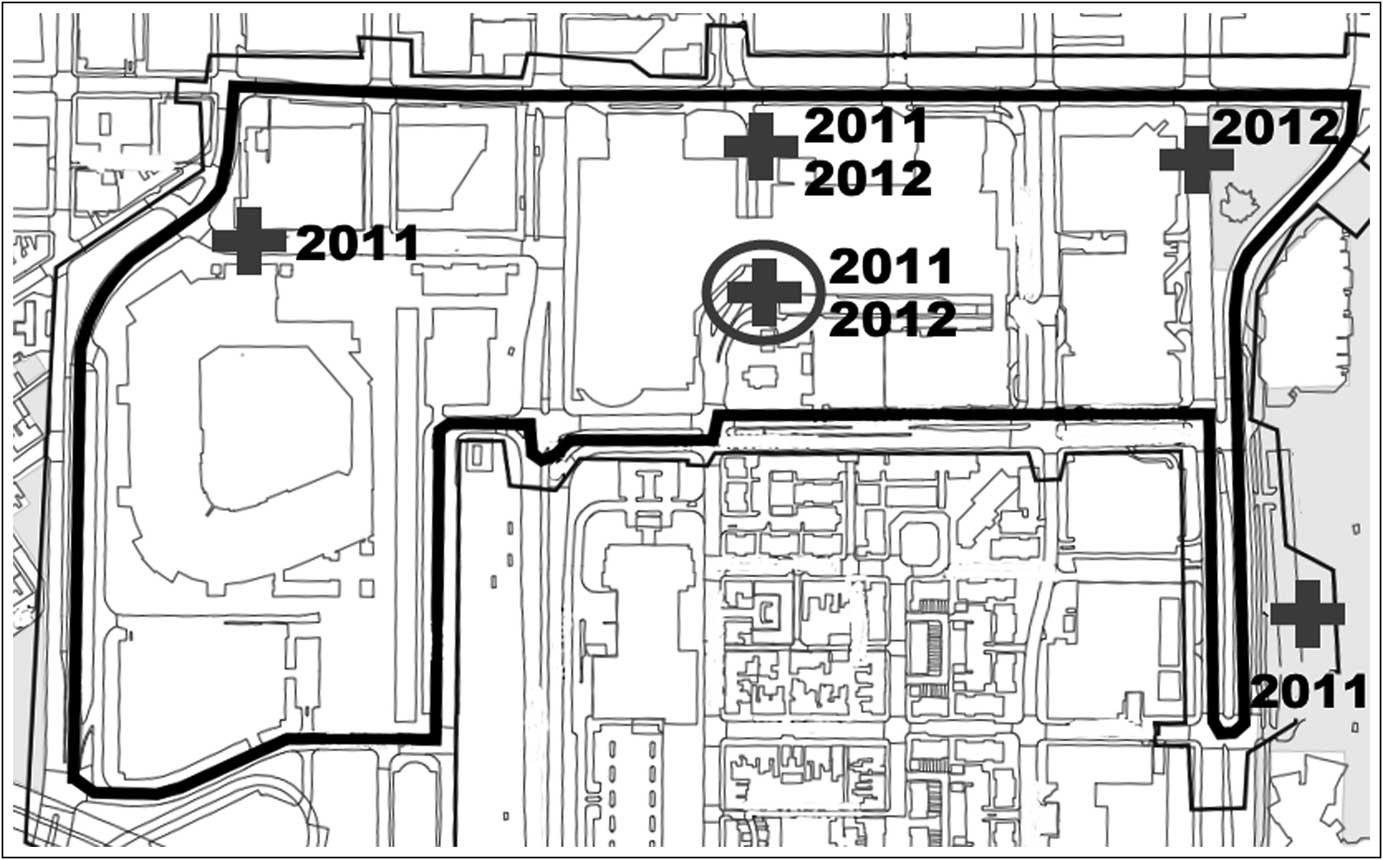
Figure 1 Map of the Baltimore Grand Prix course. The thick line represents the race course; the thin line is the “pay line,” within which only ticketed spectators were allowed. Crosses represent the locations of the first aid tents. The cross within a circle marks the location of the drivers’ medical tent. The years next to the tent markers denote when the facilities were at their respective locations.
Study Protocol
The electronic patient tracking system was used to document patient demographics, treatment administered, and patient disposition. The system allowed incident commanders and area hospitals to maintain real-time situational awareness of patients being evaluated and treated at the BGP medical tents. Patient encounters were defined as evaluations requiring a licensed provider based on assessments by triage nurses at the first aid stations. A spectator requesting a bandage for a blister, for example, was not considered an encounter unless the triage nurse specifically requested a physician evaluation. The decision to involve a physician was based on the judgment of the individual triage nurse. For the purposes of this study, all licensed providers were licensed by the state of Maryland to practice medicine and were on the medical staff of at least one ED in Baltimore City.
All evaluated and transported patients were assigned triage tags with unique patient identifiers by EMS personnel. Nurses also maintained a separate hand-written log of all encounters. State EMS technical specialists were on site to monitor the electronic patient tracking system in real-time, comparing electronic data to hand-written triage notes and patient logs, verifying the validity of the information in the database utilized in this study. These technical specialists contacted providers at the conclusion of patient encounters if information was not completely entered into the electronic patient tracking system.
This study included all patients who were evaluated by a licensed provider at the BGP and transported by on-site EMS providers to surrounding EDs. Patients who were deemed by a triage nurse to have a “minor” complaint, not requiring further evaluation, were not included. Patients who transported themselves from the event to an ED, without contacting event staff or calling 9-1-1, were also not included. The Hartman model had similar inclusion and exclusion criteria, as it separately predicts “minor” encounters from patient presentations requiring a provider evaluation.Reference Hartman, Williamson and Sojka 4 The Arbon model, however, did not exclude “minor” patients.Reference Arbon, Bridgewater and Smith 8
After the events, the actual numbers of patients treated and transported were compared with estimates generated by the Arbon prediction model and the Hartman event classification model (Table 1).Reference Stillman, Hale and Burnett 14 , 15 Attendance estimates were obtained from the BGP event managers, based on event ticket sales, and compared to crowd estimates from the Baltimore City Police Department.
Table 1 Crowd estimates, weather data, and actual vs predicted patient encounters and transports for the 2011 and 2012 Baltimore Grand Prix. Attendance estimates provided by the Baltimore City Police Department and Grand Prix event managers. Historical weather data were obtained from the Old Farmer's Almanac.Reference Stillman, Hale and Burnett 14 Heat index was calculated using an internet-based calculator from the National Weather Service. 15
Abbreviations: att, attendance; BGP, Baltimore Grand Prix; encount, encounters; trans, transports.
The Arbon prediction technique is based on a regression model that incorporates a variety of factors: whether the event is seated, bounded by a barrier, outdoor, or sports related; the predicted crowd size; and environmental features, such as humidity and time of day.Reference Arbon, Bridgewater and Smith 8 Those variables are used to predict the number of patient encounters in the following equation:
 $$no{ & {\rm b0}\,+\,{\rm (b1*C1)}\,+\,{\rm (b2*\asteriskC2)}\,+\,{\rm (b3*C3)}\,+\,{\rm (b4*C4)}\,+\,\cr &{\rm (b5*C5)}\,+\,{\rm (b6*C6)}\,+\, {\rm (b7*C7)}\,+\,{\rm (b8*C8)}\,+\,{\rm (b9*C9)} \cr} \eqno\rm$$
The values for each parameter are available in the Arbon paper,Reference Arbon, Bridgewater and Smith 8 with respective coefficients determined by recognizing the bounded sporting event as having mobile spectators at an outdoor venue which occurred strictly during daytime hours. The predictions for the BGP are shown in Table 1. Similarly, the predicted number of patient transports was calculated using the following equation:
 $${\rm b0}\,+\,{\rm (b1*C1)}\,+\,{\rm (b2*C2)}\,+\,{\rm (b3*C3)}\eqno\rm$$
Values for each parameter are again available in the Arbon paper,Reference Arbon, Bridgewater and Smith 8 and actual numbers from the BGP are presented in Table 1.
The Hartman method uses a scoring system to categorize an event as minor, intermediate, or major.Reference Hartman, Williamson and Sojka 4 Variables used in this model include heat index, the presence of alcohol, crowd age, crowd attendance, and crowd intention. Weather data for the 2011 and 2012 BGP are shown in Table 1. The least crowded and lowest temperature day for either year occurred on September 2, 2011. With a heat index <90°F (one point), a crowd attendance between 1,000 and 15,000 (one point), a significant presence of ethanol (two points), a crowd of mixed ages (one point), and an animated crowd intention (two points), this day scored seven points in the Hartman model. Events with a score greater than five are classified as “major events,” with an estimated average of 71 patient evaluations and 5.5 patient transports.Reference Hartman, Williamson and Sojka 4 All of the other days of the BGP 2011 and 2012 had higher temperatures and higher crowd estimates, so every day counted as a “major” event in the Hartman system.
Measures
The actual number of patient encounters and transports during the 2011 and 2012 BGP were compared to the predicted numbers derived from the Arbon and Hartman models. The ratios of the number of patient evaluations to the total number in attendance for all three days of each of the BGP in 2011 and 2012 were calculated. Additionally, ratios for the number of transportations to the total number in attendance were calculated.
Results
Approximately 130,000 spectators attended the 2011 BGP. 16 As noted in Table 1, the daily number of patient encounters ranged from 19 to 57, and the number of transports ranged from two to nine. Over the 3-day period, 128 people requested medical assistance. The 2012 BGP had approximately 131,000 spectators in attendance, with 88 patient encounters over the event period. The number of encounters on each day of the 2012 BGP ranged from 19 to 44, and the number of transports ranged from four to nine (Table 1). All patients were evaluated by emergency physicians staffing the first aid tents and the drivers’ medical tent. The physician decided whether to treat and release the patient or to have the patient transported to a local ED. Fifteen patients were transported over from the scene during the 2011 BGP and 18 during the 2012 BGP.
The Arbon model underpredicted the number of patient transports for each day of the BGP and overpredicted the number of patient encounters for each day, except one in 2011. The Hartman model overpredicted the number of patient encounters for all days of the BGP in both 2011 and 2012, while it variably over and underpredicted the number of patient transports per day.
Figure 2 demonstrates the ratios of predicted and actual patient encounters to total attendance for each studied year of the BGP. In 2011, the actual number of patient encounters to total attendance ratio was 9.85 x 10⁻⁴ encounters per attendee, decreasing to 6.72 x 10⁻⁴ encounters per attendee in 2012. Figure 3 similarly illustrates the ratios of transports to total attendance. In 2011, the actual transports to total attendance ratio was 1.15 x 10⁻⁴ transports per attendee, increasing to 1.37 x 10⁻⁴ transports per attendee in 2012.
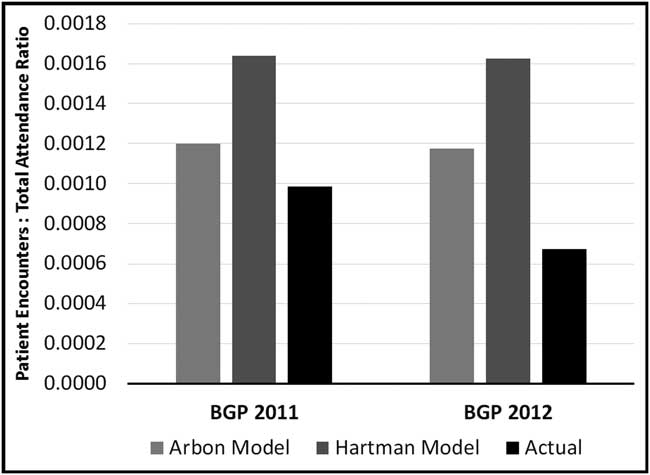
Figure 2 Ratios of predicted and actual number of patient encounters to total attendance. Abbreviation: BGP, Baltimore Grand Prix.
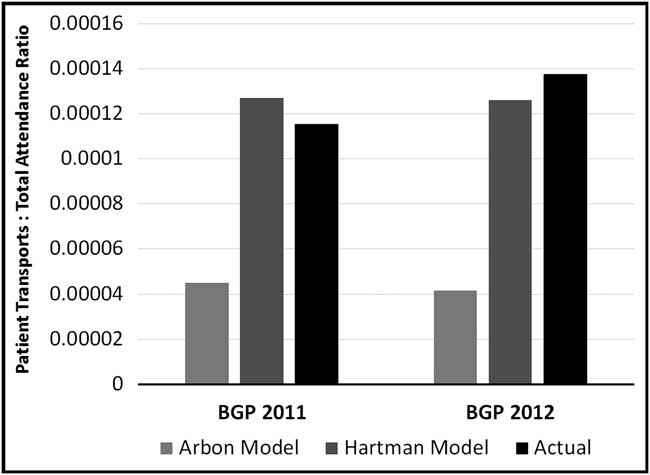
Figure 3 Ratios of predicted and actual numbers of patient transports to total attendance. Abbreviation: BGP, Baltimore Grand Prix.
Discussion
These findings demonstrate the complexity inherent in predicting the number of patient encounters and transports during mass-gathering events. Each event has unique characteristics that affect decisions regarding the medical resources deemed to be necessary. The characteristics of some events are self-evident; for example, football games tend to draw crowds that require more medical attention than do events with less-animated spectators.Reference Locoh-Donou, Guofen and Welcher 17 But mass gatherings also have unknown factors: the potential for a terrorist attack calls for medical resources beyond what is predicted by a model, because of the potential increase in the number of encounters and transports.Reference Kade, Brinsfield and Serino 18 Spectators at large events are also at risk for stampedes.Reference Madzimbamuto and Madamombe 19 , Reference Valesky, Silverberg and Gillett 20
Whereas the Hartman model uses ranges for the number of spectators, the Arbon method requires a specific number of estimated spectators, giving the Arbon model more granularity. Therefore, the number of encounters predicted by the Arbon model was different for each day of the BGP, and it tended to be more accurate than the Hartman model in these predictions. The parameters that are incorporated into the Arbon and Hartman methods are presented in Table 2 for comparison; only the estimated attendance is common to both models.
Table 2 Event Characteristics Used in Arbon and Hartman Models
athe only variable the two models have in common is estimated attendance.
The Hartman model is limited by the fact that it was developed in a single city from events covered by one medical team. It was derived from 55 events covered by a special events team based at a large university.Reference Hartman, Williamson and Sojka 4 Using a scoring system based on factors previously known to affect medical needs (Table 2), the Hartman model delineates events into three discrete categories. In developing this scoring system, Hartman et al found it possible to correctly stratify events as minor, intermediate, or major, with major events having the greatest number of evaluations and transports. The Arbon model is based on events in which one agency was the lead medical care provider. Using data from 201 events, Arbon et al developed regression models based on several environmental and event factors (Table 2) to predict the rates of patient presentations and transports.Reference Arbon, Bridgewater and Smith 8 Although multiple types of events were included in both models, the relative lack of heterogeneity in the locations of those events limits the degree to which these models can be generalized. While racing events were included in the Arbon model,Reference Arbon, Bridgewater and Smith 8 it is unclear if such events included auto-racing in an urban environment. The development of the Hartman model did not include a similar racing event.Reference Hartman, Williamson and Sojka 4
Even more difficult, and perhaps more important, is predicting the number and type of medical resources that will be needed at a mass gathering. Emergency Medical Services agencies and jurisdictions have developed varying methods for managing these events. The City and County of San Francisco, for example, require that standby ambulances be present at all events with a predicted attendance of more than 15,500 persons.Reference Meites and Brown 7 San Francisco's (California USA) minimum standards were part of a broader policy adopted in 2006 by the local health department, requiring the submission of an EMS plan by event planners during the permit process. In Charlottesville, Virginia (USA), an academic ED, in conjunction with local EMS agencies, provides medical personnel at large events, such as university football games.Reference Martin-Gill, Brady and Barlotta 2 A mass-casualty incident during a university event was a significant factor leading to changes in that city's mechanisms for emergency preparedness for mass gatherings.Reference Martin-Gill, Brady and Barlotta 2 Event medical directors must work with local agencies to determine the appropriate amount and type of medical resources needed at mass gatherings.
Predicting the number of patient encounters and transports during an event is necessary to maintain EMS efficiency. Heiby et alReference Heiby, Barnhardt and Berry 21 found a statistically significant increase in 911 call volume during days when a medical team was present at a mass gathering. However, the ability of on-site licensed medical practitioners, including board-certified emergency physicians and, perhaps preferably, EMS physicians, to treat and release patients has also been shown to reduce demand on the surrounding EMS system, as was found at another racing event.Reference Grange, Baumann and Vaezazizi 22
Because of the effect of mass gatherings on local EMS resources, it is not unreasonable to require mass-gathering planners to work with local EMS agencies to ensure that the event is adequately covered without negatively affecting the rest of the public health emergency response system. Due to the complexities of predicting medical resource utilization, physicians should be involved in planning for large-scale events.Reference Parrillo 23 Specifically, EMS physicians can provide valuable medical oversight throughout the process, from planning to implementation, to ensure that appropriate resources are deployed. Emergency Medical Services physicians are considered experts in mass gatherings whose skills should be leveraged by event organizers. 24
A previous study by Zeitz et al demonstrated that the utilization of historical data of recurring events is more accurate than the Arbon predictive model.Reference Zeitz, Zeitz and Arbon 25 While the Arbon model may be useful to predict medical needs at events in which previous data are unavailable, the Zeitz method relies on reviewing records from past recurring events to forecast patient presentations and transports at similar gatherings. Using the Zeitz method, medical organizers of the BGP could potentially more accurately predict resource needs at future auto-racing events. The two studied predictive models were developed using a wide variety of event types. This limitation may be minimized by incorporating data from previous similar events.
Limitations
This study is limited in that it examined two similar events in the same city. The uniqueness of auto-racing in an urban environment may also potentially reduce the generalizability of the findings. Furthermore, individuals who sought medical attention by transporting themselves to a local ED were not included in this analysis. The number of medical issues that arose at the studied events may have actually been higher. The studied events’ closed nature with restricted access points, however, likely limited self-transports. The locations of the first aid stations, public visibility of these stations, and signage may have affected the utilization of the medical resources.
This study is also limited due to the different inclusion and exclusion criteria among the studied prediction models. Whereas the Hartman model separately predicted the number of patients requiring complete provider evaluations from those who only had “minor” complaints, the Arbon model included all encounters, regardless of the nature of the complaint. The relatively small number of expected medical issues means that a single additional case could have significantly affected the measured accuracy of the studied prediction models. Finally, it is unclear if over- or under-triage may have affected the rate of patient transports.
Conclusions
The two prediction models analyzed in this study demonstrated varying degrees of accuracy during the 2011 and 2012 BGP. These findings call attention to the need to develop a versatile and accurate model that can predict the number of patient encounters and transports during a mass-gathering event. A more accurate prediction model would be useful to event medical directors with the responsibility of determining the number and type of medical resources needed.
Acknowledgement
The authors would like to acknowledge Linda J. Kesselring, MS, ELS, the technical editor/writer in the Department of Emergency Medicine, University of Maryland School of Medicine, for her contributions as copy editor of the manuscript.


