


Physiological stress reactivity has been widely investigated by clinical and developmental psychologists because it is associated with physical and mental health outcomes (e.g., Lovallo, Reference Lovallo2010; Manuck, Olsson, Hjemdahl, & Rehnqvist, Reference Manuck, Olsson, Hjemdahl and Rehnqvist1992; Spear, Reference Spear2009). Abnormalities in stress system functioning may indicate dysregulation of internal homeostasis (Lovallo, Reference Lovallo2013). Furthermore, disproportionate or inadequate stress reactivity is recognized as deleterious for health, and thus, for survival (McEwen, Reference McEwen2007). Therefore, it is necessary to understand how abnormalities in stress system functioning come about. Environmental adversity is known to have harmful effects on the developing stress system (Champagne, Reference Champagne2013; Gunnar & Quevedo, Reference Gunnar and Quevedo2007). However, environmental adversity does not affect all individuals in the same way: some are more susceptible to environmental influences than others (Belsky, Reference Belsky1997). In the current study, we examined genetic and environmental contributions to physiological stress reactivity in a sample of children and adolescents.
Physiological Stress Reactivity
The autonomic nervous system (ANS) is one of the main stress systems in humans. Its primary component is the vagus nerve, or 10th cranial nerve, which innervates the sinoatrial node of the heart. The ANS consists of two branches: the parasympathetic nervous system (PNS) and the sympathetic nervous system (SNS). Under resting conditions, the PNS is activated, maintaining homeostasis, promoting restoration and growth, and supporting social engagement (Porges, Reference Porges1995, Reference Porges2007). When the PNS is activated, heart rate (HR) is low, the bronchi are constricted, the bladder contracted, and gastrointestinal functions are switched on (Hugdahl, Reference Hugdahl1995). Heart rate variability (HRV), or the variation in the time interval between heart beats, is frequently assessed as an index of PNS activation. Thus, when the environment is perceived as safe, PNS activation is high, which is reflected in high HRV and low HR.
When an organism encounters a stressor, the most immediate response involves vagal withdrawal. If this response is insufficient to meet the demands of the situation, the SNS is activated, entailing the fight-or-flight response, which elevates HR, increases blood pressure, dilates pupils, inhibits saliva flow, dilates the bronchi, increases secretion of adrenaline and noradrenaline, suppresses gastrointestinal functions, and inhibits bladder contraction (Hugdahl, Reference Hugdahl1995). Thus, stress elicits deactivation of the PNS and activation of the SNS, which is reflected in a decrease in HRV and an increase in HR. After the stressor subsides, SNS activation will decrease and PNS activation will increase.
The heart, like most organs in the body, is innervated by both branches of the ANS. These two branches operate independently and usually exert reciprocal influences (Berntson, Cacioppo, & Quigley, Reference Berntson, Cacioppo and Quigley1991). For example, PNS activation keeps HR low while SNS activation leads to increases in HR. Increases in HR then reflect either decreased PNS activity or increased SNS activity (van Dijk et al., Reference van Dijk, van Lien, van Eijsden, Gemke, Vrijkotte and de Geus2013). As such, HR mirrors the relative activity of the SNS and PNS (Shaffer, McCraty, & Zerr, Reference Shaffer, McCraty and Zerr2014). The ANS responds to endogenous and exogenous stressors, including psychological stress (Lovallo, Reference Lovallo2005). A common procedure used to measure physiological stress reactivity is the Trier Social Stress Test (TSST), which consists of a resting baseline period, an anticipation period, and a stress task in which the participant has to deliver a speech in front of judges and perform mathematical calculations (Kirschbaum, Pirke, & Hellhammer, Reference Kirschbaum, Pirke and Hellhammer1993). The procedure was designed to elicit a physiological stress response (Kirschbaum, Reference Kirschbaum and Stolerman2010), and contains the key elements of uncontrollability and social-evaluative threat (Dickerson & Kemeny, Reference Dickerson and Kemeny2004). The present study employed a task modeled after the TSST (see below).
Encountering a stressor will elicit a physiological stress response in most individuals, most of the time. Naturally, individuals differ considerably in the extent of their physiological activation during stress. Such inherent differences in stress reactivity have been linked to the onset and development of psychopathology (Doom & Gunnar, Reference Doom and Gunnar2013; McLaughlin et al., Reference McLaughlin, Kubzansky, Dunn, Waldinger, Vaillant and Koenen2010). Generally speaking, a healthy organism is one that is able to activate and deactivate physiological stress responses that are proportionate to contextual features of the environment, regulating emotional responses and behaviors accordingly (Del Giudice, Ellis, & Shirtcliff, Reference Del Giudice, Ellis and Shirtcliff2011). There is consistent evidence (see Beauchaine, Reference Beauchaine2001, for a review) suggesting that optimal stress reactivity is represented by moderate vagal withdrawal, thus reflecting a preparedness to respond to stimuli and, therefore, adaptive physiological activation. In contrast, dysregulated physiological stress reactivity is regarded as either enhanced (hyper)reactivity or blunted (hypo)reactivity. Both patterns of dysregulation have been observed to be associated with negative mental health outcomes (Lovallo, Reference Lovallo2011; Spear, Reference Spear2009). Therefore, it is imperative to understand factors that are related to physiological stress dysregulation.
Environmental Adversity
One of the most prominent and extensively researched factors implicated in the development of dysregulated stress reactivity is environmental adversity (Lupien, McEwen, Gunnar, & Heim, Reference Lupien, McEwen, Gunnar and Heim2009). This is because exposure to adversity leads to permanent changes in physiological systems involved in the stress response throughout the life span (Ansell, Rando, Tuit, Guarnaccia, & Sinha, Reference Ansell, Rando, Tuit, Guarnaccia and Sinha2012; Lupien et al., Reference Lupien, McEwen, Gunnar and Heim2009; McEwen, Reference McEwen2007). This is especially true during development when the brain architecture is most susceptible to acute (e.g., death of a parent) or prolonged (e.g., child maltreatment) stress (National Scientific Council on the Developing Child, 2014). Adverse life experiences are often used to index the degree of environmental adversity that is experienced. Adversity is defined as the experience of a severe environmental event, or of multiple events repeated over time (i.e., chronic stress), which represent “deviations from the expectable environment” one lives in (McLaughlin, Reference McLaughlin2016). However, even relatively common (e.g., parental divorce) or moderate adversities without the appropriate support (e.g., low parental care) or social milieu can affect physiological, cognitive, and emotional development considerably (Middlebrooks & Audage, Reference Middlebrooks and Audage2008).
This especially applies to individuals coming from low socioeconomic status (SES) settings, which is another frequently used measure of environmental adversity. Low SES represents an ecological niche where stressors are often unpredictable, uncontrollable, and chronic (Baum, Garofalo, & Yali, Reference Baum, Garofalo and Yali1999). Quite a bit of evidence exists linking low SES to dysregulated physiological stress reactivity (e.g., Evans, Reference Evans2013; Musante et al., Reference Musante, Treiber, Kapuku, Moore, Davis and Strong2000) and in turn to poor developmental outcomes (Piccolo, Sbicigo, Grassi-Oliveira, & Fumagalli de Salles, Reference Piccolo, Sbicigo, Grassi-Oliveira and Fumagalli de Salles2014; Sripada, Swain, Evans, Welsh, & Liberzon, Reference Sripada, Swain, Evans, Welsh and Liberzon2014).
An extensive body of literature has focused on the link between (early) adverse life experiences and stress reactivity in children and adolescents (for a review, see Obradović, Reference Obradović2012). A pattern consistently emerging in these studies is that of enhanced physiological stress reactivity (e.g., Ellis, Essex, & Boyce, Reference Ellis, Essex and Boyce2005). However, having experienced more adversity has also been linked to blunted physiological stress reactivity (Lovallo, Farag, Sorocco, Cohoon, & Vincent, Reference Lovallo, Farag, Sorocco, Cohoon and Vincent2012). In turn, there are reports suggesting blunted stress reactivity as a linking mechanism between childhood adversities and different pathophysiological (Heim, Ehlert, & Hellhammer, Reference Heim, Ehlert and Hellhammer2000) and psychopathological (Heleniak, McLaughlin, Ormel, & Riese, Reference Heleniak, McLaughlin, Ormel and Riese2016) outcomes. Currently, the general consensus indicates that both enhanced and blunted reactivity are possible outcomes of experiencing environmental adversity (Obradović, Reference Obradović2012) and both have to be considered as indices of physiological stress dysregulation with important health consequences (Lovallo, Reference Lovallo2013).
In the present study, we employed a composite measure of environmental adversity (Lovallo et al., Reference Lovallo, Farag, Sorocco, Acheson, Cohoon and Vincent2013) composed by different types of adverse life events combined with low SES. The types of events assessed in our study included physical and sexual violence, household dysfunction, witnessing a traumatic event, and loss of someone close. This choice is consistent with previous research (Felitti et al., Reference Felitti, Anda, Nordenberg, Williamson, Spitz, Edwards and Marks1998), which has found a number of developmental and health-related problems to be associated with these types of environmental adversities.
Differential Susceptibility to Environmental Adversity
Experiencing environmental adversity, be it acute or chronic, is not uncommon. For some, the consequences of experiencing such adversity are minimal, while for others the consequences may be more pervasive. Great variability exists in the way in which individuals are affected by similar environmental cues (Obradović & Boyce, Reference Obradović and Boyce2009). Individual differences emerge as a function of specific endogenous characteristics, such as our genetic makeup. Natural variation in our DNA sequence, such as single nucleotide polymorphisms (SNPs), affects (individual) variability around phenotypic traits (e.g., autonomic stress reactivity). Specifically, the assumption behind Gene × Environment (G × E) investigations is that depending on an individual's genotype, environmental variation will lead to different outcomes. It has been recognized that the interplay between genetic factors and environmental adversity has important consequences for physiological stress reactivity (McEwen, Reference McEwen2007).
Initially, the diathesis stress model (Zuckerman, Reference Zuckerman1999) seemed to explain individual differences in health outcomes quite well. When applied to G × E investigations, the proposition of this model was that certain risk alleles conferred heightened susceptibility to environmental adversity (e.g., stress), which led to negative health outcomes. An example of this is the seminal study by Caspi et al. (Reference Caspi, Sugden, Moffitt, Taylor, Craig, Harrington and Poulton2003) showing that an interaction between the short serotonin transporter (5-HTT) allele and life stress increased the risk for depression.
In recent years, evidence has accumulated supporting a competing theoretical model: the differential susceptibility hypothesis (Belsky, Reference Belsky1997; Belsky, Bakermans-Kranenburg, & van IJzendoorn, Reference Belsky, Bakermans-Kranenburg and van IJzendoorn2007; Belsky & Pluess, Reference Belsky and Pluess2009). From this perspective, risk alleles are plasticity alleles, conferring susceptibility to both negative and positive environments. In other words, they moderate the effects of the environment in a “for better and for worse” manner (Belsky & Pluess, Reference Belsky and Pluess2009). That is, carriers of a certain allele variant will be more vulnerable to negative environmental cues than noncarriers, but will also thrive more under positive environmental conditions compared to their genotypic counterpart. Very few studies have focused on differential effects of plasticity genes in interaction with adverse life events on autonomic stress reactivity. (Note that here we use the terms plasticity and susceptibility interchangeably. The term plasticity is used here with regard to the original definition given by Belsky et al. and should not be confused with the related, but distinct concept of neural plasticity.) Part of the reason why this is the case is that heightened physiological stress reactivity has been theorized to reflect an increased biological sensitivity to context (see Boyce & Ellis, Reference Boyce and Ellis2005), leading to negative health outcomes under negative environmental conditions, and to more positive ones under positive conditions. Therefore, stress reactivity has usually been investigated as a moderator in Person × Environment studies (e.g., Obradović, Bush, Stamperdahl, Adler, & Boyce, Reference Obradović, Bush, Stamperdahl, Adler and Boyce2010) of differential susceptibility. However, physiological stress reactivity is subjected to genetic as well as environmental influences, and might be itself affected by the interplay between nature and nurture in a so-called for better and for worse manner, as previous findings seems to indicate. Most notable in this regard, Gatt et al. (Reference Gatt, Nemeroff, Dobson-Stone, Paul, Bryant, Schofield and Williams2009) investigated the brain-derived neurotrophic factor (BDNF) Val66Met polymorphism in relation to early life stressors (ELS). Methionine carriers (i.e., Val/Met and Met/Met) exposed to a high number of ELS manifested a consistently enhanced HR in response to a startling stimuli compared to their Val/Val counterpart, while the reverse was true when no exposure to ELS was considered. Another, more recent, study conducted by Sumner, McLaughlin, Walsh, Sheridan, and Koenen (Reference Sumner, McLaughlin, Walsh, Sheridan and Koenen2015) found that the short allele of a polymorphism in the serotonin transporter gene promoter (5-HTTLPR) moderated in a for better and for worse manner the effect of maternal caregiving on autonomic responses to the TSST. However, only Sumner et al. carried out a formal test for differential susceptibility (see below), and both studies only investigated the contribution of a single candidate gene.
Polygenic Score
Most of the G × E work to date has focused on the effect of single candidate genes on the phenotype of interest. However, investigating single polymorphisms has poor predictive utility (usually explaining very little of the total variance) in polydetermined phenotypes such as physiological stress reactivity. Many genes are likely to contribute to such traits, each with very small effects (Wray, Goddard, & Visscher, Reference Wray, Goddard and Visscher2007). A relatively new way of looking into genetic effects is represented by polygenic scores, in which multiple genetic variants are summarized in one score. These scores are useful as multiple variants combined together typically explain a higher proportion of the total variance (Burgess, Butterworth, & Thompson, Reference Burgess, Butterworth and Thompson2013). Such scores represent the additive effect of a number of risk alleles that an individual carries. Here we employ a so-called unweighted polygenic score (Dudbridge, Reference Dudbridge2013) calculated by summing the number of risk-conferring alleles across the selected polymorphisms, without regard to their assumed effect size on the trait of interest.
The use of an unweighted genetic score was deemed necessary because large, well-powered, genome-wide association studies (GWAS) on physiological (autonomic) stress reactivity are not yet available. Ideally, summary statistics from GWAS are used to then construct polygenic scores in independent samples. In the absence of well-powered hypothesis-free approaches (i.e., GWAS) an alternative way to derive SNPs weights (i.e., effect sizes) would be cross-validation using the single sample at hand (Dudbridge, Reference Dudbridge2013). In other words, this is achieved by splitting the available sample to investigate main genetic effects in one part of it, called training (or discovery) sample, and then use this information to build polygenic scores in the remaining part of the sample (i.e., the target sample). However, our sample size, although reasonably large considering the phenotype of interest, was not large enough to warrant a reliable, powerful, calculation of SNPs weights.
The Current Study
In this study, we examined G × E influences on physiological stress reactivity within a differential susceptibility framework. In other words, we asked: is ANS reactivity affected by the genetic by environment interplay in a for better and for worse manner? In order to do so, we investigated the genetic moderation of different composite indices of adversity on ANS reactivity, by a polygenic score that summarizes the additive effects of six genetic variants (see below). A novelty of this approach is that we tested interaction effects and run formal tests of differential susceptibility across different types of adversity, thereby putting to test the robustness of differential susceptibility effects.
The choice of polymorphisms included in the polygenic score was guided by several considerations. First, a number of findings indicated that these polymorphisms operate as susceptibility genes (Belsky et al., Reference Belsky, Newman, Widaman, Rodkin, Pluess, Fraley and Roisman2015; Belsky & Pluess, Reference Belsky and Pluess2009), moderating in a for better and for worse manner the effects of environmental stress on various developmental outcomes. Second, all the variants considered here are implicated in the monoaminergic system, and particularly in the functioning of serotonin and/or dopamine, which are important neurotransmitters involved in ANS regulation. Third, these genetic variants have been linked by previous research to (dysregulated) physiological stress responses, stress-related disorders, and emotional functioning (see Sprangers et al., Reference Sprangers, Thong, Bartels, Barsevick, Ordoñana, Shi and Singh2014, and references in Table 1). Variants not meeting these three criteria were excluded from the index. Specifically, we focused on cumulative effects of three key genes pertaining to the dopaminergic pathway and known to be involved in the activation (catechol-O-methyltransferase [COMT]), transport (dopamine active transporter [DAT1]), and reception (dopamine receptor D4 [DRD4]) of dopamine. Furthermore, we included polymorphisms of serotonin receptor 2A (HTR2A), brain-derived neurotrophic factor (BDNF), and corticotropin-releasing hormone receptor 1 (CRHR1). Table 1 provides details regarding the specific polymorphisms included in the study and proposed risk/susceptibility alleles based on previous findings regarding physiological stress reactivity, differential susceptibility, or both.
Table 1. Risk/plasticity genes
Note: VNTR, variable number tandem repeat.
aRisk/plasticity genotypes.
To our knowledge, this is the first study focusing on the interplay between a polygenic score and measures of adversity on autonomic reactivity to a psychosocial stressor. Our polygenic score reflected genetic susceptibility to environmental cues. The higher the score, the more susceptible the individual was hypothesized to be to aversive and supportive environments, in turn leading to a greater physiological stress dysregulation (either hypo- or hyperreactivity) when exposed to the former and to a more normative stress reactivity when exposed to the latter. Adversity was indexed by composite scores of adverse life events and SES. We examined the influence of these factors on autonomic reactivity, as defined by changes in HR (ΔHR) and HRV (ΔHRV).
Two main hypotheses were tested:
1. Dysregulated HR reactivity (either hypo- or hyperreactivity), in response to a psychosocial stressor, would be apparent in carriers of multiple genetic plasticity variants (high susceptibility group), scoring high on the adverse experience composite measure, compared to carriers of fewer plasticity variants (low susceptibility group). However, this pattern would be reversed at the opposite extreme of the adverse life experience score.
2. Similarly, high vagal withdrawal (low HRV), in response to a psychosocial stressor, was expected among the high susceptibility group for individuals scoring high on the adverse experience composite measure, compared to carriers of fewer plasticity variants, but to a lesser extent (normative vagal withdrawal) for those with a low adverse experience score compared to the low genetic susceptibility group.
When interactive effects of genetic variants and adverse experiences were evident, we tested for differential susceptibility using the diagnostic criteria proposed by Roisman et al. (Reference Roisman, Newman, Fraley, Haltigan, Groh and Haydon2012).
Method
Participants
Data for the present study came from the Youth Research in The Netherlands (JOiN) study. For a detailed description of the sample, sampling procedure, and design of the study please see Huizink et al. (Reference Huizink, Greaves-Lord, Evans, Euser, van der Ende, Verhulst and Franken2012). Briefly, the JOiN study is a three-wave longitudinal study (Tick, van der Ende, & Verhulst, Reference Tick, van der Ende and Verhulst2007) conducted at the Erasmus University Medical Center (Rotterdam, the Netherlands). Children and adolescents (aged 6 to 18 years at the first wave) were randomly drawn from the general population of 35 municipalities in South Holland, the Netherlands. Eligibility criteria comprised having parents being Dutch speakers, and not having any physical problem, mental illness, or intellectual disability. Of the 2,286 eligible participants at the first wave at Time 1 (T1), 1,710 agreed to participate. Of these, 1,161 qualified (549 were excluded based on their age or lack of permission to be contacted) for the second wave at Time 2 (T2), 990 of whom participated (171 individuals did not agree or were unable to participate in T2). For the purpose of the present study, only data from the second wave were used, with the exception of SES, which was reported at T1. T2 measurements entailed the administration of questionnaires and a psychosocial stress procedure, in which 711 children and adolescents (aged 8 to 20) took part (see Huizink et al., Reference Huizink, Greaves-Lord, Evans, Euser, van der Ende, Verhulst and Franken2012, for a flow chart and description of response rates at T1 and T2). For this sample, data for at least one of the physiological variables were available for 638 individuals (46.6% boys, average age = 13.74 years, SD = 3.53). Of these, complete physiological data for HR reactivity were available for 631 individuals, and complete data for HRV reactivity were available for 462 individuals. This data discrepancy was a consequence of electrode(s) detachment during the procedure (especially in children) and/or of physiological data cleaning (i.e., excessive noise in the signal). As compared to the sample of 711 participants who participated in the stress procedure at T2, gender (p > .05, R 2 = .001), age (p > .05, R 2 < .001), and SES (p > .05, R 2 < .001) did not predict inclusion in the current sample of 638 individuals. All participants included in the present study were of Dutch ethnicity. Complete data for all variables under study was available for n = 419 and 333 for HR and HRV, respectively. (See online-only supplementary Figure S.1 for a flowchart of available data.)
Psychosocial stress procedure
The psychosocial stress procedure was modeled after the TSST (Kirschbaum et al., Reference Kirschbaum, Pirke and Hellhammer1993). It began with an explanation of the test by the experimenter. After the electrodes of the electrocardiogram were attached, participants were told to relax and breathe normally. Participants then filled in a questionnaire and sat quietly for 10 min (pretask rest) after which the stress-inducing tasks started. Three tasks appositely designed to elicit stress followed in succession. The first task was a mental arithmetic task, and was conducted in front of the test experimenter. The task consisted of serial subtraction for a total of 4 min. Participants were instructed to perform these subtractions as quickly as possible without making mistakes, and they were urged to do so by the experimenter. In addition, if they made a mistake, the test leader intervened by saying: “Wrong. Please start again at the beginning.” The subtraction differed by age group (children had an easier task). A public speaking task in front of the experimenter and a camera followed, in which participants had to imagine themselves in the hypothetical situation of being accused of stealing from the school cafeteria, or workplace (if they were no longer in school). This task was divided into two parts: mental preparation of the speech (8 min) and the speech (6 min). Finally, they completed a computer mathematics task (5 min). During the computer task, individuals had to mentally calculate the steps necessary to order four numbers from lowest through highest, and were instructed to do so as quickly as possible and without making any mistakes. Participants were also informed that these tasks were going to be evaluated at a later date. After the stress tasks, a 5-min recovery period and a calming nature documentary of 25 min followed. During the stress procedure, participants were told to sit still (in order to not confound ANS measures) and were reminded to do so if necessary. For further details on the procedure see Dieleman, van der Ende, Verlhust, and Huizink (Reference Dieleman, van der Ende, Verhulst and Huizink2010).
Measures
HR
HR was monitored continuously during the stress procedure. Measurements were taken by means of a three-lead electrocardiogram with a sampling frequency of 512 Hz. Data were stored on a flashcard via portable digital recorder (Vitaport™ System; TEMEC Instruments B.V., Kerkade, the Netherlands) and then imported and processed on a personal computer using a Vitascore™ software module (TEMEC Instruments BV, Kerkade, the Netherlands). Prior to analysis, R-top detection was used in order to calculate the interbeat intervals of the electrocardiogram. Then the entire time series was visually inspected and artifacts were removed. HR time series were calculated from the interbeat interval and averaged for each period during the psychosocial procedure. The eight periods consisted of the pretask rest, mental arithmetic, speech preparation, speech, computer task, recovery, and two documentary (during the first 10 min and the last 10 min) periods. For each period, HR was averaged per minute, and subsequently averaged across the period.
HRV
HRV was calculated for the last 3 min of the periods of the psychosocial stress procedure during which speaking did not occur (i.e., pretask rest, speech preparation, computer task, recovery, documentary 1, and documentary 2). In order to obtain an index of HRV, the HR time series during these periods were inspected for stationarity. Subsequently, the HR time series were subjected to a discrete Fourier transformation, based on nonequidistant sampling of the R-wave incidences (CARSPAN program, Groningen, The Netherlands; Mulder, Van Dellen, van der Meulen, & Opheikens, Reference Mulder, Van Dellen, van der Meulen, Opheikens, Maarse, Mulder and Akkerman1988; Van Steenis, Tulen, & Mulder, Reference Van Steenis, Tulen and Mulder1994) and reflecting the power of each frequency component averaged during the time interval (Van Steenis, Reference Van Steenis2002). This yielded power spectra of the rhythmic oscillations over a frequency range of 0.02–0.50 Hz, with a resolution of 0.01 Hz. For each period, the power in the high frequency band (0.14–0.5 Hz) of the HR time series was calculated as an index of HRV.
Stress reactivity
Delta (Δ) scores were calculated as the physiological response during each of the stress tasks minus the minimum level before or after the stress tasks (i.e., Δscore = stress task – baseline or recovery). This is consistent with previous studies, which outlined that post task values may constitute better resting measures as anticipation effects are avoided (Oldehinkel et al., Reference Oldehinkel, Ormel, Bosch, Bouma, Van Roon, Rosmalen and Riese2011). These reactivity scores were then averaged together in order to form two separate reactivity measures (i.e., ΔHR and ΔHRV). This choice seemed reasonable as the reactivity scores showed good internal reliability (α = 0.88 and 0.70 for HR and HRV reactivity measures, respectively). In this way, the HR reactivity score represented the degree to which an individual's physiological response increased (positive values) or decreased (negative values) from resting period to stress tasks. In the case of HRV, the interpretation is reversed as lower scores represented vagal withdrawal (i.e., higher reactivity) and higher scores increased PNS activity (i.e., lower reactivity). The Δ scores thus constructed followed a fairly normal distribution with skewness = 0.15 (SE = 0.11) and 0.69 (SE = 0.10) for ΔHRV and ΔHR, respectively. One outlier (–8.2 SD) for ΔHR (ΔHR = –44.76) was detected and excluded from analysis.
Adversity
Adverse life events were taken from the Stressful Life Events Questionnaire (Amone-P'Olak et al., Reference Amone-P'Olak, Ormel, Huisman, Verhulst, Oldehinkel and Burger2009) and from the National Institute for Mental Health Diagnostic Interview Schedule Composite (Shaffer, Fisher, Lucas, Dulcan, & Schwab-Stone, Reference Shaffer, Fisher, Lucas, Dulcan and Schwab-Stone2000) posttraumatic stress disorder section. Participants and their parents completed the interviews. An adverse event was considered as such and included in the scale if either the parent or the participant confirmed that the event had been experienced as unpleasant. Adverse life events selected for the purpose of the present study included physical and sexual violence (interpersonal violence: self-threatened with weapon, self-attacked or beat-up, self-forced to a sexual act including assault and rape, or sexual harassment), household dysfunction (household dysfunction: father or mother divorced or someone in family seriously mentally ill), witnessing a traumatic event (witnessing: having heard or seen someone close dying, being killed, or seriously wounded), and bereavement for loss of someone close (bereavement: mother or father died, brother or sister died, or someone close died). These constructs were then aggregated into a unique score of adverse life events ranging from 0 (no adverse events) to a maximum of 4 (sum of adverse experiences).
SES was reported by the mother and based on the higher occupational level of either parent. It was coded into low (0), average (1), and high (2) SES. This score was inversely associated with the composite measure of adverse life events, r (427) = –.121, p < .05. SES was reversely coded (i.e., high = 0, medium = 1, low = 2) and then aggregated to the adverse life events score (Lovallo et al., Reference Lovallo, Farag, Sorocco, Acheson, Cohoon and Vincent2013) as well as with each adversity construct in order to build five composite measures of adversity, one for the sum score of adverse experiences (i.e., sum of adverse experiences + SES) and one for each subconstruct separately (i.e., interpersonal violence + SES, household dysfunction + SES, witnessing + SES, and bereavement + SES). This resulted in an adverse life event score ranging from 0 to 6 (0 = 27.6%, 1 = 37.8%, 2 = 23.0%, 3 = 8.4%, 4 = 2.8%, 5 = 0.2%, 6 = 0.2%); however, due to low Ns in the right tale of the distribution, categories 4 to 6 were collapsed together. The different subconstructs (i.e., interpersonal violence, household dysfunction, witnessing, and bereavement, plus SES) were created to investigate whether each adversity component affected stress reactivity in a similar manner. These variables were coded as 0, 1, or >1, because they were positively skewed and with very few individuals at the right tale of the distribution (i.e., ~1%). As a result, at the one extreme of the distribution of the adversities scores thus constructed, there were individuals having experienced more than one adverse life event and having low SES, while at the other extreme of the distribution there were individuals having high SES and who did not experience any adverse life events. Consistent with the differential susceptibility framework, this approach was employed in order to obtain a dynamic range of environmental exposure, which reflected effects of both negative (more adverse life events and low SES) and positive (few or none adverse life events and high SES) environmental niches. Table 2 presents descriptive statistics for the study variables.
Table 2. Descriptives statistics
Note: HR, heart rate; HRV, heart rate variability; Adverse exp, sum of adverse experiences + low socioeconomic status (SES); IntViolence, physical/sexual violence + low SES; HouseDys, household dysfunction + low SES; Witnessing, witnessing a traumatic event + low SES; Bereavement, loss of someone close + low SES.
Genotyping and genetic score
Genotyping was conducted via polymerase chain reaction at the Avera Institute for Human Genetics in South Dakota. We studied six polymorphisms that were previously implicated in differential susceptibility mechanisms and that have been linked to dysregulated physiological stress reactivity. These polymorphisms were selected from a list of 40 SNPs and 4 variable number tandem repeats (VNTRs) genotyped for the JOiN study. Frequency distributions for all the genes considered did not depart significantly from the Hardy–Weinberg equilibrium: BDNF rs6265, χ2 = 0.17, p > .05; HTR2A rs6313, χ2 = 0.29, p > .05; CRHR1 rs242924, χ2 = 0.01, p > .05; COMT rs4680, χ2 = 0.01, p > .05; DAT1 VNTR, χ2 = 1.29, p > .05; DRD4 VNTR, χ2 = 1.81, p > .05.
Proposed risk/plasticity alleles and values assigned for coding (reflecting additive vs. dominant functional differences) were based on extant stress research literature and were as follows: BDNF rs6265 (val/val = 0; val/met = 1; met/met = 2), categories 1 and 2 were collapsed together due to low frequency (i.e., val/val = 0; val/met = 1; met/met = 1); COMT rs4680 (val/val = 0; val/met = 1; met/met = 2); HTR2A rs6313 (CC = 0; CT = 1; TT = 2); CRHR1 rs242924 (TT = 0; GT = 1; GG = 2); DAT1 VNTR (9/9 and 9/10 = 0; 10/10 = 1); DRD4 VNTR (not-7r = 0; 7r = 1). Regarding the CRHR1 rs242924 polymorphism, sparse evidence exists also for implications of the minor (T) allele in stress dysregulation (e.g., Cicchetti, Rogosch, & Oshri, Reference Cicchetti, Rogosch and Oshri2011); however, this latter is usually regarded as a protective factor (Clifford & Lemery-Chalfant, Reference Clifford, Lemery-Chalfant and Pluess2015). These variants were then summed into a genetic score reflecting the number of risk/plasticity alleles one carried. The score thus obtained ranged from 0 (low susceptibility) to 7 (high susceptibility) and followed a fairly normal distribution. Table 1 shows frequency distributions for the single variants under study.
Statistical analysis
Descriptive statistics of, as well as bivariate correlations between, all the main study variables were computed (Table 2 and Table 3, respectively). A manipulation check was performed by means of two separate repeated measures analyses of variance in order to check whether the stressful tasks elicited increases in HR and decreases in HRV compared to the pre- or posttask period. Prior to the main analyses, age and gender were examined by means of bivariate correlations and added as covariates in subsequent analyses if they correlated significantly with both independent and dependent variables. In order to overcome the law of initial values, baseline HR and HRV were controlled for in the main analyses (Beauchaine, Reference Beauchaine2001; Roisman, Reference Roisman2007). In addition, in order to properly control for confounders (Keller, Reference Keller2014), Covariate × Environment and Covariate × Gene interaction terms were included in the model. Ordinal least square regressions were employed to test main and interaction effects of the composite measure of adversity (sum of adverse life events + low SES), as well as of the different subconstructs, and genetic risk score on ΔHR and ΔHRV. Statistical models were run separately for each subscale. Due to α inflations across multiple tests, a sequential Bonferroni type procedure (Benjamini & Hochberg, Reference Benjamini and Hochberg1995) was applied to control for false discovery rate of interaction effects as recommended and described in Roisman et al. (Reference Roisman, Newman, Fraley, Haltigan, Groh and Haydon2012). Specifically, the significant test threshold below which the tests would remain significant beyond chance alone was calculated as α(j/c) where j is the number of significant tests (i.e., for p < .05) and c the number of tests conducted.
Table 3. Bivariate correlations between main study variables
Note: HR, heart rate; HRV, heart rate variability; Adverse exp, aggregate of adverse experiences and socioeconomic status (SES); IntViolence, composite measure of interpersonal violence and SES; HouseDys, composite measure of household dysfunction and SES; Witnessing, composite measure of having witnessed a traumatic event and SES; Bereavement, composite measure of loss of someone close and SES. Gender was coded as 0 = men, 1 = women.
*p < .05 (two tailed). **p < .01 (two tailed).
Differential susceptibility diagnostics were obtained with a web-based program designed by R. Chris Fraley (http//:www.yourpersonality.net/interaction/) as also employed by Belsky et al. (Reference Belsky, Newman, Widaman, Rodkin, Pluess, Fraley and Roisman2015). With this program, it is possible to test for differential susceptibility by running simple slopes analyses and generating interaction plots. In order to conform to the program prerequisites, independent variables were reverse coded. Where necessary (see below), new recommendations (Del Giudice, Reference Del Giudice2017) for differential susceptibility diagnostics were employed. All other analyses were performed with SPSS (V. 20.0) statistical software.
Results
Manipulation check
For HR measures, an overall significant within-group effect was evident, F (3.46, 2,112.61) = 20.56, p < .001, partial η2 = 0.033. Simple contrasts revealed significant increases in HR means compared to the pretask rest, during the mental arithmetic task, F (1, 611) = 368.90, p < .001, partial η2 = 0.37, the speech preparation, F (1, 611) = 146.31, p < .001, partial η2 = 0.19, the speech, F (1, 611) = 520.19, p < .001, partial η2 = 0.46, and the computer task, F (1, 611) = 135.93, p < .001, partial η2 = 0.18.
HRV also varied significantly across periods as indicated by an overall significant within-group effect, F (3.93, 1,682.48) = 3.25, p <. 05, partial η2 = 0.08. Simple contrasts revealed that HRV during the stress tasks significantly differed from the pretask rest: speech preparation, F (1, 428) = 3.77, p < .05, partial η2 = 0.009; computer task, F (1, 428) = 9.18, p < .01, partial η2 = 0.021. However, the effect was not in the expected direction. Contrary to expectation, HRV was significantly lower during the pretask rest than HRV during the speech preparation task and the computer task. This may be due to anticipation effects, as other studies have outlined as well (Burt & Obradović, Reference Burt and Obradović2013; Evans et al., Reference Evans, Greaves-Lord, Euser, Tulen, Franken and Huizink2013; Oldehinkel et al., Reference Oldehinkel, Ormel, Bosch, Bouma, Van Roon, Rosmalen and Riese2011). We therefore compared the stress tasks to the recovery period (i.e., sixth period). During both stress tasks, HRV was lower than during the recovery period. This difference was significant for the computer task, F (1, 428) = 8.85, p < .05, partial η2 = 0.023, but not the speech preparation, F (1, 428) = 1.39, p > .05, partial η2 = 0.003.
Table 3 shows bivariate correlations for dependent and independent variables of the study as well as covariates. No significant associations were found between the genetic score and any of the study variables, with the exception of a weak positive association with the sum of adverse life events composite measure (r = .10, p < .05). Significant negative associations were evident between measures of adverse life events and ΔHR, suggesting that increases in adverse life events corresponded to lower HR stress reactivity and higher vagal withdrawal. Similarly, we noted significant negative associations between interpersonal violence, household dysfunction, and ΔHRV, suggesting that increases in these adversity components corresponded to higher vagal withdrawal. Overall, composite measures of adverse life events were negatively associated with pretask resting HRV, but not significantly associated with pretask resting HR. As expected, age was positively associated with adverse experiences. Significant relationships were also apparent between age and pretask resting HR, HRV, and ΔHRV. Gender was weakly associated with pretask resting HRV, which tended to be higher in boys (r = –.10, p < .05), and ΔHR, which tended to be higher in girls (r = .08, p < .05).
Table 4 shows the results of the OLS regressions on ΔHRV and ΔHR as well as the differential susceptibility diagnostics proposed by Roisman et al. (Reference Roisman, Newman, Fraley, Haltigan, Groh and Haydon2012). Under regression coefficients, regression estimates for the equation Y = b 0 + b 1X + b 2Z + b 3XZ are presented for each predictor (X) listed on the left. Next to these, ΔR 2 increases and p values related to the interaction term are shown. Under differential susceptibility/diathesis–stress, differential susceptibility diagnostics are reported. Specifically, the first column reports the lower and upper bound of X (standardized) for which the regression of Y on Z (genetic score) is significant and whether the region of significance (RoS) on X is significant (i.e., within the bounds of –2 to +2 SD). The next two columns reflect the “extent” of the differential susceptibility effect, indicating the proportion of the area (PoI) and the proportion of the sample (PA) affected for “the better” by the regression of Y on X. In a prototypical differential susceptibility account, PoI should be between 40% and 60%, while the PA index should be higher than 16% (Roisman et al., Reference Roisman, Newman, Fraley, Haltigan, Groh and Haydon2012). However, recent recommendations (Del Giudice, Reference Del Giudice2017) suggest the use of a PoI window between 20% and 80%. This criterion would help to avoid false negatives, and it is less sensitive to deviations from interaction symmetry (see Del Giudice, Reference Del Giudice2017). The last column refers to the nonlinearity critique proposed by Roisman et al. (Reference Roisman, Newman, Fraley, Haltigan, Groh and Haydon2012), which shows whether any detected interaction effect is in reality a nonlinear relation disguised as (a linear) differential susceptibility effect.
Table 4. Regression estimates and differential susceptibility/diathesis–stress indices
Note: RoS, region of significance; PoI, proportion of the interaction that fell above the crossover point for the regressions; PA, the proportion of people differentially affected by the crossover interaction (i.e., proportion of participants who had values of X that fell above the cross-over point); Adverse exp, aggregate of adverse experiences and socioeconomic status (SES); IntViolence, composite measure of interpersonal violence and SES; HouseDys, composite measure of household dysfunction and SES; Witnessing, composite measure of having witnessed a traumatic event and SES; Bereavement, composite measure of loss of someone close and SES. The regression equation is Y = b 0 + b 1X + b 2Z + b 3XZ, where X is the composite measure of adverse experiences reported on the left and Z is genetic risk score (control variables not reported). RoS Z refers to the RoS with respect to genetic risk score (Z); RoS X refers to the RoS with respect to the composite measures of adverse life experiences (X). Values reported represent the upper and lower bounds of values of Z and X (standardized) at which the regression lines of outcome on Z and outcome on X are significant, respectively. Bold indicates significant slopes (p < .05). Crossover is the value of X (standardized) at which the regression lines intersect; X 2 or ZX 2 indicates whether X 2, ZX 2, or the set of both nonlinear terms together was statistically significant in the equation Y = b 0 + b 1X + b 2Z + b 3XZ + b 4X 2 + b 5ZX 2. Table based on Roisman et al. (Reference Roisman, Newman, Fraley, Haltigan, Groh and Haydon2012).
*p < .05. **p < .01.
†False discovery rate p < .05 (controlling Type I error across multiple tests; Benjamini & Hochberg, Reference Benjamini and Hochberg1995).
HR
Negative direct effects of the sum of adverse experiences composite on ΔHR were detected, β = –0.12, t (415) = –2.31, p = .02; R 2 = 0.03, adjusted R 2 = 0.02, F (4, 415) = 3.03, p = .02, suggesting blunted HR reactivity as a function of adverse experiences (see online-only supplementary Figure S.3). These effects, however, seemed to be driven primarily by the adolescents group as reported in supplementary material (see online-only supplementary Table S.1).
The same relationship was also evident for the different composite measures of adverse life events considered separately: interpersonal violence, β = –0.17, t (415) = –3.49, p < .001; household dysfunction, β = –0.12, t (415) = –2.37, p = .02; bereavement, β = –0.12, t (415) = –2.60, p = .01; with the exception of witnessing, β = –0.09, t (415) = –1.82, p = .07. Interpersonal violence explained the highest proportion of variance, R 2 = .04, adjusted R 2 = .03, F (4, 415) = 4.78, p = .01, followed by bereavement, R 2 = .03, adjusted R 2 = .02, F (4, 415) = 3.39, p = .006, and household dysfunction, R 2 = .03, adjusted R 2 = .02, F (4, 414) = 3.14, p = .014. No statistically significant effects were detected for the polygenic score on ΔHR. Likewise, no significant interaction effects were found for any of the independent variables on ΔHR.
HRV
Regarding HRV, the composite sum of adverse experiences, as well as the adversity scores subcomponents taken separately, did not exert any significant main effect on ΔHRV. Similarly, no main effect of the genetic score was detected. However, interaction effects were evident for the main composite measure of adversity β = –0.14, t (315) = –2.52, p = .01, as well as for the different subcomposites taken separately, as shown in Figure 1. For the sum of adverse experiences, R 2 = .07, adjusted R 2 = .04, F (9, 315) = 2.45, p < .001, all indices supported a differential susceptibility account (Table 4) with PoI between 20% and 80% (Del Giudice, Reference Del Giudice2017), PA > 16%, and no nonlinear effect detected (neither X 2, ZX 2, nor the combination of both were significant). The RoS on X was significant for both the lower, b = –918.96, t (324) = 2.45, p = .015, and the upper, b = 813.63, t (324) = 2.04, p = .04, bounds (conventionally set to +2 or –2 SD). Of note, the RoS on Z tests indicated that the regression of Y on X was significant for the high susceptibility group (+1 SD genetic score), but not for the low susceptibility group (–1 SD genetic score). Specifically, the association between interpersonal violence and ΔHRV was positive and statistically significant for the high susceptibility group, b = 576.90, t (315) = 2.41, p = .016, but negative and not significant for the low susceptibility group, b = –289.40, t (315) = 1.08, p = .28. This suggested a prototypical differential susceptibility scenario, in which high plasticity individuals (those scoring high on the genetic score in our case) are more susceptible to the influences of both positive and negative environments, while low plasticity individuals, also termed fixed strategists (e.g., see Belsky et al., Reference Belsky, Bakermans-Kranenburg and van IJzendoorn2007), respond similarly to different environmental cues.
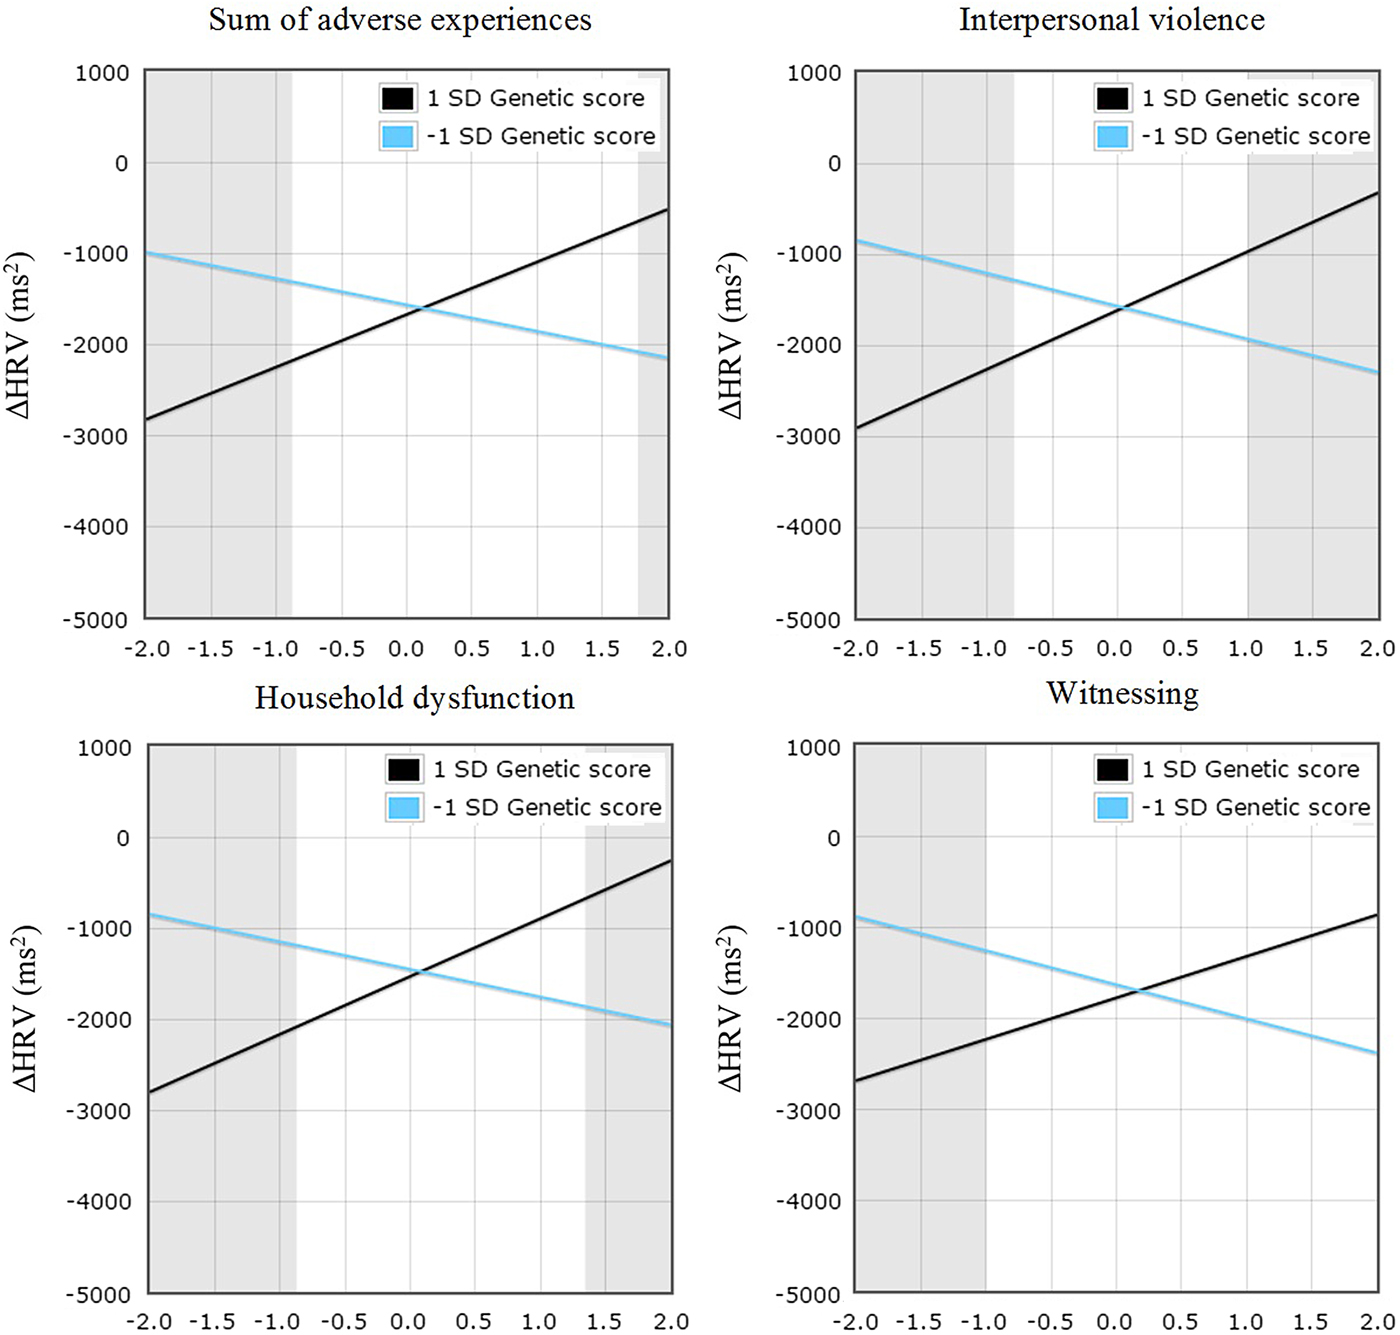
Figure 1. (Color online) Change in heart rate variability (ΔHRV) for sum of adverse experiences, interpersonal violence, household dysfunction, and witnessing composite measures genetic score (high vs. low plasticity). Gray regions represent regions of significance. Independent variables are reverse coded.
A similar pattern of findings emerged across the different subcomposite measures of adversity. Significant G × E interactions were evident for interpersonal violence, β = –0.17, t (315) = –2.99, p = .003, household dysfunction, β = –0.15, t (315) = –2.61, p = .009, and witnessing, β = –0.13, t (315) = –2.24, p = .02, but not for bereavement, β = –0.11, t (315) = –1.92, p = .06. Pertaining to interpersonal violence and household dysfunction, the significant interactions of genetic score with interpersonal violence, R 2 = .08, adjusted R 2 = .05, F (9, 315) = 2.87, p = .003, and genetic score with household dysfunction, R 2 = .06, adjusted R 2 = .04, F (9, 315) = 2.39, p = .01, both passed all the criteria for differential susceptibility (Roisman et al., Reference Roisman, Newman, Fraley, Haltigan, Groh and Haydon2012), as shown in Table 4, suggesting that differential susceptibility explains the effects of these subsets of adverse life experiences in interaction with the genetic score on HRV reactivity. Finally, the significant interaction of the genetic score with witnessing, R 2 = .05, adjusted R 2 = .02, F (9, 315) = 1.68, p = .03, passed three out of four criteria for differential susceptibility. However, the RoS on X was significant for the lower, b = –902.54, t (315) = 2.27, p = .02, but not for the upper, b = 758.51, t (315) = 1.77, p = .08, bound. Of note, all the interaction effects passing the suggested criteria for differential susceptibility also survived the procedure for false discovery rate (i.e., effects were declared statistically significant beyond chance alone at p < .02). None of these effects were found to be gender specific. As was the case with main effects of adversity on ΔHR, interaction effects seemed to be driven primarily by the adolescent group (see online-only supplementary Table S.1).
Discussion
In the present study, we examined the interaction between composite measures of adversity and six genetic variants, known to be implicated in physiological stress functions, on autonomic stress reactivity in a sample of children and adolescents. Adversity was defined as “physical or sexual abuse,” “household dysfunction,” “death of someone close,” “having witnessed a traumatic event,” or the sum of these, combined with low SES. Consistent with the differential susceptibility framework (Belsky, Reference Belsky1997), it was hypothesized that the composite measures of adversity would differentially affect stress reactivity depending on the number of genetic variants carried. Specifically, it was expected that a psychosocial stress procedure would elicit physiological stress dysregulation (either hypo- or hyperreactivity) in highly susceptible versus less susceptible individuals (carriers of multiple vs. fewer genetic variants) scoring high on composite measures of adversity. Conversely, at the opposite extreme of the adverse life experience scores, a more normative response to stress was expected for highly susceptible versus less susceptible individuals. This working hypothesis was tested for HR and HRV reactivity to psychosocial stress.
In support of the study hypotheses, the results showed a G × E interplay influencing stress reactivity as measured by HRV reactivity. Greater reactivity emerged as a function of adversity in carriers of more variants compared to carriers of fewer ones. This pattern was reversed in individuals scoring low on the adversity composite such that a moderate, and thus closer to optimal (Beauchaine, Reference Beauchaine2001), HRV reactivity to stress was evident in the high susceptibility group, whereas the low susceptibility group was subjected to greater autonomic dysregulation (greater vagal withdrawal; Figure 1). Of note, previous research investigating a single polymorphism (Gatt et al., Reference Gatt, Nemeroff, Dobson-Stone, Paul, Bryant, Schofield and Williams2009), the BDNF Val66Met gene, in relation to autonomic stress reactivity found a similar interaction pattern.
No significant interaction effect was detected when stress reactivity was defined by HR reactivity. This may be due to a predominant sympathetic influence over HR changes, while our composite genetic score largely consisted of variants involved in parasympathetic function. Virtually all the variants included in the genetic score, although generally implicated in the neurotransmitter activity of the ANS, have been suggested to be mainly involved in vagal function, thus having important implications for parasympathetic activity and to a lesser extent for sympathetic activity. Only two variants included in the genetic score (i.e., COMT and DRD4) have been hypothesized to be implicated in sympathetic dysfunctions by previous accounts (Chitbangonsyn et al., Reference Chitbangonsyn, Mahboubi, Walker, Rana, Diggle, Timberlake and O'Connor2003). On a separate note, heritability estimates for physiological reactivity to stress have been established to range between 34% and 47% for cardiac parasympathetic control, while for cardiac sympathetic control estimates range between 10% and 19% (Neijts et al., Reference Neijts, van Lien, Kupper, Boomsma, Willemsen and de Geus2015). This could explain why our genetic score did not capture variability in HR reactivity. In other words, it is plausible that this nonsignificant result reflects a mismatch between the genetic architecture of HR reactivity and our genetic score. Conversely, power may have not been sufficient to detect the subtle genetic variation in sympathetic-driven HR responses to stress. This may have also affected the predictive capacity of our interaction term.
Our results indicated that children and adolescents displayed blunted HR reactivity in relation to adversity scores (Table 4). This pattern was a robust finding as it emerged across all types of adversity scores considered here, suggesting hyporeactivity in individuals exposed to adverse life events. This adds to previous literature indicating blunted stress reactivity as a function of life stress, in relation to both the hypothalamus–pituitary–adrenal axis response (Carpenter, Shattuck, Tyrka, Geracioti, & Price, Reference Carpenter, Shattuck, Tyrka, Geracioti and Price2011; Gunnar, Frenn, Wewerka, & Van Ryzin, Reference Gunnar, Frenn, Wewerka and van Ryzin2009; Gunnar & Vazquez, Reference Gunnar and Vazquez2001) and cardiovascular responses (Lovallo et al., Reference Lovallo, Farag, Sorocco, Cohoon and Vincent2012; Phillips, Carroll, Ring, Sweeting, & West, Reference Phillips, Carroll, Ring, Sweeting and West2005).
Considered together, these findings have implications for the nature–nurture conundrum regarding stress reactivity in the context of differential susceptibility. We tested interactions between a polygenic score and a composite measure of adversity summarizing a number of adverse life events while taking into account the surrounding environmental niche (i.e., SES). In addition, we tested whether and how each subconstruct, namely, interpersonal violence, household dysfunction, witnessing, and bereavement (i.e., loss of someone close), affected autonomic stress reactivity in a similar manner. This is novel, as we did not limit our test of differential susceptibility to a composite adversity construct, but we tested the robustness of differential susceptibility by testing interactions effects also at the level of particular adversities composing this score. Of note, not only the main composite measure of adversity but also two out of three of the significant interactions involving the adversity subcomponents (i.e., interpersonal violence and household dysfunction) passed all the criteria suggested by Roisman et al. (Reference Roisman, Newman, Fraley, Haltigan, Groh and Haydon2012) to test for differential susceptibility (see Table 4). In addition, this for better and for worse pattern was apparent for all the adversities scores (Figure 1) considered. The bereavement subcomponent, which included death of a parent, sibling, or someone close, did not reach conventional statistical significance. On these grounds, it is possible to speculate that this represents a type of adversity that, although sufficient to provide long-lasting emotional scars, is not as unsettling as being exposed to brutal maltreatment or the experience of emotional injustice, at least in our sample. However, this is an entirely speculative conclusion, and a goal of future studies should be to investigate whether different subsets of exposure to adversities do play a similar role in physiological stress reactivity, as the present findings seem to imply. Likewise, it may be interesting for future research to consider the effects that specific positive life events have on stress reactivity, next to adversities.
However, it must be noted that the lack of an actual measure of positive life events limits our conclusions regarding differential susceptibility. That is, given that our measure of environmental susceptibility did not cover the full spectrum of possible environmental effects, it remains unclear whether individuals at the low end of our composite adversity measure benefitted from actual positive environmental influences or simply the lack of negative ones. The inclusion of a measure of positive life events would have certainly allowed a more solid conclusion regarding differential susceptibility. Nevertheless, it must also be stressed that individuals at the low end of our composite measure of adversity not only experienced few or no adverse life events but also were coming from a higher SES background than those at the opposite end of the distribution. Therefore, they were more likely to be exposed to positive environmental cues and lower chronic stress than their counterparts who were coming from a lower SES background. There are a few additional limitations that must be taken into account when considering the present results. One limitation is that the sample size was limited; thus, until replication, these data should be considered as suggestive rather than conclusive. However, it is of note that these effects are rather consistent with other findings related to G × E contributions to autonomic (Gatt et al., Reference Gatt, Nemeroff, Dobson-Stone, Paul, Bryant, Schofield and Williams2009; Sumner et al., Reference Sumner, McLaughlin, Walsh, Sheridan and Koenen2015) and hypothalamus–pituitary–adrenal axis stress reactivity (Pagliaccio et al., Reference Pagliaccio, Luby, Bogdan, Agrawal, Gaffrey, Belden and Barch2014). Another potential study limitation regards the use of an unweighted genetic score summarizing the effects of different variants related to stress. It would be preferable to use a weighted polygenic score, which would take into account the relative effect sizes of each polymorphism in relation to the trait of interest. In addition, as outlined elsewhere (Plomin, Reference Plomin2013), a common problem of candidate gene approaches regards the plausibility of a priori hypotheses on which to base the selection of certain “candidates” rather than others. Related to this concern, many thousands of variants may be considered as plausible candidates, one way or the other (Plomin, Reference Plomin2013). These issues may be addressed by using information from hypothesis-free approaches, such as GWAS, to build polygenic scores summarizing weighted effects across hundreds, or even hundreds of thousands, of genetic variants. However, this type of information can only be properly derived by large GWAS, which, in the context of physiological stress reactivity, are not yet available. On a separate note, classical univariate GWAS have limited potential for detecting susceptibility genes (i.e., those that would emerge as pivotal in moderating environmental effects) as they are designed to identify main genetic effects in relation to particular outcomes. In this regard, investigations of interaction effects are better suited to identify susceptibility genes. It must also be outlined that we detected in bivariate correlations a weak, but statistically significant, association between the polygenic risk scores and the composite measure of adversity. This may reflect a case of gene–environment correlation, which could have affected our estimation of G × E effects. We also note, however, that such an association was detected only at the level of the composite measure of adversity, and not at the level of specific subcomponents. Interaction effects and differential susceptibility estimates were found to be consistent across adversity composites, and as such we do not believe that this weak correlation should raise concern.
An additional concern relates to developmental differences, which might have played a role as the age range for the sample was quite large (8 to 20 years). Neuroanatomical and functional brain changes in the transition between childhood and adolescence, next to changes in pubertal maturation, are likely to lead to differences between children's and adolescents’ stress physiology (see Eiland & Romeo, Reference Eiland and Romeo2013). In other words, it is likely that the ways in which children react to stress are different from the ways in which adolescents react to stress, with evidence that the latter group is subjected to heightened sensitivity to stressors (Casey, Jones, & Hare, Reference Casey, Jones and Hare2008). Increases in physiological responses to psychosocial stressors have been found in normative samples of adolescents compared to children, across both different hormonal (Gunnar, Wewerka, Frenn, Long, & Griggs, Reference Gunnar, Wewerka, Frenn, Long and Griggs2009) and autonomic (Stroud et al., Reference Stroud, Foster, Papandonatos, Handwerger, Granger, Kivlighan and Niaura2009) indices. However, these developmental differences have been found to be measure dependent (differing across physiological indices) and task dependent (differing across laboratory stressors; see Spear, Reference Spear2009). In our study, main effects of the composite measure of adversity on ΔHR, and interaction effects for ΔHRV, seemed to be driven primarily by the adolescent subsample (see online-only supplementary Table S.1). However, we note that the subsample of children was smaller than that for adolescents, and power may have been limited to detect an effect in this latter group. Finally, we note that while the different measures of adversity were based on validated questionnaires, and the composite scoring has been previously operationalized (Lovallo et al., Reference Lovallo, Farag, Sorocco, Acheson, Cohoon and Vincent2013), the different composite constructs here employed have not yet been formally validated.
Overall, we have limited knowledge of the mechanisms through which the polymorphisms considered here collectively affect stress reactivity. Thus, the significance of the genetic score employed in the present study remains to be clarified. We limited our choice of genetic variants to those that had already emerged in the context of differential susceptibility as plasticity factors, and at the same time, based on the extant stress research literature. The present findings have thus important implications as they suggest that autonomic stress reactivity is affected by the interplay between nature and nurture in a for better and for worse manner. Particularly, our results seem to indicate that differential modulation of the parasympathetic response to stress may lie at the basis of environmental susceptibility. This could be explored from multiple perspectives by researchers interested in differential susceptibility.
We further reiterate the importance of the present study findings by outlining several facts. First, we employed measures of environmental adversity reflecting different subsets of adverse life events. These measures were aggregated to SES, thereby representing a continuum spanning from low chronic stress and no major stressors to high chronic stress and multiple major stressors. Second, we followed recommendations (Del Giudice, Reference Del Giudice2017; Roisman et al., Reference Roisman, Newman, Fraley, Haltigan, Groh and Haydon2012) to test for differential susceptibility by employing diagnostic indices increasingly used across the relevant literature. Third, the autonomic measures investigated here are reliable indices widely employed by researchers and therefore comparable across studies. To the best of our knowledge, this is the first study examining interaction effects of multiple adversity scores and a polygenic measure of plasticity in relation to autonomic stress reactivity in children and adolescents. As such, this study provides useful information for future research in this direction.
Supplementary Material
To view the supplementary material for this article, please visit https://doi.org/10.1017/S095457941700181X.


