


Management Implications
While the impacts of invasive plants have been documented, better understanding of the processes that promote invasion can inform management. Studies of spatial patterns of invasion have shown that this can be impacted both by propagule rain (e.g., proximity to seed sources) and community invasibility (e.g., disturbance), but rarely have both factors been simultaneously assessed to determine their relative importance. We tested the importance of propagule rain and invasibility (canopy and ground-layer disturbances) on recruitment (establishment of new individuals in uninvaded plots) for four invasive plant species in a mature deciduous forest in Maryland. Propagule rain was an important predictor of where new plants of three species (Japanese barberry (Berberis thunbergii DC), wine raspberry (Rubus phoenicolasius Maxim.), and Japanese stiltgrass [Microstegium vimineum (Trin.) A. Camus]) would establish, but we could not assess this for the fourth, multiflora rose (Rosa multiflora Thunb.), due to the scarcity of fruiting individuals. Ground-layer disturbance was a good predictor of where B. thunbergii established, and canopy gaps predicted locations where M. vimineum and, to some extent, R. multiflora established. But canopy gaps also promoted fruit production of B. thunbergii and R. phoenicolasius, so this disturbance interacted with propagule rain to increase establishment in and near gaps. This provides a strategy for managers with limited resources to find and treat plant invasions: for those species for which either seed production or seedling recruitment is strongly associated with new canopy gaps, control efforts focused on these areas should be effective in reducing invasive spread within stands.
Introduction
An important question in plant ecology involves the relative importance of seed limitation and establishment limitation in the spread of plant populations and the composition of communities (e.g., Clark et al. Reference Clark, Poulsen, Levey and Osenberg2007). In the context of invasion of nonnative species, this question is framed as the relative importance of community invasibility versus propagule pressure (Colautti et al. Reference Colautti, Grigorovich and MacIsaac2006). Because invasive plants impact native species, communities, and ecosystems (Jauni and Ramula Reference Jauni and Ramula2015; Vila et al. Reference Vila, Espinar, Hejda, Hulme, Jarosik, Maron, Pergl, Schaffner, Sun and Pysek2011), understanding the factors that impede or promote their expansion has the potential to inform management.
Propagule pressure was more frequently a predictor of invasion than was any other characteristic in a meta-analysis by Colautti et al. (Reference Colautti, Grigorovich and MacIsaac2006). However, propagule pressure was characterized differently in different studies, because it has multiple definitions. Lockwood et al. (Reference Lockwood, Cassey and Blackburn2009) recommend using “propagule pressure” only as a measure of the total number of individuals introduced to an area, as defined by Williamson (Reference Williamson1996), and using “propagule rain” for the number of propagules coming from an invasion front or focus. This latter process is relevant to studies (including this one) that focus on “infilling,” the population growth of an invasive following colonization of a stand, a critical stage in invasion (Taylor and Cruzan Reference Taylor and Cruzan2015). Therefore we will use “propagule rain” to describe direct and indirect measurements of propagule numbers, both in our study and those we cite, even when “propagule pressure” was used by the authors.
Invasibility, the intrinsic susceptibility of a plant community to invasion by nonnative plant species, is influenced by a variety of factors, including species richness and disturbance (Lonsdale Reference Lonsdale1999). Disturbance often promotes the invasibility of plant communities (Hobbs and Huenneke Reference Hobbs and Huenneke1992) by increasing resource flux or decreasing resource uptake by native plants (Davis et al. Reference Davis, Grime and Thompson2000; Sher and Hyatt Reference Sher and Hyatt1999). However, not all studies have shown a positive relationship between disturbance and invasion (see reviews by Colautti et al. Reference Colautti, Grigorovich and MacIsaac2006; Moles et al. Reference Moles, Flores-Moreno and Bonser2012). Sher and Hyatt (Reference Sher and Hyatt1999) and Moles et al. (Reference Moles, Flores-Moreno and Bonser2012) concluded that for most nonnative species, change in disturbance regimes, rather than disturbance itself, was a better predictor of invasion.
In forests, two classes of disturbance may promote invasion: canopy gaps and ground-layer disturbance, with the latter typically occurring at a smaller spatial scale. Soil and leaf litter disturbance can alter soil moisture, pH, and temperature (Facelli and Pickett Reference Facelli and Pickett1991) and have been hypothesized to facilitate the invasion of nonnative plant species (Warren et al. Reference Warren, Bahn, Kramer, Tang and Bradford2011a). A decrease in leaf litter depth exposes seeds and seedlings to more sunlight, potentially facilitating germination (Facelli and Pickett Reference Facelli and Pickett1991). In grasslands, soil disturbance is associated with invasion of exotic species (reviewed by Hobbs and Huenneke Reference Hobbs and Huenneke1992). In forests, seedling establishment of invasive garlic mustard [Alliaria petiolata (M. Bieb.) Cavara & Grande] and Amur honeysuckle [Lonicera maackii (Rupr.) Herder] were higher in experimental plots with less leaf litter (Bartuszevige et al. Reference Bartuszevige, Hrenko and Gorchov2007), and seedling emergence of European buckthorn (Rhamnus cathartica L.) was higher on bare ground than in areas with litter or herbaceous plants (reviewed by Knight et al. Reference Knight, Kurylo, Endress, Stewart and Reich2007). The annual grass Japanese stiltgrass [Microstegium vimineum (Trin.) A. Camus] is associated with areas of shallow leaf litter, as well as higher soil moisture and higher light (Warren et al. Reference Warren, Bahn, Kramer, Tang and Bradford2011a). Conversely, seedling establishment of the invasive grass perennial false-brome [Brachypodium sylvaticum (Huds.) P. Beauv.] was lower in experimental plots of bare soil than control plots in deciduous forest (Taylor and Cruzan Reference Taylor and Cruzan2015).
Treefall gaps or openings in the canopy resulting from tree death due to wind, disease, insects, or logging enhance light and nutrient availability, enabling species that were previously suppressed to establish and grow (Brokaw Reference Brokaw1982; Denslow Reference Denslow1987; McCarthy Reference McCarthy2001; Muscolo et al. Reference Muscolo, Bagnato, Sidari and Mercurio2014; Runkle Reference Runkle1984). While an association between canopy disturbance and abundance of invasive plants in temperate forest has been documented (e.g., Whitfield et al. Reference Whitfield, Lodge, Roth and Reich2014), most studies did not determine whether gaps promoted seedling recruitment or enhanced other demographic rates (e.g., growth, survival, vegetative reproduction). Seedling establishment of M. vimineum and multiflora rose (Rosa multiflora Thunb.) was shown to be higher where gaps were created in the canopy (Glasgow and Matlack Reference Glasgow and Matlack2007). Sexual reproduction of invasive plants, on the other hand, has often been shown to be limited to, or significantly higher in, high light conditions associated with gaps. Because of this pattern, Iannone et al.’s (Reference Iannone, Zellner and Wise2014) model of forest invasion by exotic shrubs explored the consequences of earlier reproduction and higher fecundity in gaps. For example, the number of fruits per shrub of Japanese barberry (Berberis thunbergii DC) was positively correlated with light (Silander and Klepis Reference Silander and Klepis1999), and fruiting of alder buckthorn (Frangula alnus Mill.) was limited to large gaps (Burnham and Lee Reference Burnham and Lee2010).
While the expansion of invasive populations has been linked to canopy disturbance, ground-layer disturbance, and propagule rain, few studies have simultaneously investigated two or all three of these drivers in the same system. Such studies manipulated propagule rain across natural gradients in disturbance (Von Holle and Simberloff Reference Von Holle and Simberloff2005), manipulated disturbance across gradients of propagule rain (Taylor and Cruzan Reference Taylor and Cruzan2015), manipulated both (Tanentzap and Bazely Reference Tanentzap and Bazely2009; Warren et al. Reference Warren, Bahn and Bradford2012), or used a nonmanipulative approach (Eschtruth and Battles Reference Eschtruth and Battles2011, Reference Eschtruth and Battles2014; Whitfield et al. Reference Whitfield, Lodge, Roth and Reich2014).
Our objective was to simultaneously test three hypotheses for the spatial pattern of recruitment of each of four invasive plant species in deciduous forest stand: 1) recruitment is promoted by propagule rain, 2) recruitment is promoted by canopy disturbance, and 3) recruitment is promoted by ground-layer disturbance. Our approach was nonmanipulative, but differed from previous nonmanipulative studies by locating all recruits of these species through the use of complete censuses at two points in time. These censuses also provided us with the locations of canopy gaps, bare soil, and propagule sources of the study species, enabling spatially explicit analyses of their effects on recruitment.
Materials and Methods
Study Site
This study was conducted in a 9-ha upland forest area within a 16-ha forest dynamics plot at the Smithsonian Environmental Research Center (SERC) near Edgewater, MD (38.887°N to 38.891°N and 76.562°W to 76.557°W) (Figure 1). This plot is one of the permanent forest dynamics plots of the Center for Tropical Forest Science (CTFS) and Smithsonian Institution Global Earth Observatories (SIGEO) network (Anderson-Teixeira et al. Reference Anderson-Teixeira, Davies, Bennett, Gonzalez-Akre, Muller-Landau and Wright2014). The remaining 7 ha of the plot consist of floodplain habitat and were not surveyed due to differences in vegetation between the upland and floodplain forest (Emsweller Reference Emsweller2015). Annual precipitation averages 1,068 mm and mean annual temperature is 13.2 C (Anderson-Teixeira et al. Reference Anderson-Teixeira, Davies, Bennett, Gonzalez-Akre, Muller-Landau and Wright2014).
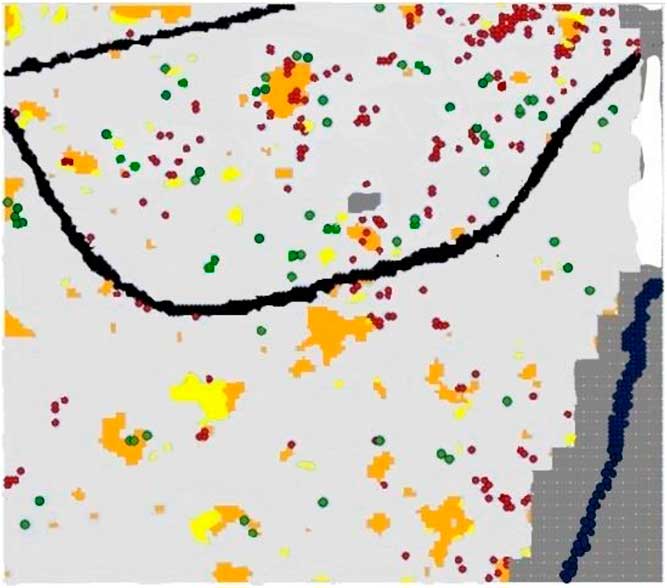
Figure 1 Map of the 9-ha study area at the Smithsonian Environmental Research Center showing canopy conditions and locations of Rubus phoenicolasius fruiting plants and recruits in 2014. Subplots classified as “new gaps” are in orange, “closed gaps” are in yellow, and “persistent non-gaps” are in light gray (see “Materials and Methods” for criteria and methods). The gravel road is shown in the NW corner of the plot, and the one-lane road runs through the entire plot (black). The creek runs through the SE corner of the plot (dark blue). The areas of open water on the northeastern portion of the plot were not censused in either 2011/2012 or 2014, these are shown in white. Areas not censused in 2014 are shown in dark gray; these consist of a wetland on the eastern portion of the plot and an area where a tower was being constructed just north of the paved road. Subplots with one or more fruiting R. phoenicolasius plant in 2014 are shown in red, and subplots with one or more 2014 “recruits” are shown in green.
The 16-ha plot located at SERC consists of both floodplain and mature secondary forest. The canopy is composed of about 40 tree species, including tulip poplar (Liriodendron tulipifera), hickories (Carya spp.), beech (Fagus grandifolia), oaks (Quercus falcata, Q. coccinea, Q. velutina, Q. rubra, Q. alba), red maple (Acer rubrum), and sweetgum (Liquidambar styraciflora) (nomenclature follows Gleason and Cronquist [Reference Gleason and Cronquist1991]). There are about 150 understory species at SERC, including introduced species such as wine raspberry (Rubus phoenicolasius Maxim.), M. vimineum, and B. thunbergii (Parker et al. Reference Parker, Richie, Lind and Maloney2010). The northwest portion of this plot is located just south of a stand that was logged from the fall of 2006 through the spring of 2007 (G Parker, personal communication, November 2012). This logging event made this stand highly invasible, and by 201l it contained high densities of several invasive plant species. There are two roads within the plot, a rarely used gravel service road in the northwest corner and a one-lane, lightly used paved road (Figure 1).
We censused the entire 9-ha study area for invasive plants and disturbance at two points in time. The first census was carried out in 2011 on 4 ha and in 2012 on the other 5 ha (Driscoll et al. Reference Driscoll, Angeli, Gorchov, Jiang, Zhang and Freeman2016); the second census was in 2014; from late May through July in each case. We used an existing network of PVC markers to divide each hectare into 10 by 10 m plots. Each plot was then further divided into five 2 by 2 m subplots, for a total of 22,500 subplots. Of these subplots, 21,986 were censused in 2011/2012; the remainder occurred in areas of standing water on the eastern boundary (Figure 1). Of those subplots censused in 2011/2012, 19,659 subplots were recensused in 2014; the only areas not censused were 2,685 subplots in floodplain and wetland in the eastern end of the study area and 156 subplots that could not be accessed due to construction for a sensor tower (Figure 1). Of the subplots censused in 2014, approximately 581 were on roads and were not used in analyses of recruit distribution, but their canopy height-class data (see “Field Methods” section) were used in mapping of gaps.
Study Species
This study focused on four invasive plant species: B. thunbergii, R. phoenicolasius, R. multiflora, and M. vimineum. The first three species were chosen based on their abundance in the 9-ha study site—they were the second, third, and fourth most frequent invasive plants after Japanese honeysuckle (Lonicera japonica Thunb.) (Freeman et al. Reference Freeman, Driscoll, Angeli and Gorchov2015). Microstegium vimineum was chosen as an additional focal species because it is a new invasive in the study site.
Rubus phoenicolasius has been present at SERC since the 1960s, but was restricted to roadsides. More than 20 yr ago, R. phoenicolasius began to spread into the 16-ha study site. Berberis thunbergii established in the 1960s and 1970s in several forested areas immediately adjacent to SERC; the 16-ha study site was invaded by B. thunbergii about 36 yr ago (D Whigham, personal communication, April 2014). Rosa multiflora is found along the roads and forested areas of SERC and has been established in the study site for more than 45 yr (D Whigham, personal communication, April 2014). Microstegium vimineum is a relatively new invasive species at SERC and has invaded the 16-ha study cite within the last decade. Populations of M. vimineum are mostly restricted to areas along roadsides and waterways; however, in the past few years populations have started to establish within the forested area of the 16-ha study site (D Whigham, personal communication, June 2015).
Rubus phoenicolasius is typically found in forest gaps and habitat edges (Swearington et al. Reference Swearington, Reshetiloff, Slattery and Zwicker2002). In our study area, seedlings of R. phoenicolasius were largely limited to large gaps, with very few occurring in small gaps or non-gap plots (Gorchov et al. Reference Gorchov, Thompson, O’Neil, Whigham and Noe2011). While this could be due to higher seedling establishment or survival in gaps, it alternatively could be due to the higher fruit production of this species in large gaps (Driscoll et al. Reference Driscoll, Angeli, Gorchov, Jiang, Zhang and Freeman2016; Gorchov et al. Reference Gorchov, Thompson, O’Neil, Whigham and Noe2011) combined with short seed-dispersal distances, resulting in most seeds arriving within large gaps. Established plants were able to survive and grow in shade as well as high light environments (Gorchov et al. Reference Gorchov, Thompson, O’Neil, Whigham and Noe2011). At our study site, all life-history stages of this species have significantly higher density in treefall gaps than under closed canopy forest, and density of fruiting individuals correlated with gap size (Driscoll et al. Reference Driscoll, Angeli, Gorchov, Jiang, Zhang and Freeman2016). Ground-layer disturbance may also be important, as seedling survival was higher in areas of shallower leaf litter (Gorchov et al. Reference Gorchov, Thompson, O’Neil, Whigham and Noe2011). Rubus phoenicolasius will generally produce one primocane per year from its base; however, it is able to grow multiple primocanes under high light levels. Rubus phoenicolasius canes tend to tip over as they grow, and upon touching the ground, tips may root and initiate new ramets (Gorchov et al. Reference Gorchov, Thompson, O’Neil, Whigham and Noe2011).
Berberis thunbergii commonly invades deciduous forests, fields, and roadsides (Randall and Marinelli [Reference Randall and Marinelli1996], as cited by Silander and Klepis [Reference Silander and Klepis1999]). Both biomass and stem growth have positive relationships with light exposure, and fruit production is greater in areas of higher light intensity (Silander and Klepis, Reference Silander and Klepis1999). Seedling survival is higher in higher light environments (Lubell and Brand Reference Lubell and Brand2011), but mature plants can persist under dense canopies (Silander and Klepis Reference Silander and Klepis1999). In our study site, density of fruiting individuals, but not of other life-history stages, was significantly higher in treefall gaps than in non-gap areas (Driscoll et al. Reference Driscoll, Angeli, Gorchov, Jiang, Zhang and Freeman2016). High survival of B. thunbergii under dense canopy has been attributed to its extended leaf phenology (Silander and Klepis Reference Silander and Klepis1999).
Rosa multiflora is a shrub that can attain 3 m in height (Amrine Reference Amrine2002), and it has the ability to climb trees (Banasiak and Meiners Reference Banasiak and Meiners2009). Rosa multiflora can invade mature forests, but is more successful at invading riparian areas, thickets, and edges (Robertson et al. Reference Robertson, Robertson and Tague1994); density and growth correlate with light (Dlugos et al. Reference Dlugos, Collins, Bartelme and Drenovsky2015). Flower and fruit production in forest interior is only 4% that of forest edge (Dlugos et al. Reference Dlugos, Collins, Bartelme and Drenovsky2015). In our 9-ha plot, R. multiflora was more common in the floodplain than in the upland forest (Driscoll et al. Reference Driscoll, Angeli, Gorchov, Jiang, Zhang and Freeman2016). Very few individuals in this forest stand produced fruits, but Driscoll et al. (Reference Driscoll, Angeli, Gorchov, Jiang, Zhang and Freeman2016) found higher density of multistemmed shrubs in recent treefall gaps than in non-gap areas, suggesting gap conditions promote growth.
Microstegium vimineum is very shade tolerant and grows well following canopy, soil, and/or litter disturbances to form dense patches (Warren et al. Reference Warren, Bahn, Kramer, Tang and Bradford2011a). Despite spreading rapidly, populations within its range are often patchy and typically occur along waterways and roadways (Warren et al. Reference Warren, Bahn, Kramer, Tang and Bradford2011a, Reference Warren, Wright and Bradford2011b). While M. vimineum is not dispersal limited along roads and waterways (Christen and Matlack Reference Christen and Matlack2009; Eschtruth and Battles Reference Eschtruth and Battles2009), patchiness of populations within forested areas suggests dispersal limitation, especially in areas of low light and thick leaf litter (Flory et al. Reference Flory, Long and Clay2011; Oswalt and Oswalt Reference Oswalt and Oswalt2007; Warren et al. Reference Warren, Bahn, Kramer, Tang and Bradford2011a, Reference Warren, Wright and Bradford2011b). Seed production correlates with light (Warren et al. Reference Warren, Bahn, Kramer, Tang and Bradford2011a, Reference Warren, Wright and Bradford2011b).
Seed dispersal of the first three focal invasive species is primarily by vertebrates. Birds are the main dispersers of Berberis spp.; however, this has not been directly observed in B. thunbergii (Silander and Klepis Reference Silander and Klepis1999). Rubus phoenicolasius seed dispersal occurs through the feces of birds and mammals, with long-distance dispersal being particularly reliant on birds (Otani Reference Otani2003). Rosa multiflora seeds are dispersed by birds and deer (Amrine and Stasny Reference Amrine and Stasny1993), and the seeds have the potential to lie dormant for up to 20 yr (Amrine Reference Amrine2002). Microstegium vimineum seeds are hypothesized to disperse by water or externally by animals; seeds remain viable in a seedbank for at least 3 yr and germinate readily following soil disturbance (Warren et al. Reference Warren, Bahn, Kramer, Tang and Bradford2011a).
Field Methods
In the 2011/2012 censuses, bare ground cover was assessed and recorded using Daubenmire’s (Reference Daubenmire1959) cover classes. Because the higher cover classes occurred at low frequency, they were consolidated, and we distinguished four cover classes for analyses: 1 (<1%), 2 (1% to 4%), 3 (5% to 9%), and 4 (≥10%).
In both the 2011/2012 and 2014 censuses we censused each 2 by 2 m subplot for the four focal invasives and all other invasive plant species. For M. vimineum, we estimated cover using Daubenmire’s (Reference Daubenmire1959) cover classes (0: 0%; 1: <1%; 2: 1% to 4%; 3: 5% to 9%; 4: 10% to 25%; 5: 26% to 50%; 6: 51% to 75%; 7: 76% to 91%; 8: 92% to 96%; 9: 97% to 99%; 10: >99%). For R. phoenicolasius, R. multiflora, and B. thunbergii we counted the number of ramets in each of three life-history stages: single-stem, multistem sterile, and fertile. This distinction was made because it is representative of relative age, as plants will progress from a single-stemmed plant to multistem, and then become fertile (Ehrenfeld Reference Ehrenfeld1999; Gorchov et al. Reference Gorchov, Thompson, O’Neil, Whigham and Noe2011). Plants were considered distinct individuals (ramets) based on a 10-cm distance between shoots.
In 2014 we also recorded the number of inflorescences for each fertile R. phoenicolasius individual and the number of fruits for each fertile B. thunbergii individual.
Delineating Treefall Gaps
We determined whether each subplot was within a treefall gap based on estimates of canopy heights of the subplot and adjacent subplots. In temperate forests, gaps are considered closed when regeneration exceeds a given height, usually 10 to 20 m (Runkle Reference Runkle1981). We followed the convention of Runkle (Reference Runkle1984), Wright et al. (Reference Wright, Muller-Landau, Condit and Hubbell2003), and King and Antrobus (Reference King and Antrobus2005) in using 10 m as the threshold between gap and non-gap. Each 2 by 2 m subplot was scored in 2011/2012, and again in 2014, as <10 m (1, low canopy) or >10 m (2, high canopy). This was done using the aid of a telescoping pole, which extended up to 8 m. Most subplots were still in the same condition (low or high) in the 2014 census, but some were in new gaps, and others were in areas where gap regeneration had grown taller than 10 m. Because conditions on the forest floor are influenced by the canopy of adjacent areas, not just the canopy directly above, we assigned subplots to be gap or non-gap based on the median canopy class (1 or 2) for the subplot and the eight neighboring subplots. Subplots censused in both years were classified as “persistent gaps” (“gap” in both censuses), “recent gaps” (“non-gap” in 2011/2012 and “gap” in 2014), “closed gaps” (“gap” in 2011/2012 and “non-gap” in 2014), and “non-gap” (“non-gap” in both 2011/2012 and 2014).
Importation into GIS Environment
Data were entered into an Excel spreadsheet (Microsoft 2007) and then imported into ArcMap 10.1 (ESRI 2012). When the Excel spreadsheet was imported into ArcGIS, the subplots were unprojected, as they did not have spatial coordinates. To correct this, the Spatial Adjustment Tool was used to georeference the subplots into subplot centroids.
Distinguishing Recruits of Invasive Species
To determine the relative importance of propagule rain, canopy disturbance, and ground-layer disturbance to recruitment of each species, we had to distinguish recruits from individuals that were already established. We defined recruits as individuals present in 2014 on subplots that were not occupied by and not adjacent to a subplot occupied by the same species in the 2011/2012 census. Because M. vimineum is an annual, all plants present in 2014 are a single cohort of first-year plants, but our criteria distinguished as “recruits” those individuals establishing some distance away from patches that were present in 2011/2012. For the other three species, “recruits” do not comprise a single cohort, but we are confident that they are from seedlings that emerged between 2011 and 2014, and thus from seeds matured in 2013 or earlier. Our spatial criteria ensure that the recruits are derived from dispersed seed, rather than from seeds falling directly from reproducing plants or from vegetative reproduction.
For each of the four focal species, we used an unmatched case-control approach (Song and Chung Reference Song and Chung2010; Suárez et al. Reference Suárez, Pérez, Rivera and Martínez2017) to explore which factors (canopy disturbance, ground-layer disturbance, or seed rain) best explained the presence versus absence of recruits in previously unoccupied subplots. Case-control studies are used in medical research when a condition occurs too infrequently to be adequately sampled in a completely random approach and explore potential causative factors distinguishing individuals with the condition (cases) to a random sample of those without the condition (controls). The case-control approach has been used in some ecological studies (e.g., Gibbons et al. Reference Gibbons, Cunningham and Lindenmayer2008; Wilson and Gibbons Reference Wilson and Gibbons2014). In our study, cases were all subplots that contained recruits, and an equal number of control subplots were randomly selected from subplots that had no individuals of this species in either census and were not adjacent to plots occupied in 2011/2012. The control (unoccupied) subplots were not matched to case (recruit) subplots on any specific criteria, resulting in an unmatched case-control framework for analysis. These two sets (recruit subplots, unoccupied subplots) were grouped into a single file for each species and analyzed by unconditional logistic regression to determine which factors (canopy disturbance, ground-layer disturbance, or seed rain) best explained the presence of recruits in previously unoccupied subplots. We did not carry out statistical tests using the entire data set of about 19,000 subplots, because these were not independent (e.g., nearby subplots would tend to share both invasive plant composition and disturbance conditions due to spatial autocorrelation).
Potential Seed Sources
For the three perennial invasive shrubs, we considered individuals that fruited in either census (2011/2012 or 2014) as potential parents of 2014 recruits. For R. multiflora, only three fruiting individuals were located in the study area in 2011/2012, and none in 2014, suggesting that propagule sources were outside the plot. For each of the other two perennials, R. phoenicolasius and B. thunbergii, the locations of fruiting individuals were highly correlated between the two censuses (see below in Seed Rain section), because the same individual plants often fruit in multiple years. While we did not census for plants that fruited in between the two censuses, we expect these would consist largely of plants that fruited in one or both of those censuses. Because M. vimineum is an annual, subplots that had this species present in the 2011/2012 census were considered to be potential seed sources for the 2014 recruits.
Dispersal Distance Kernels
A dispersal kernel is a probability density function of the location of seed deposition with respect to the propagule source, in which the yield is the probability of a seed landing per unit area as a function of the distance from its source (Nathan and Muller-Landau Reference Nathan and Muller-Landau2000). We do not have locations of dispersed seeds, so for M. vimineum, we fit a dispersal kernel using seed-dispersal distances reported for this species by Tekiela and Barney (Reference Tekiela and Barney2013) using the MASS package in R (R Core Team 2013). For B. thunbergii and R. phoenicolasius, we used locations of 2014 recruits and putative propagule sources to parameterize seed-dispersal kernels. We used the closest-parent method, which assumes that the closest seed source is the parent plant (Nathan and Muller-Landau Reference Nathan and Muller-Landau2000). We used R to determine the Euclidean distance from each recruit to each reproductive conspecific and retained the shortest distance as the parent–offspring distance for a given recruit. For each of these two woody species, we constructed two seed-dispersal distance kernels, one using the locations of conspecifics fruiting in 2011/2012 and the other the locations of those fruiting in 2014. For each of these four data sets, we generated the frequency distribution of the dispersal distances and fit a negative exponential function to this frequency distribution using the MASS package in R (Emsweller Reference Emsweller2015).
Seed Rain
For each focal species, except R. multiflora, we calculated a seed rain index (Eschtruth and Battles Reference Eschtruth and Battles2014) for every row in the data set of recruit subplots and randomly selected unoccupied subplots. This seed rain index estimates the relative number of seeds a subplot would be expected to receive, based on weighted distances to all seed-producing plants in the 9-ha study area, the fecundity of those plants, and seed-dispersal distance. The general formula for the index was:
 $${\rm SR} = \sum {\rm fecundity} * e^{(\minus{\rlambda})\rm distance}$$
where SR is the seed rain index for a subplot, fecundity is the measure of the reproductive output of each seed source, distance is the Euclidean distance between a subplot and that seed source, and λ is the negative exponential parameter from the seed-dispersal kernel. Because some subplots had >1 potential parent, we summed the reproductive output of fruiting plants within the same subplot to calculate that subplot’s fecundity.
For B. thunbergii, we used the number of fertile individuals in the subplot in the 2011/2012 census as the fecundity in SR2012, and the total number of fruits in the subplot as the measure of fecundity for SR2014. In the data set (N=548) SR2012 was highly correlated (r=0.851) with SR2014.
For R. phoenicolasius, the SR2012 fecundity was the number of fertile individuals in the subplot in the 2011/2012 census, whereas for SR2014 we used the total number of infructescences in the subplot as the measure of fecundity. In the data set (N=132) SR2012 was highly correlated with SR2014 (r=0.785).
For M. vimineum, we used the cover class in the subplot in the 2011/2012 census as the measure of fecundity.
Data Analysis
For each species, we carried out an unmatched case-control analysis using unconditional logistic regression (GLM procedure with family=binomial; R Core Team 2016) to identify which predictor variables accounted for the presence of 2014 recruits on previously unoccupied subplots. The response variable was recruits present (1) versus absent (0), and the predictors were: canopy condition in 2014 (1 if gap, 2 if non-gap), bare ground cover class (1, 2, 3, 4), and for three of the species, seed rain index as a measure of propagule rain. Because SR2012 was highly correlated with SR2014 for both B. thunbergii and R. phoenicolasius, we used only SR2014 in the models. Findings were qualitatively similar if we used SR2012. We were unable to include canopy condition in 2011/2012 in these logistic regressions due to the small number of subplots with some combinations of the categorical predictor variables. For the one species for which the logistic regression revealed ground-layer disturbance to be a significant predictor of recruitment, we further tested whether odds of recruitment were greater in each of the three higher cover classes of bare ground versus bare ground cover class 1 (<1% bare ground) using 95% confidence intervals.
Results and Discussion
Invasive Plant Prevalence and Density with Respect to Treefall Gaps
For R. phoenicolasius, both total density and density of fruiting individuals were greater in new gaps (persistent and recent gaps) than in closed gaps or non-gap areas (Table 1; Figure 1). Total density of B. thunbergii was similar across all four canopy conditions, while density of fruiting shrubs tended to be lower in closed gaps (Table 2; Figure 2). The density of R. multiflora was greater in recent gaps than in other areas (Table 3). The frequency of M. vimineum was greater in persistent and recent gaps than in closed gaps or non-gaps (Table 3). We did not score reproduction for M. vimineum in either census, but treated plants present in the 2011/2012 census as potential parents of 2014 recruits. In the 2011/2012 census, most subplots with M. vimineum occurred near the paved road (Figure 3).
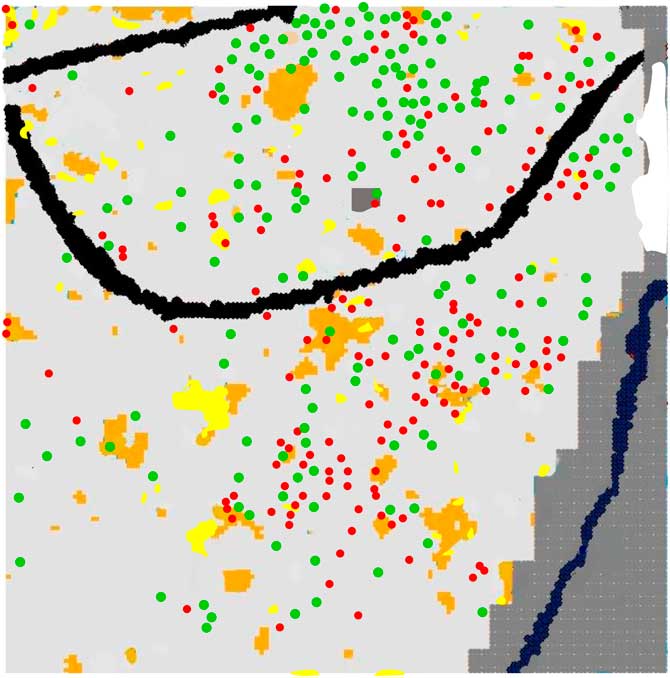
Figure 2 Map of the study area showing subplots with Berberis thunbergii fruiting plants (red) and recruits (green) in 2014. Gap conditions, roads, and areas not censused are color-coded as in Figure 1.
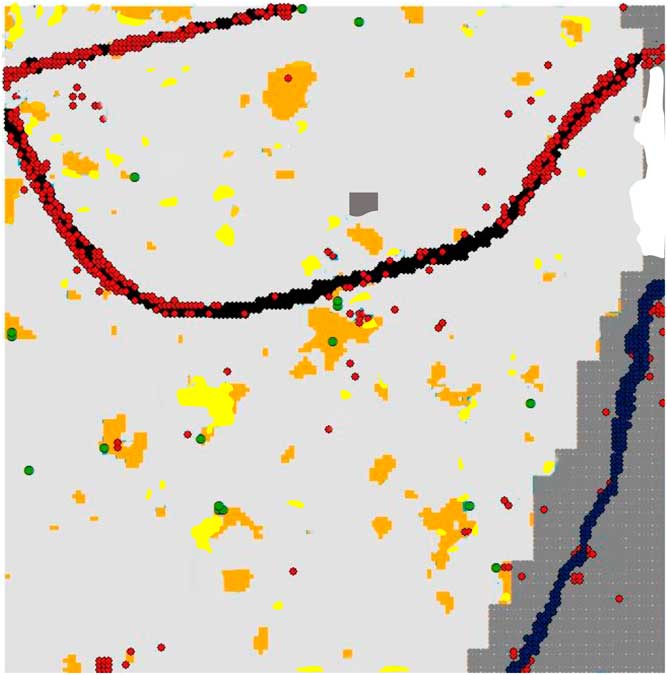
Figure 3 Map of the study area showing subplots with Microstegium vimineum present in 2011/2012 census (red) and 2014 recruits (green). Gap conditions, roads, and areas not censused are color-coded as in Figure 1.
Table 1 Abundance and density of Rubus phoenicolasius in the 2014 census.

a Subplots (2 by 2 m) were assigned canopy categories based on canopy height in the subplot and adjacent subplots in 2011/2012 and 2014 (see “Materials and Methods”). Note that “persistent” and “recent gap” were pooled as “new gap” in logistic regressions.
b Fertile ramets are those that bore fruits.
Table 2 Abundance and density of Berberis thunbergii in the 2014 census.Footnote a
a See Table 1 footnotes for explanations of canopy categories and fertile ramets.
Table 3 Abundance and density of Rosa multiflora and frequency of Microstegium vimineum per subplot in the 2014 census.Footnote a
a See Table 1 footnotes for explanations of canopy categories and fertile ramets.
Recruit Prevalence and Dispersal Kernels
There were a total of 99 R. phoenicolasius recruits (found in a total of 66 subplots; Figure 1), 335 B. thunbergii recruits (274 subplots; Figure 2), and 104 R. multiflora recruits (78 subplots) in 2014. Only 39 subplots had recruits of M. vimineum (Figure 3).
Dispersal kernels were determined for 2014 recruits of R. phoenicolasius and B. thunbergii using the closest-parent method, with fertile (fruiting) individuals considered putative parents, using the negative exponential function (Figure 4; Table 4). The reciprocal of the negative exponential parameter, λ, is the mean dispersal distance. For R. phoenicolasius, the mean dispersal distances were 18.3 m (2011/2012 parents) and 15.4 m (2014 parents). For B. thunbergii, mean parent–offspring distance was 40.0 m based on 2011/2012 fruiting plants and 41.7 m based on 2014 fruiting plants.
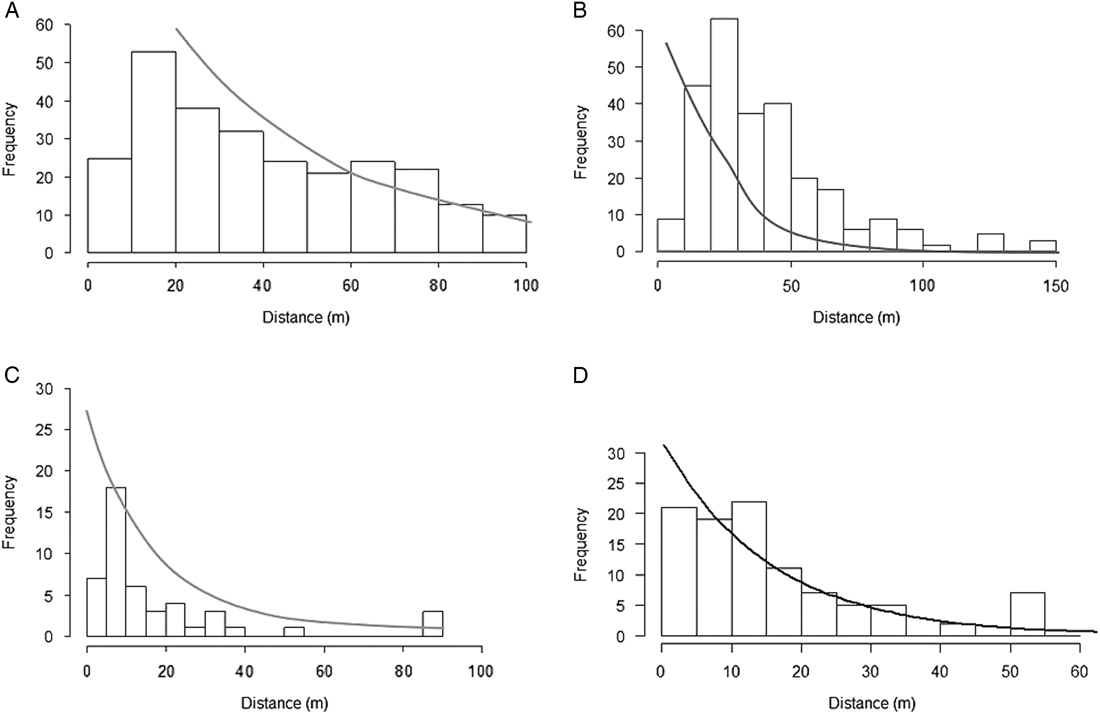
Figure 4 Seed-dispersal kernels for (A and B) Berberis thunbergii and (C and D) Rubus phoenicolasius. Each graph shows the frequency distribution of dispersal distances calculated using the closest-parent method, where “offspring” were the 2014 recruits and the closest parent was the closest fertile ramet in the 2011/2012 census (A and C) or the 2014 census (B and D). The line is the negative exponential function (kernel) fit to the distribution.
Table 4 Negative exponential parameters, λ, of seed-dispersal kernels (Figure 4B and D) using the closest-parent dispersal distances for 2014 recruits of Berberis thunbergii and Rubus phoenicolasius.Footnote a
a For each species, a separate seed-dispersal kernel was constructed using plants fruiting in the 2011/2012 census and plants fruiting in the 2014 census. In each case, λ is in units per meter.
For M. vimineum, the negative exponential parameter, λ, fit to the seed-dispersal distances reported for this species by Tekiela and Barney (Reference Tekiela and Barney2013) was 4.52 m−1, corresponding to a mean dispersal distance of 0.2 m.
Importance of Propagule Rain and Canopy and Ground Disturbance to Recruitment
Rubus phoenicolasius
The logistic regression revealed that the presence of R. phoenicolasius recruits in a subplot was significantly predicted by the seed rain index, SRRubus2014 (Table 5), which integrated the proximity to plants fruiting in 2014 weighted by their number of infructescences. The spatial association of recruits and fruiting plants is apparent (Figure 1). This logistic regression revealed that recruitment was not significantly predicted by previous ground-layer disturbance or current canopy disturbance. However, the density of recruits was higher in persistent gaps than in other canopy-cover categories (Figure 5).
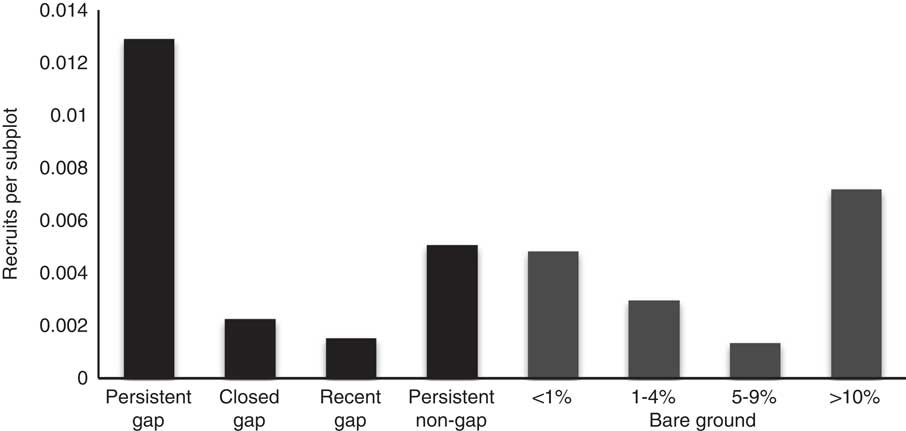
Figure 5 Density of 2014 Rubus phoenicolasius recruits per 2 m by 2 m subplot in the upland forest plot at the Smithsonian Environmental Research Center. Each subplot was assigned a canopy category (black bars) based on canopy height in the subplot and adjacent subplots in 2011/2012 and 2014, and one of four bare ground cover classes (gray bars) based on the 2011/2012 census. Recruits are plants on subplots that were not occupied or were adjacent to occupied subplots in 2011/2012. No error bars are included because subplots are not independent. See “Materials and Methods” for details.
Table 5 Analysis of deviance table for unconditional logistic regression model for recruitment of Rubus phoenicolasius.Footnote a
a N=132 subplots were analyzed, the 66 subplots with 2014 R. phoenicolasius recruits present, and a random draw of 66 subplots without R. phoenicolasius in either census. Response variable was presence of recruits; predictor variables were seed rain (SR) index based on 2014 fruiting R. phoenicolasius, 2011/2012 bare ground cover class, and canopy condition (gap or non-gap). Significant predictors are shown in bold.
b LR Chisq, likelihood ratio chi-square.
Berberis thunbergii
The number of B. thunbergii recruits per subplot was significantly predicted both by the seed rain index, SRBerberis2014, and bare ground, but not by canopy condition (Table 6). The odds of a subplot having recruits was greater where it was exposed to higher propagule rain—more fruiting B. thunbergii ramets in close proximity (Figure 2). Subplots with the highest cover class of bare ground (>10%) were significantly more likely to have recruits than those with <1% bare ground. However, when the density of recruits across all subplots is analyzed, there is no strong pattern with bare ground cover (Figure 6).
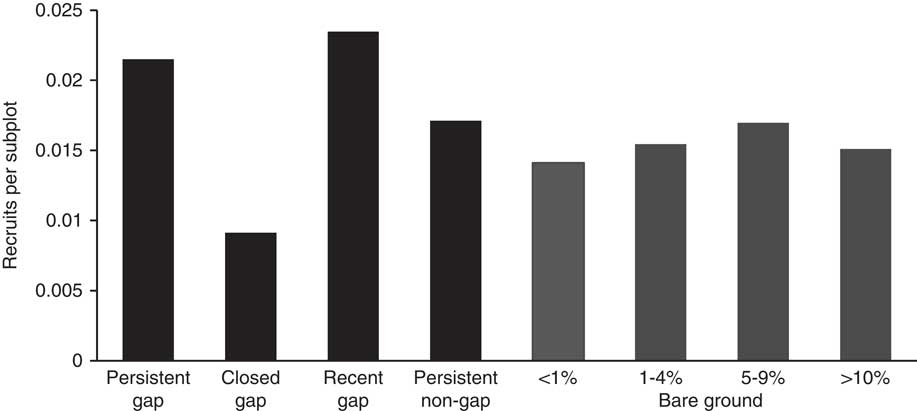
Figure 6 Density of 2014 Berberis thunbergii recruits per 2 m by 2 m subplot in the upland forest plot at the Smithsonian Environmental Research Center. See Figure 5 for criteria for canopy and bare ground categories.
Table 6 Analysis of deviance table for unconditional logistic regression model for recruitment of Berberis thunbergii.Footnote a

a N=548 subplots analyzed: the 274 subplots with 2014 B. thunbergii recruits present and a random draw of 274 subplots without B. thunbergii in either census. Response variable was the presence of B. thunbergii recruits; predictor variables as in Table 5. Significant predictors are shown in bold.
Rosa multiflora
Because there were few fruiting individuals of R. multiflora, no seed rain index was calculated. The odds of a subplot containing a recruit of R. multiflora were significantly associated with canopy condition, but not ground-layer disturbance (Table 7). However, the canopy effect was attributable to a small number of observations; only three subplots in the case-control data set were in new gaps, and each of these included a single recruit. The density of recruits (Figure 7) is very low across all gap categories.
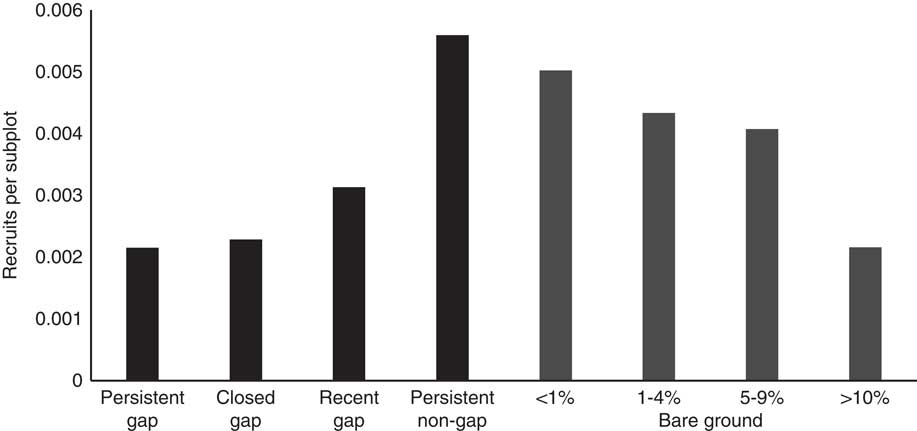
Figure 7 Density of 2014 Rosa multiflora recruits per 2 m by 2 m subplot in the upland forest plot at the Smithsonian Environmental Research Center. See Figure 5 for criteria for canopy and bare ground categories.
Table 7 Analysis of deviance table for unconditional logistic regression model for recruitment of Rosa multiflora.Footnote a
a N=156 subplots analyzed: 78 with 2014 R. multiflora recruits present and a random draw of 78 subplots without R. multiflora in either census. Predictor variables were 2011/2012 bare ground cover class and canopy category (as in Table 5).
Microstegium vimineum
The general linear model revealed that the percent cover of M. vimineum recruits was significant predicted by seed rain index and canopy condition (Table 8); subplots were more likely to contain recruits if they were closer to denser patches from the previous census and in new gaps (Figure 3; Figure 8). Bare ground cover was not a significant predictor of recruitment.
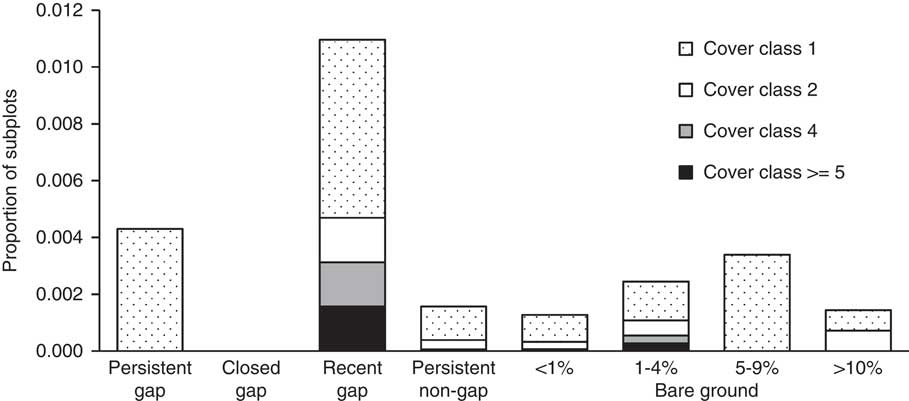
Figure 8 Frequencies of different cover classes (see “Materials and Methods”) of 2014 Microstegium vimineum recruits per 2 m by 2 m subplot in the upland forest plot at the Smithsonian Environmental Research Center. Note that no subplots had M. vimineum recruits occur with cover class 3, and no subplots in “closed gaps” had M. vimineum recruits. See Figure 5 for criteria for canopy and bare ground categories.
Table 8 Analysis of deviance table for unconditional logistic regression model for recruitment of Microstegium vimineum.Footnote a

a N=74 subplots analyzed: 37 with 2014 M. vimineum recruits present and a random draw of 37 subplots without M. vimineum in either census. The response variable was the presence of M. vimineum recruits. Predictor variables were seed rain index based on 2011/2012 subplot occupancy, 2011/2012 bare ground cover class, and canopy category as in Table 5.
Recruitment and Propagule Rain
By completely mapping four invasive plant species throughout the 9-ha upland forest study area, we were able to locate all recruits and test which drivers shape the spread of these populations without use of manipulations. While we found some support for each of the hypothesized drivers of recruitment (propagule rain, canopy disturbance, and ground-level disturbance), propagule rain was the most broadly supported. The seed rain index, which estimates propagule rain of a species in a subplot based on the proximity of fruiting plants, was a significant predictor of recruitment across subplots for B. thunbergii, R. phoenicolasius, and M. vimineum. An earlier study (Eschtruth and Battles Reference Eschtruth and Battles2014) also linked recruitment of M. vimineum to propagule rain, reporting that seedbank germination was strongly correlated with their seed rain index, which was based on the location of plants within a 30-m radius of a plot and an assumed λ=2.01 m−1.
We could not test the propagule rain hypothesis for the fourth species, R. multiflora, because none of the plants within the study area produced fruits in 2014, and only three were sexually reproductive in 2011/2012. Rosa multiflora recruits likely derived from seed dispersed from plants outside the study area, as Dlugos et al. (Reference Dlugos, Collins, Bartelme and Drenovsky2015) found the reproduction is much higher in forest edge than forest interior habitats. However, it is also possible that recruits of R. multiflora were the offspring of shrubs within the plot that fruited when we did not census (e.g., 2013) or in earlier years, as seeds can remain dormant in the seedbank (Amrine Reference Amrine2002). While new R. multiflora ramets do grow from roots and layered branches (Jesse et al. Reference Jesse, Nason, Obrycki and Moloney2010), we excluded such vegetative recruits through our use of a one-subplot (2-m) buffer around subplots occupied in the earlier census. This buffer also prevented us from counting vegetative offspring of B. thunbergii (Ehrenfeld Reference Ehrenfeld1999) and R. phoenicolasius (Gorchov et al. Reference Gorchov, Thompson, O’Neil, Whigham and Noe2011) as recruits. While such vegetative offspring, as well as recruits from seeds that fall beneath parents, do contribute to population growth, their proximity to established plants means that their impact on spatial spread is trivial compared with that of recruits establishing from seeds dispersed away from parents.
Recruitment and Canopy Disturbance
Our hypothesis that canopy disturbance promotes recruitment was supported for M. vimineum and R. multiflora, but not for the other two invasive plant species, although we are reluctant to reject this hypothesis for R. phoenicolasius (see next paragraph). For both M. vimineum and R. multiflora, recruitment was more likely to occur in subplots that were in gaps in 2014. These findings are consistent with earlier studies of these species. Previous studies have documented an association of R. multiflora with more open conditions (Dlugos et al. Reference Dlugos, Collins, Bartelme and Drenovsky2015; Robertson et al. Reference Robertson, Robertson and Tague1994), including at this site (Driscoll et al. Reference Driscoll, Angeli, Gorchov, Jiang, Zhang and Freeman2016), but did not investigate recruitment. Local increase in M. vimineum density was best predicted by a model that included the interaction of canopy disturbance (due to gypsy moth [Lymantria dispar dispar] outbreak) and propagule rain (Eschtruth and Battles Reference Eschtruth and Battles2014). Greater recruitment of this annual grass in recent gaps could be due to higher seedling establishment (Cole and Weltzin Reference Cole and Weltzin2005; Glasgow and Matlack Reference Glasgow and Matlack2007) or to greater fecundity of nearby plants experiencing the higher light a year or two previously. Although the shade tolerance of for M. vimineum is well documented, several studies report higher fecundity in gaps or under higher light (Warren et al. Reference Warren, Bahn, Kramer, Tang and Bradford2011a, Reference Warren, Wright and Bradford2011b).
This phenomenon of greater seed production in gaps highlights an indirect mechanism whereby canopy disturbance promotes recruitment. If canopy gaps increase fecundity of established plants, they will promote recruitment and invasion even if they do not elevate seed germination, seedling establishment, or seedling survival. This is one explanation for the apparent contradiction of the outcome of our logistic regression, which revealed no significant effect of canopy disturbance on R. phoenicolasius recruitment, with our finding of much higher recruit density in persistent gaps, as well as Gorchov et al.’s (Reference Gorchov, Thompson, O’Neil, Whigham and Noe2011) finding that seedling density of R. phoenicolasius in an area that overlapped with our study area was best predicted by canopy conditions; density was much higher in large (>153 m2) gaps than small gaps or non-gap plots. That study did not assess the role of propagule rain, but subplots in gaps should receive more seeds because of their proximity to plants fruiting in these gaps. We found the density of fertile ramets was more than twice as high in 2014 gaps (both recent and persistent gaps) than in areas that were not in gaps in 2014 (closed gaps and non-gaps) (Table 1), and the association of fruiting R. phoenicolasius with treefall gaps was even stronger in earlier years at this site (Driscoll et al. Reference Driscoll, Angeli, Gorchov, Jiang, Zhang and Freeman2016; Gorchov et al. Reference Gorchov, Thompson, O’Neil, Whigham and Noe2011). Furthermore, the number of infructescences per fertile R. phoenicolasius individual was greater in new gaps (Emsweller Reference Emsweller2015). Alternatively, canopy gaps may directly promote establishment of dispersed seeds, but the limited sample size in the logistic regression may have been insufficient to tease apart this canopy effect from propagule rain, since subplots in gaps tended to be near propagule sources.
Canopy gaps probably play a smaller indirect role in the recruitment of B. thunbergii, because fruiting in this shrub is more weakly associated with canopy gaps. Driscoll et al. (Reference Driscoll, Angeli, Gorchov, Jiang, Zhang and Freeman2016) found that the frequency of fruiting ramets of this shrub in 2011/2012 was significantly greater in subplots that were in gap conditions several years earlier (based on a 2004 LIDAR image), but we found no trend for greater density of fruiting ramets in old or new gaps (Table 2), although fruit number per fertile B. thunbergii individual was highest in new gaps (Emsweller Reference Emsweller2015).
This indirect contribution of canopy gaps to invasive recruitment could manifest as elevated seedling recruitment within already occupied gaps and/or in nearby areas under closed canopy. In the latter case, and potentially in the former case, our statistical model will likely incorporate this pattern as an effect of propagule rain (seed rain index), rather than of canopy conditions. The spatial association of gaps and invasion will be further magnified where vegetative reproduction or establishment of undispersed seeds is elevated in gaps. For example, vegetative reproduction due to tip-rooting in R. phoenicolasius is associated with large gaps (Gorchov et al. Reference Gorchov, Thompson, O’Neil, Whigham and Noe2011).
A potential generalization from these four species is that canopy disturbance is important to recruitment of smaller-seeded species. Recruitment of the species with the largest seeds (B. thunbergii, 82 mg seed−1; USDA accessed April 2, 2018) showed no dependence on canopy disturbance, while recruitment of R. multiflora (7.7 mg seed−1; Amirah et al. Reference Amirah, Garneau and McCay2009) and M. vimineum (1.3 mg seed−1; Flory et al. Reference Flory, Long and Clay2011) were dependent, and evidence is mixed for R. phoenicolasius (1.1 mg seed−1; Choi et al. Reference Choi, Ghimire and Lee2016). This is consistent with the general correlation of shade tolerance with seed mass among plant species (e.g., Fenner Reference Fenner1985).
Recruitment and Ground-Layer Disturbance
Our hypothesis that ground-layer disturbance promotes recruitment was only supported for B. thunbergii; location of 2014 recruits was predicted by the percent cover of bare ground 2 to 3 yr earlier. This finding is consistent with Lubell and Brand’s (Reference Lubell and Brand2011) conclusion that the lower seedling emergence of B. thunbergii in pine forest was due to deeper litter.
The lack of a significant effect of bare ground on the recruitment of the other three species was surprising, given the literature. For R. phoenicolasius, seedling survival was higher in areas of shallower leaf litter (Gorchov et al. Reference Gorchov, Thompson, O’Neil, Whigham and Noe2011). Establishment of M. vimineum seedlings was promoted by removal of leaf litter (Warren et al. Reference Warren, Bahn and Bradford2012). It is possible that our single measure of ground-layer disturbance, the cover of bare ground during the 2011/2012 census, was not temporally aligned with an aspect of disturbance that was important to these species. We measured bare ground in summer (late May through July), but seeds of the study species germinate in spring (R. phoenicolasius [Gorchov et al. Reference Gorchov, Thompson, O’Neil, Whigham and Noe2011]; B. thunbergii [Lubell and Brand Reference Lubell and Brand2011]; R. multiflora [Glasgow and Matlack Reference Glasgow and Matlack2007]; M. vimineum [Warren et al. Reference Warren, Wright and Bradford2011b]), when leaf litter is deeper and less bare ground would be exposed. Furthermore, the locations of leaf litter or soil disturbance can change from one year to the next due, for example, to the activities of small mammals. For the annual M. vimineum, leaf litter depth in spring 2014 might be a good predictor of 2014 recruitment, but this was not measured and may not have correlated with bare ground in summer 2011/2012.
Relative Importance of Propagule Rain and Invasibility
Each of the drivers that we investigated (propagule rain, canopy disturbance, and ground-layer disturbance) turned out to be associated with higher recruitment of at least one of the four invasive plant species in this study. However, these species differed in which driver, or combination of drivers, was associated with recruitment and thus population growth and spread. Thus, even within a single forest stand, invasions by different plant species are shaped by different factors. We note, however, that we measured only two aspects (canopy disturbance, ground-layer disturbance) of invasibility, and are not able to assess whether invasibility driven by other factors (e.g., edaphic) was important for each species.
Previous studies that investigated both disturbance and propagule rain generally conclude that propagule rain is important to invasion, but report diverse findings on the role of disturbance. Propagule rain, rather than flooding disturbance, was the best predictor of invasion by nonnatives in a temperate forest (Von Holle and Simberloff Reference Von Holle and Simberloff2005). Similarly, propagule rain, not differences in canopy disturbance, accounted for the greater invasion of M. vimineum and A. petiolata in riparian versus upland forest, while neither accounted for the greater establishment of B. thunbergii in riparian forest (Eschtruth and Battles Reference Eschtruth and Battles2011). Seed rain also promoted the establishment of R. cathartica and an invasive biennial, damesrocket (Hesperis matronalis L.), in a pine plantation in Ontario, as did greater canopy shade; however, canopy light promoted recruitment of other nonnative species (Tanentzap and Bazely Reference Tanentzap and Bazely2009). Whitfield et al. (Reference Whitfield, Lodge, Roth and Reich2014) found that propagule pressure, canopy openness, and bare ground were all significant positive predictors of R. cathartica abundance. Both soil disturbance and propagule rain affected seedling density of the invasive perennial grass, B. sylvaticum (Taylor and Cruzan Reference Taylor and Cruzan2015).
A few studies have investigated the interaction of propagule rain and disturbance and concluded this interaction is most critical to invasion. While deeper leaf litter inhibited germination of M. vimineum, this effect was overwhelmed by seed rain, and both seed germination and seedling survival were correlated with light (Warren et al. Reference Warren, Bahn and Bradford2012). The interaction of gypsy moth canopy defoliation and propagule rain promoted increases in both M. vimineum and A. petiolata (Eschtruth and Battles Reference Eschtruth and Battles2014).
Conclusions
While we did not explicitly test for interactions between propagule rain, canopy disturbance, and ground-layer disturbance in this system, our findings suggest these interactions are important. Ground-layer disturbance is embedded within canopy disturbance in the pits and mounds of uprooted trees, and these sites are ideal for recruitment of invasives such as R. phoenicolasius (Gorchov et al. Reference Gorchov, Thompson, O’Neil, Whigham and Noe2011). Seed rain interacts with canopy disturbance for species that have greater fecundity in canopy gaps to cause recruitment to be spatially associated with gaps, even for species for which establishment is not promoted by gap conditions. This spatial association will be further enhanced if one or more stages of recruitment (germination, seedling establishment, survival) are enhanced where the canopy is disturbed.
Acknowledgments
We thank Julia Mudd and Eva Kinnebrew for extensive assistance with fieldwork; Benjamin Dolan, Robbyn Abbitt, and John Maingi for guidance on GIS; M. Henry H. Stevens for input on statistical analyses; and Alfredo Huerta, M. H. H. Stevens, D. F. Whigham, and two anonymous reviewers for valuable comments on earlier drafts of this article. We also thank the SERC for permission to carry out this research, and the SERC Plant Ecology Lab, particularly Dennis Whigham and Jay O’Neil, for facilitating this research. We thank Nicole Angeli for initiating the database of invasive plant and plot data. Financial support for this research came from Miami University, a SIGEO/CTFS grant to DLG, D. F. Whigham, and M. McCormick, and a Smithsonian Institution internship fellowship (supported by National Science Foundation grant DBI 1156799). No conflicts of interest have been declared.


