Introduction
Glyphosate is the most widely used herbicide globally. Extensive and intensive use of glyphosate, especially since the commercialization of Roundup Ready® crops in the late 1990s (Duke and Powles Reference Duke and Powles2008), has resulted in the evolution of glyphosate resistance in many weed species in the last two decades (Heap 2018). Kochia [Bassia scoparia (L.) A. J. Scott], one of the problematic weeds of the North American Great Plains, has evolved resistance to glyphosate (Heap 2018). The first case of glyphosate-resistant (GR) B. scoparia was reported in southwestern Kansas in 2007 (Heap 2018). About 16 populations of GR B. scoparia across North America have been documented in the last decade (Heap 2018). A recent survey of crop advisors in western Kansas reported the presence of GR B. scoparia in half of surveyed fields at >50% frequency and in almost all fields at some level (Godar Reference Godar2014). Dicamba has been an option to control B. scoparia after the rapid spread of GR B. scoparia in the Great Plains. However, because of repeated use of dicamba to manage this weed, dicamba-resistant (DR) B. scoparia has also evolved and spread in this region. Following the documentation of cases of dicamba resistance in Montana, North Dakota, Idaho, and Colorado in early 1990s (Heap 2018), the incidence of DR B. scoparia has become more common, especially in wheat–fallow fields in Colorado and Kansas (Dille et al. Reference Dille, Stahlman, Du, Geier, Riffel, Currie and Cole2017; Varanasi et al. Reference Varanasi, Godar, Currie, Dille, Thompson, Stahlman and Mithila2015). Interestingly, most of the DR B. scoparia populations are also found to be GR (Brachtenbach Reference Brachtenbach2015).
To manage glyphosate- and dicamba-resistant (GDR) B. scoparia, it is essential to understand the genetic basis of resistance to these herbicides. This information will help in the development of management strategies to minimize or even prevent further selection of higher levels of resistance to these herbicides. Glyphosate resistance in B. scoparia from Kansas was reported to be inherited via a single dominant gene (Jugulam et al. Reference Jugulam, Niehues, Godar, Koo, Danilova, Friebe, Sehgal, Varanasi, Wiersma and Westra2014). In contrast, inheritance of dicamba resistance in B. scoparia most likely is population specific. Preston et al. (Reference Preston, Belles, Westra, Nissen and Ward2009) demonstrated that dicamba resistance in B. scoparia from Colorado is inherited via a single allele with a high degree of dominance. In addition, although no inheritance study was conducted, Cranston et al. (Reference Cranston, Kern, Hackett, Miller, Maxwell and Dyer2001) speculated that dicamba resistance in B. scoparia from Montana is a quantitative trait. The genetic basis of dicamba resistance and the interaction of GR and DR genes in the in B. scoparia from Kansas are unknown. GDR B. scoparia from Kansas provides a unique opportunity to uncover the linkage of GR and DR genes. Therefore, the focus of this research was to investigate the linkage of GR and DR genes in GDR B. scoparia with following objectives: (1) determine the inheritance of glyphosate and dicamba resistance in GDR B. scoparia; and (2) examine the linkage of glyphosate- and dicamba-resistant genes in GDR B. scoparia through genetic analyses of the F1 and F2 progeny of reciprocal crosses of GDR and glyphosate- and dicamba-susceptible (GDS) B. scoparia.
Materials and Methods
All the experiments described here were conducted in a greenhouse attached to the Department of Agronomy, Kansas State University, Manhattan, KS. The greenhouse was maintained at following conditions: 25/20 C (day/night, d/n) temperatures, 60 ± 10% relative humidity, and 15/9-h d/n photoperiod supplemented with 120 μmol m−2 s−1 illumination provided with sodium-vapor lamps. The plants were grown in plastic pots (6.5 by 6.5 by 10 cm) containing commercial potting mixture (Pro-Mix® Ultimate, Hummert International, Topeka, KS, USA). Plants were watered daily and fertilized weekly.
All the herbicide treatments mentioned here were applied using a bench-type sprayer (Research Track Sprayer, De Vries, Hollandale, MN, USA) equipped with a single, even, flat-fan nozzle tip (8002E TeeJet® tip, Spraying Systems, Wheaton, IL, USA) delivering 187 L ha−1 at 207 kPa and moving at 4.85 km h−1. Glyphosate or dicamba were mixed according to the respective labels with recommended adjuvants. At 4 wk after treatment (WAT), plants were visually scored for survival and classified as “survived” (regrowth observed even with some necrotic tissue) and “dead” (necrotic or no regrowth observed even with some green tissue).
Production of GDR and GDS Seeds
In 2012, B. scoparia seeds were collected from a field in Haskell County, KS (37.497°N, 100.781°W). Ten individual plants of B. scoparia were grown from these seeds and self-pollinated by keeping the plants in isolation by covering each plant with a microperforated pollination bag upon flowering. At maturity, the seeds were collected and used to grow 100 seedlings per self-pollinated plant. When plants reached 10- to 12-cm height, half of the plants produced from each self-pollinated plant were treated with a field rate of glyphosate 840 g ae ha−1 (Roundup WeatherMax®, Monsanto, St. Louis, MO, USA, in 2% v/v ammonium sulfate), and the rest were treated with dicamba 560 g ae ha−1 (Clarity®, BASF, Florham Park, NJ, USA). In response to glyphosate or dicamba treatment, all the progeny from a single self-pollinated plant that were found completely killed (susceptible) both of the glyphosate treatment and the dicamba treatment were selected as GDS B. scoparia. The remaining seeds harvested from the same GDS self-pollinated plants were used in all experiments in this research. Likewise, all the progeny of a single self-pollinated plant that survived both of the glyphosate treatment and the dicamba treatment and continued to grow (resistant) were selected as GDR B. scoparia, and the rest of the seeds harvested from the same GDR self-pollinated plant were used in all experiments in this research.
Production of F1 and F2 Bassia scoparia Progeny
Reciprocal crosses of GDR and GDS B. scoparia plants were performed to develop F1 progeny following the method described by Jugulam et al. (Reference Jugulam, Niehues, Godar, Koo, Danilova, Friebe, Sehgal, Varanasi, Wiersma and Westra2014). Briefly, B. scoparia has protogynous flowers with stigma emergence and receptivity occurring 1 wk ahead of the emergence of the stamens of the same flower. Therefore, a few branches were randomly selected before stigma emergence. After all the leaves and apical meristems were removed, the branches were covered with Lawson 217 pollination bags (Seedburo Equipment Company, Des Plaines, IL, USA). Upon emergence of stigma, pollen of dehisced anthers from the selected paternal plant was transferred onto the stigmas using a sterilized brush. Immediately after pollination, the branches were covered with the pollination bags again. The pollination procedure was repeated five times (once per day) to ensure successful fertilization of stigma. To prevent contamination from self-pollination, any new buds that developed on the branches selected for reciprocal crosses were removed daily. The branches were covered with pollination bags for about 8 wk until the seeds were developed and matured. The mature seeds of F1 (GDR × GDS) and F1 (GDS × GDR) reciprocal crosses were harvested separately and stored at 4 C for further studies. Seven F2 progeny were generated by self-pollination of each of four randomly selected F1 (GDR × GDS) and three randomly selected F1 (GDS × GDR) B. scoparia that survived a sequential application of glyphosate 840 g ha−1 followed by dicamba 560 g ha−1.
Dicamba Dose Response to Quantify Dicamba Resistance in GDR Bassia scoparia
The F1 (GDR × GDS) and F1 (GDS × GDR) progeny and GDR and GDS parental B. scoparia were grown in a greenhouse as described earlier. When the seedlings were 10- to 12-cm height, 10 plants from the seed derived from above crosses (F1 progeny) and the parents of B. scoparia were treated with dicamba at 0, 70, 140, 280, 560, 1,120, 2,240, 4,480, and 8,960 g ha−1. At 4 WAT, plants were severed at soil level, and each plant was placed in separate paper bag. Samples were oven-dried at 60 C for 72 h, after which dry biomass was measured. The experiment was conducted in a split-plot design with B. scoparia populations and herbicide doses as main- and subplot factors, respectively, and repeated once.
Response of F1 and F2 Bassia scoparia Progeny to Dicamba and Glyphosate
Seeds of F1 (GDR × GDS), F1 (GDS × GDR), and each F2 progeny and GDR and GDS parental B. scoparia were grown in the greenhouse as described earlier. At 10- to 12-cm height, plants were treated with glyphosate 840 g ha−1 or dicamba 560 g ha−1. Approximately 60 to 150 plants from each group of F1 and F2 progeny were treated with dicamba. About 32 plants from each group of F1 and F2 progeny were treated with glyphosate. At the same time, 16 GDR and GDS plants were also treated with either dicamba or glyphosate for comparison. At 4 WAT, plants were visually scored for survival as mentioned earlier. The experiment was conducted as a randomized complete block design and repeated once.
Response of F1 and F2 Bassia scoparia Progeny to a Sequential Application of Glyphosate followed by Dicamba
Seeds of F1 (GDR × GDS), F1 (GDS × GDR), F2 (GDR × GDS)-1, F2 (GDS × GDR)-1 progeny and GDR and GDS parental B. scoparia were grown in the greenhouse as described earlier. At 10- to 12-cm height, plants were treated with a sequential application: initially with glyphosate 840 g ha−1, followed by dicamba 560 g ha−1 at 30 min after the glyphosate treatment (when droplets from the glyphosate application were completely dried out). The numbers of plants treated at each experimental run were 16, 27 to 40, and 128 for GDR and GDS parents, F1, and F2, respectively. At 4 WAT, plants were visually scored for survival, as described earlier. The experiment was conducted in randomized complete block design and repeated once.
Data Analysis
No interaction between experimental runs was observed; hence, data from the repeated experiments were pooled before analysis. Dry biomass data from the dose–response experiment were subjected to nonlinear regression analysis using four-parameter log-logistic model (Seefeldt et al. Reference Seefeldt, Jensen and Fuerst1995) in R (v. 3.2.1, R Foundation for Statistical Computing, Vienna, Austria) with the drc package (Ritz and Streibig Reference Ritz and Streibig2005).
 $$Y = C + \left( {D - C} \right){\mkern 1mu} /{\mkern 1mu} \left\{ {1 + {\rm{exp}}\left[ {b\left( {{\rm{log}}\left( x \right) - {\rm{log}}\left( {{I_{50}}} \right)} \right)} \right]} \right\}$$
In Equation 1, Y refers to the percentage of untreated control, C and D are the lower and upper limits of the data, respectively, b is the slope, and I 50 is the dose required for 50% response, which was used to estimate GR50 (effective dose for 50% biomass reduction) values from the dry biomass data.
The observed plant survival data from the response of F1 and F2 progeny to dicamba and/or glyphosate experiments were compared with the expected ratio of 3:1 (resistant:susceptible) and subjected to a chi-square (χ2) goodness-of-fit test. The chi-square goodness-of-fit tests for different Mendelian segregation models were conducted using R software (v. 3.2.1).
Results and Discussion
Dicamba Dose Response
The GR50 values of dicamba were estimated as 1,247, 1,066, 1,456, and 180 g ha−1, respectively for F1 (GDR × GDS), F1 (GDS × GDR), GDR, and GDS B. scoparia from the dose–response curves (Figure 1; Table 1). The F1 progeny from the reciprocal crosses were found highly resistant to dicamba, and their GR50 values were similar to the GDR parent (Table 1). Also, relative to GDS B. scoparia, the resistance indices of F1 (GDR × GDS), F1 (GDS × GDR), and GDR, were estimated at 6.9, 5.9, and 8.1, respectively (Figure 1; Table 1), but the resistance indices of the three DR B. scoparia were significantly different from one another (Table 1).
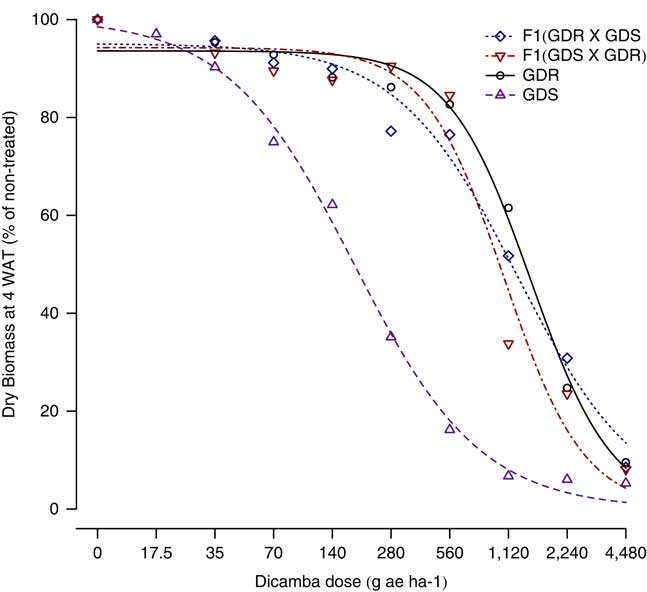
Figure 1 Dicamba dose–response curves of F1 (GDR × GDS), F1 (GDS × GDR), GDR, and GDS Bassia scoparia using the four-parameter log-logistic model: Y = C + (D − C)/{1 + exp[b(log(x) − log(I 50))]}. GDR, glyphosate and dicamba resistant; GDS, glyphosate and dicamba susceptible.
Table 1 Estimated values of GR50 (effective dose for 50% biomass reduction) and the resistance indices for glyphosate- and dicamba-resistant (GDR) and glyphosate- and dicamba-susceptible (GDS) Bassia scoparia populations and F1 (GDR × GDS) and F1 (GDS × GDR) progeny.Footnote a

a The four-parameter log-logistic model was used for estimation: Y = C + (D−C)/{1 + exp[b(log(x)− log(I 50))]}.
b Values are presented as mean value (SE); values followed by different letters are significantly (P < 0.05) different within the column based on Tukey’s HSD.
c Ratio of GR50 of GDR and F1 (GDR × GDS) and F1 (GDS × GDR) B. scoparia to GR50 of GDS population; values followed by different letters are significantly (P <0.05), utilizing Fisher’s tests of significance) different within the column.
Response of F1 and F2 Bassia scoparia Progeny to Dicamba and Glyphosate
At 4 WAT, the GDR, GDS, F1 (GDR × GDS), F1(GDS × GDR), four F2 (GDR × GDS), and three F2 (GDS × GDR) B. scoparia progeny showed the following responses, (1) all plants of GDR and both F1 progeny survived dicamba or glyphosate application, (2) all GDS plants were found dead after dicamba or glyphosate application, and (3) the progeny of seven F2 families behaved similarly with~70% and 30% of plants resistant and susceptible to dicamba or glyphosate, respectively (Tables 2 and 3). The P-values of χ2 tests based on the goodness of fit of 3:1 (DR:DS) ranged from 0.10 to 0.84 (Table 2); whereas for GR:GS, these values were 0.14 to 0.77 (Table 3). Moreover, when all the F2 data were pooled and analyzed, the P-values of the χ2 test complies with a goodness of fit of 3:1 for both dicamba or glyphosate resistance and susceptibility (Tables 2 and 3). These results indicate that the dicamba and glyphosate resistance in this B. scoparia population from Kansas is inherited via a single dominant nuclear gene.
Table 2 Segregation of glyphosate- and dicamba-resistant (GDR) and glyphosate- and dicamba-susceptible (GDS) Bassia scoparia and the F1 and F2 progeny of their reciprocal crosses toward dicamba at 560 g ae ha−1.

a Expected numbers are based on the dicamba resistance in B. scoparia being inherited via a single dominant nuclear allele.
b Probability that the observed number of dicamba-resistant B. scoparia plants was different from the expected number based on the goodness-of-fit test for dicamba resistant:dicamba susceptible = 3:1.
Table 3 Segregation of glyphosate- and dicamba-resistant (GDR) and glyphosate- and dicamba-susceptible (GDS) Bassia scoparia and the F1 and F2 progeny of their reciprocal crosses toward glyphosate at 840 g ae ha−1.
a Expected numbers are based on the glyphosate resistance in B. scoparia being inherited via a single dominant nuclear allele.
b Probability that the observed number of glyphosate-resistant B. scoparia plants was different from the expected number based on the χ2 goodness-of-fit test for glyphosate resistant:glyphosate susceptible = 3:1.
Response of F1 and F2 Bassia scoparia Progeny to Sequential Application of Dicamba and Glyphosate
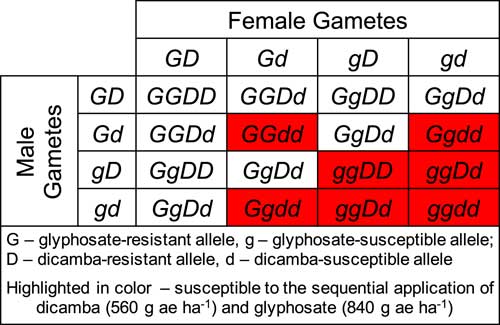
At 4 WAT, all the plants from both F1 progeny and GDR B. scoparia survived the sequential application of glyphosate 840 g ha−1 followed by dicamba 560 g ha−1 (Table 4). The data of F2 progeny were subjected to a χ2 goodness-of-fit test of 9:7 (GDR:GDS), which was the model (Miko Reference Miko2008) used to test the hypothesis that the glyphosate- and dicamba-resistant genes are inherited independently, and these alleles are not linked in B. scoparia (Figure 2). The P-values of the χ2 test were 0.13 and 0.44 for F2 (GDR × GDS) and F2 (GDS × GDR), respectively (Table 4). Similarly, the P-value of the χ2 test analysis of the pooled data of these two F2 families was 0.59 (Table 4). These results support the hypothesis that the glyphosate- and dicamba-resistant genes are inherited independently in this Kansas GDR B. scoparia.
Table 4 Segregation of glyphosate- and dicamba-resistant (GDR) and glyphosate- and dicamba-susceptible (GDS) Bassia scoparia and their F1 and F2 progeny derived from the reciprocal crosses after a sequential application of glyphosate at 840 g ae ha−1 followed by dicamba at 560 g ae ha−1.
a Expected numbers are based on the assumption that the dicamba resistance in B. scoparia is inherited via a single dominant nuclear allele and independent assortment of a single dominant nuclear allele controlling glyphosate resistance.
b Probability that the observed number was different from the expected number of GDR B. scoparia plants based on the χ2 goodness-of-fit test for GDR:GDS = 9:7.

Figure 2 Illustration of the genotypic and phenotypic segregation of glyphosate- and dicamba-resistant genes in F2 progeny of Bassia scoparia, that are independently inherited and controlled by separate single, dominant nuclear genes. The genetic analysis was subjected to a goodness-of-fit test of 9:7 (glyphosate and dicamba resistant:glyphosate and dicamba susceptible) segregation model (Miko Reference Miko2008).
Based on dicamba dose–response results, it was concluded that the dicamba resistance in the Kansas B. scoparia population is a single dominant nuclear trait, because the two dose–response curves of F1 (GDR × GDS) and F1 (GDS × GDR) progeny were similar to the resistant parent, GDR B. scoparia (Figure 1). Furthermore, the response of F2 progeny (>1,000 plants) to a single dose of dicamba (560 g ha−1; Table 2) validated this assessment. However, the GR50 values of both F1 progeny are significantly lower than the GR50 of the GDR population (Table 1), which indicates the dicamba resistance may not be completely dominant. Nonetheless, the higher resistance indices indicate the high levels of dicamba resistance in F1 (GDR × GDS) and F1 (GDS × GDR) progeny, nearly 7 and 6 times more resistant to dicamba than the GDS B. scoparia parent, respectively (Table 1). This suggests a high degree of dominance of the dicamba resistance in this B. scoparia population. Similarly, Preston et al. (Reference Preston, Belles, Westra, Nissen and Ward2009) reported that dicamba resistance in a B. scoparia population from Colorado was inherited via an incomplete dominant nuclear gene, but they did not perform any dose response of dicamba in F1 progeny due to difficulties in producing sufficient F1 progeny from reciprocal crosses. However, they concluded that the dicamba resistance is inherited via a single nuclear gene with high degree of dominance. In another study, Cranston et al. (Reference Cranston, Kern, Hackett, Miller, Maxwell and Dyer2001) speculated that the dicamba resistance in B. scoparia from Montana may be a quantitative trait, but no genetic analyses or inheritance study was conducted in their research.
The inheritance of resistance to synthetic auxin herbicides including dicamba can be complicated and is often species dependent (Jugulam et al. Reference Jugulam, Hall, Johnson, Kelley and Riechers2011; LeClere et al. Reference LeClere, Wu, Westra and Sammons2018). For example, dicamba resistance in wild mustard (Sinapis arvensis L.) is determined by a single completely dominant nuclear gene (Jasieniuk et al. Reference Jasieniuk, Morrison and Brûlé-Babel1995). The genetic analyses of two wild radish (Raphanus raphanistrum L.) populations from Australia revealed that a nuclear inherited incompletely dominant gene confers resistance to 2,4-D (Busi and Powles Reference Busi and Powles2017; Busi et al. Reference Busi, Goggin, Heap, Horak, Jugulam, Masters, Napier, Riar, Satchivi and Torra2017; Goggin et al. Reference Goggin, Cawthray and Powles2016; Jugulam et al. Reference Jugulam, DiMeo, Veldhuis, Walsh and Hall2013). The 2,4-D resistance in prickly lettuce (Lactuca serriola L.) is inherited via a single codominant gene (Riar et al. Reference Riar, Burke, Yenish, Bell and Gill2011), whereas the MCPA resistance in a common hempnettle (Galeopsis tetrahit L.) population is conferred by at least two nuclear genes with additive effects (Weinberg et al. Reference Weinberg, Stephenson, McLean and Hall2006). Interestingly, quinclorac resistance is endowed by a recessive nuclear gene in both yellow starthistle (Centaurea solstitialis L.) (Sabba et al. Reference Sabba, Ray, Lownds and Sterling2003) and false cleavers (Galium spurium L.) (Van Eerd et al. Reference Van Eerd, McLean, Stephenson and Hall2004). Therefore, it is important to realize the inheritance of the resistance to synthetic auxin herbicides, including dicamba, is species and even population specific.
Previous reports indicate that glyphosate resistance in a B. scoparia population from Kansas was inherited via a single dominant nuclear gene (Jugulam et al. Reference Jugulam, Niehues, Godar, Koo, Danilova, Friebe, Sehgal, Varanasi, Wiersma and Westra2014; Niehues Reference Niehues2014). The results of our research also demonstrate that the glyphosate resistance is endowed by a single dominant nuclear gene in the GDR B. scparia population (Table 3). Nuclear inheritance, which facilitates the rapid spread of resistance via both pollen and seed, may be one of the factors producing rapid and widespread occurrence of glyphosate resistance in this region (Godar Reference Godar2014).
The results of this study demonstrate that the glyphosate and dicamba resistances in GDR B. scoparia are not linked (Table 4). Although the resistance to these two herbicides coexist in many B. scoparia populations in Kansas and across the North American Great Plains, such resistance must have been evolved, inherited, and spread independently. Once evolved, the predominance of outcrossing, combined with prolific seed production and the tumbling mechanism of seed dispersal, facilitates the rapid spread and further evolution of herbicide resistance in B. scoparia. One of the major reasons for accelerated development of herbicide resistance in weeds is the long-term repetitive usage of the same mode-of-action herbicides. Glyphosate and dicamba have been effective in managing B. scoparia in western Kansas, but due to lack of diversity in the management tactics, the populations were prone to selection and thus evolved resistance to these herbicides. Another factor that can contribute to the development of herbicide resistance in weeds is exposure to sublethal doses of herbicides (Busi et al. Reference Busi, Neve and Powles2013; Manalil et al. Reference Manalil, Busi, Renton and Powles2011; Neve and Powles Reference Neve and Powles2005) or other environmental factors such as temperature. Efficacies of both dicamba and glyphosate in B. scoparia can be reduced at high temperature (Ou et al. Reference Ou, Stahlman and Jugulam2018a), which can lead to poor control of B. scoparia. In addition, due to an observed antagonistic interaction between glyphosate and dicamba in B. scoparia (Ou et al. Reference Ou, Thompson, Stahlman, Bloedow and Jugulam2018b), the widely adopted practice of tank mixing dicamba and glyphosate to manage B. scoparia may result in poor control of this weed, another potentially important contributing factor for the evolution of GDR B. scoparia in this region. Therefore, to prevent further development of herbicide resistance in B. scoparia, it is key to employ diversified management tools.
In summary, this research demonstrated a single dominant nuclear gene conferring resistance to dicamba and glyphosate in GDR B. scoparia from Kansas. More importantly, the results of this research also revealed for the first time that B. scoparia resistance to these two herbicides is not linked. Although many B. scoparia populations are found to be resistant to both dicamba and glyphosate, this occurrence is not because of the linkage of the resistance genes, but is most likely due to high selection pressure. Consequently, it is essential to use integrated weed management with diversified weed control methods to manage B. scoparia to contain the spread of glyphosate and/or dicamba resistance and to prevent further development of greater resistance to both herbicides.
Acknowledgment
A graduate student assistantship to JO from BASF Corporation is highly appreciated. This is contribution number 18-519-J from the Kansas Agricultural Experiment Station, Kansas State University, Manhattan, KS 66506-5502, USA. This research does not involve any conflict of interest.