


The earliest well-documented archaeological complexes in western North America are Clovis and Folsom, each named after their type sites in New Mexico. Clovis is widespread across the continent and is the older complex (Waters and Stafford Reference Waters and Stafford2007; Waters et al. Reference Waters, Stafford and Carlson2020). Folsom is found mostly in the Great Plains, Rocky Mountains, and parts of the Southwest region and follows Clovis in time (Andrews et al. Reference Andrews, LaBelle and Seebach2008; Buchanan et al. Reference Buchanan, David Kilby, Hamilton, LaBelle, Meyer, Holland-Lulewiscz and Andrews2021; Surovell et al. Reference Surovell, Boyd, Vance Haynes and Hodgins2016). Although the geographic, temporal, and technological circumstances of the Folsom complex strongly suggest that it derives from the Clovis complex (Irwin and Wormington Reference Irwin and Wormington1970; Kelly and Todd Reference Kelly and Todd1988), the Folsom complex displays widespread technological and behavioral departures from the preceding Clovis complex. These changes in the archaeological record suggest a wholesale shift in foraging behavior, technological organization, and landscape use. Such changes are observed in subsistence, technology, and landscape preferences (Amick Reference Amick1994, Reference Amick1996; Andrews et al. Reference Andrews, LaBelle and Seebach2008; Buchanan et al. Reference Buchanan, Andrews, O'Brien and Eren2018, Reference Buchanan, Andrews, David Kilby and Eren2019; Hamilton et al. Reference Hamilton, Buchanan, Huckell, Holliday, Steven Shackley and Hill2013; Hofman Reference Hofman, Stanford and Day1992, Reference Hofman, Clark and Collins2002; Jennings Reference Jennings2012, Reference Jennings2016; Jennings et al. Reference Jennings, Pevny and Dickens2010; Kelly and Todd Reference Kelly and Todd1988; Kilby Reference Kilby2008, Reference Kilby, Smallwood and Jennings2015; Kilby and Huckell Reference Kilby, Huckell, Graf, Ketron and Waters2013).
Despite the documentation of these widespread changes, it is unknown exactly when and how quickly they occurred, and the timing of the Clovis to Folsom transition has been a long-standing question in archaeology (Collard et al. Reference Collard, Buchanan, Hamilton and O'Brien2010; Eighmy and LaBelle Reference Eighmy and LaBelle1996; Haynes Reference Haynes1964, Reference Haynes, Martin and Wright1967, Reference Haynes1969, Reference Haynes1971, Reference Haynes, Martin and Klein1984; Haynes et al. Reference Haynes, Beukens, Jull, Davis, Stanford and Day1992; Holliday Reference Holliday2000; Surovell et al. Reference Surovell, Boyd, Vance Haynes and Hodgins2016; Taylor, Haynes, and Stuiver Reference Taylor, Haynes and Stuiver1996; Taylor, Stuiver, and Haynes Reference Taylor, Stuiver and Haynes1996). Its resolution has been hindered by methodological issues and small sample sizes. Determining the precise timing of the transition will help shed light on the process underlying these behavioral and technological shifts. A temporal hiatus between the two complexes might indicate that the Folsom complex represents a population replacement of landscapes already abandoned by Clovis populations. Such replacements would indicate a population bottleneck, the cause of which could be external, as might be consistent with Clovis extinctions following a catastrophic extraterrestrial comet impact, for example (see Firestone et al. Reference Firestone, West, Kennett, Becker, Bunch, Revay and Schultz2007). However, if the Folsom complex was an innovation that occurred within a Clovis population, we would expect a temporal overlap reflecting the time it took for the new Folsom innovation to be transmitted throughout the Clovis network (Henrich Reference Henrich2001; Rogers Reference Rogers2010).
Our goal in this study is to investigate the nature of the transition from Clovis to Folsom. To do this we take advantage of recent dating of known Clovis and Folsom sites and the reevaluation of their respective age ranges (Buchanan et al. Reference Buchanan, David Kilby, Hamilton, LaBelle, Meyer, Holland-Lulewiscz and Andrews2021; Devièse et al. Reference Devièse, Stafford, Waters, Wathen, Comeskey, Becerra-Valdivia and Higham2018; Waters and Stafford Reference Waters and Stafford2007; Waters et al. Reference Waters, Stafford and Carlson2020). We calibrate our dataset of Clovis and Folsom radiocarbon dates using the newly published IntCal20 calibration curve that uses improved methods and extends tree ring calibration to 13,910 cal BP, thus including the Clovis and Folsom periods under study here (Reimer et al. Reference Reimer, Austin, Bard, Bayliss, Blackwell, Ramsey and Butzin2020). We use Bayesian modeling of the calibrated dates associated with the two phases to infer the temporal boundaries of both complexes and to assess the degree of temporal overlap.
Previous considerations of the Clovis–Folsom transition (Collard et al. Reference Collard, Buchanan, Hamilton and O'Brien2010; Eighmy and LaBelle Reference Eighmy and LaBelle1996; Holliday Reference Holliday2000; Surovell et al. Reference Surovell, Boyd, Vance Haynes and Hodgins2016; Taylor, Haynes, and Stuiver Reference Taylor, Haynes and Stuiver1996; Taylor, Stuiver, and Haynes Reference Taylor, Stuiver and Haynes1996; Waters and Stafford Reference Waters and Stafford2007; Waters et al. Reference Waters, Stafford and Carlson2020) did not explicitly model the error in estimating the starting and ending dates of the respective complexes. Instead, they estimated age ranges by observing the collection of dates from sites identified as either Clovis or Folsom and then determined the degree of overlap based on whether these observed ranges overlapped in time. In contrast, we use Bayesian inference explicitly to model the probability distributions of the temporal boundaries of the end of the Clovis period and the beginning of the Folsom period. That is to say, the age range of a complex in time is a statistical distribution defined by the error of individual dates, the error of the calibration curve, and the sample size of the complex. Parameters of interest (and the statistical errors with which they are measured) can then be estimated from these distributions. The specific parameters we infer here are the respective starting and ending boundaries of the Folsom and Clovis complexes with the appropriate assessment of statistical error (95% credible intervals) within which these parameters can be placed. To do this, we carried out Bayesian modeling of IntCal20 calibrated dates associated with Clovis and Folsom occupations in the West.
Materials and Methods
The Clovis and Folsom radiocarbon ages in our analysis come from published sources that followed “chronological hygiene” procedures established by several researchers (in particular, see Pettitt et al. Reference Pettitt, Davies, Gamble and Richards2003) and are now applied routinely in different spatiotemporal settings (e.g., Fitzpatrick Reference Fitzpatrick2006; Nolan Reference Nolan2012; Taché and Hart Reference Taché and Hart2013). For the Clovis period we include dates from sites in western North America and exclude dated Clovis sites east of the Mississippi River, because the Folsom complex does not extend into far eastern North America and, where it is found east of the Mississippi River, it is undated (Figure 1). The set of Clovis ages we use is primarily from Waters and Stafford's (Reference Waters and Stafford2007) list of credible Clovis ages with and without diagnostics in the western United States. We also include several new radiocarbon age determinations associated with known Clovis sites (Becerra-Valdivia et al. Reference Becerra-Valdivia, Waters, Stafford, Anzick, Comeskey, Devièse and Higham2018; Devièse et al. Reference Devièse, Stafford, Waters, Wathen, Comeskey, Becerra-Valdivia and Higham2018; Mackie et al. Reference Mackie, Surovell, O'Brien, Kelly, Pelton, Vance Haynes and Frison2020). Based on uncertainty and low confidence in contextual integrity, Clovis dates from the recently published El Fin del Mundo site (Sanchez et al. Reference Sanchez, Holliday, Gaines, Arroyo-Cabrales, Martínez-Tagüeña, Kowler, Lange, Hodgins, Mentzer and Sanchez-Morales2014) and Lehner (which was included in Waters and Stafford Reference Waters and Stafford2007) were excluded from this study. Our database includes 41 Clovis dates, of which eight were pooled into two estimates prior to analysis. These eight dates were run on samples from two antler rods (four split samples on each antler rod) recovered from the Anzick site (Becerra-Valdivia et al. Reference Becerra-Valdivia, Waters, Stafford, Anzick, Comeskey, Devièse and Higham2018). All the dates and their references are provided in Supplemental Table 1.
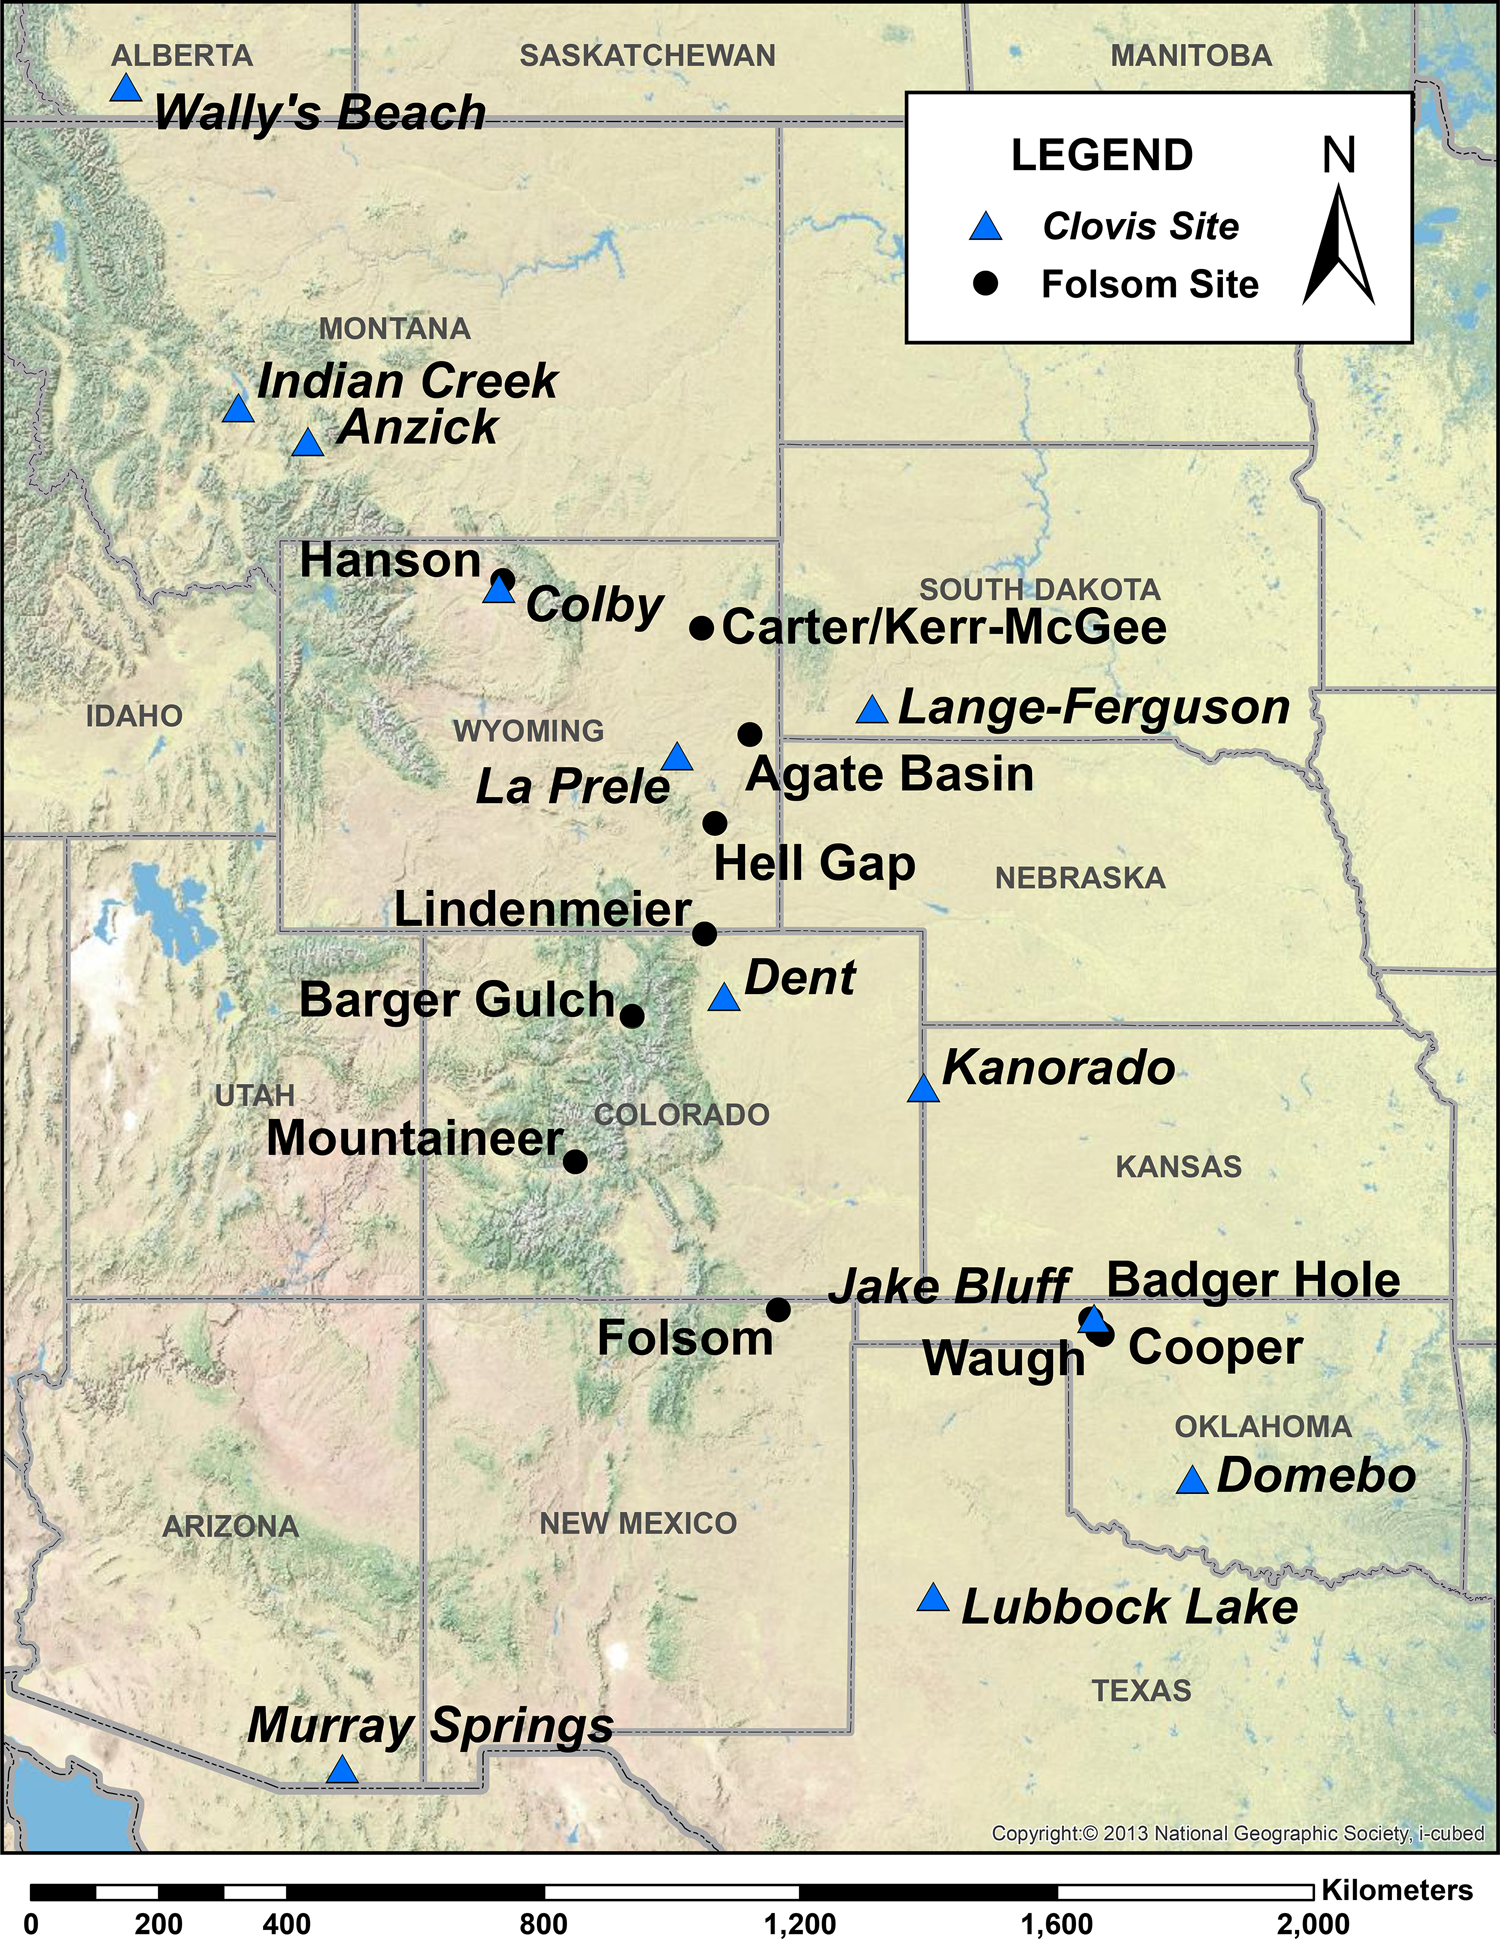
Figure 1. Location of Clovis and Folsom sites analyzed in this study. Blue triangles show the location of sites with Clovis occupations and black-filled circles indicate the location of Folsom occupations.
For Folsom period dates, we incorporate the Folsom radiocarbon record as filtered by Surovell and colleagues (Reference Surovell, Boyd, Vance Haynes and Hodgins2016). They focused on ages derived from pretreated bone samples (using XAD resin chromatographic and ultrafiltration methods [Brown et al. Reference Brown, Earle Nelson, Vogel and Southon1988; Stafford et al. Reference Stafford, Brendel and Duhamel1988, Reference Stafford, Edgar Hare, Currie, Timothy Jull and Donahue1991]) in association with cultural activities and charcoal samples associated with well-defined hearth features. Surovell and colleagues (Reference Surovell, Boyd, Vance Haynes and Hodgins2016:Table 1) identified 12 components at 10 sites with reliable radiocarbon ages. Buchanan and colleagues (Reference Buchanan, David Kilby, Hamilton, LaBelle, Meyer, Holland-Lulewiscz and Andrews2021) added new dates for three components at two Folsom sites, bringing the total to 14 components at 11 sites (Figure 1; Table 1). Components are separate occupations at the same site. Altogether, there are 37 dates from Folsom period contexts.
Table 1. OxCal Modeled Start and End Boundary Ranges for the Clovis and Folsom Sites for 95% Credible Ranges.

Note: For references see Supplemental Table 1 and for the 68% credible ranges see Supplemental Table 2.
Bayesian Modeling of Time Periods
Complexities in the calibration curve characterize the Late Pleistocene in general and the Younger Dryas Chronozone (YDC) in particular (Surovell et al. Reference Surovell, Boyd, Vance Haynes and Hodgins2016; Taylor, Haynes, and Stuiver Reference Taylor, Haynes and Stuiver1996; Taylor, Stuiver, and Haynes Reference Taylor, Stuiver and Haynes1996). Use of the Bayesian method (Bronk Ramsey Reference Bronk Ramsey2009a) compensates for the increase in uncertainty of calibrated radiocarbon dates caused by erratic departures (wiggles) in the calibration curve (Kutschera et al. Reference Kutschera, Steier, Weninger and Wild2007). Bayesian modeling explicitly considers the error not only with which each date is sampled but also the error involved in estimating the starting and ending dates of the Clovis and Folsom age ranges. This is a particularly important source of statistical error because the sample size of high-quality radiocarbon dates for both complexes is small. As such, the best estimates for the start of Folsom and end of Clovis are not simply the oldest and youngest dated samples, respectively. The boundary ranges produced are parameters—that is, probability distributions—estimated from the entire distributions of dates and errors available. Indeed, within a Bayesian interpretive framework, start and end ranges, as well as spans/durations, for phenomena can be statistically and probabilistically inferred, as opposed to traditional methods of visual assessment. For the sake of space, we refrain here from offering explicit definitions for many of the specific terms associated with Bayesian chronological modeling and the OxCal software. We provide full modeling procedures, methods, and terminology in Supplemental Text 1 (for additional background on the method, theory, terminology, and procedures of the Bayesian analysis of radiocarbon data, see Bayliss Reference Bayliss2009; Bronk Ramsey Reference Bronk Ramsey2009a, Reference Bronk Ramsey2009b; Buck et al. Reference Buck, Cavanagh and Litton1996; Hamilton and Krus Reference Hamilton and Krus2018; Lulewicz Reference Lulewicz2018; Whittle et al. Reference Whittle, Healy and Bayliss2011).
For the analyses presented here, we used OxCal 4.4.2 (Bronk Ramsey Reference Bronk Ramsey2009a) accessed via the online server of the Oxford Radiocarbon Accelerator Unit (ORAU), using the IntCal20 atmospheric calibration curve (Reimer et al. Reference Reimer, Austin, Bard, Bayliss, Blackwell, Ramsey and Butzin2020). In-depth explanations of the primary model and all alternative models, as well as the OxCal code for all primary and alternative models, can be found in Supplemental Text 1. We first grouped all dates into individual phases that correspond to individual sites. All Clovis site-phases were grouped into a single overarching Clovis phase to estimate the start and end boundaries for the regional Clovis tradition. The same procedures were applied to model the age boundaries for the regional Folsom tradition. Following common procedures, we present modeled ages and ranges in italics. Trapezium boundaries were used to model the starts and ends of the Clovis and Folsom traditions. The trapezium method assumes that, at the beginnings and ends of phases, dated samples will be rarer than from the temporal center of the phenomenon in question (Lee and Bronk Ramsey Reference Lee and Ramsey2012). Additionally, through time, the number of dates will ultimately increase, plateau, and then decrease again toward the end of a phase. This method of estimating boundaries is appropriate when modeling regional technological traditions that come into use, exhibit a peak temporal range of use, and then fall out of use. Such methods of boundary estimation are consistent with recent efforts to model cultural phenomena (e.g., Barrier Reference Barrier2017; Buchanan et al. Reference Buchanan, David Kilby, Hamilton, LaBelle, Meyer, Holland-Lulewiscz and Andrews2021; Manning et al. Reference Manning, Birch, Conger, Dee, Griggs and Hadden2019; Quinn et al. Reference Quinn, Ciugudean, Bălan and Hodgins2020). The temporal overlap between Clovis and Folsom traditions was estimated using the “difference()” command in OxCal to determine the length of overlap between the Clovis end boundary and the Folsom start boundary.
We constructed a series of six alternative models to assess the sensitivity of our model parameters and choices. They were used to assess the effects of different boundary estimation methods and of potential outliers on model results. Across all different methods of model construction, the results were either completely unchanged or varied by just a few decades. Alternative Models A–D follow the same modeling procedures described earlier, with slightly altered parameters (e.g., outlier modeling, boundary selection, and phase grouping). Alternative Models E and F, however, use a completely different procedure. For these two models, all individual sites were modeled separately from one another (as opposed to being grouped together by either Clovis or Folsom affiliation). For Clovis sites, individual end boundaries for each site were modeled and then included together in a phase that consists only of Clovis site end boundaries. This “phase of boundaries” was used to estimate the end of the Clovis regional tradition. The same methods were applied to the start boundaries of Folsom sites. This method is consistent with other attempts to model regional phenomena (e.g., Becerra-Valdivia and Higham Reference Becerra-Valdivia and Higham2020; Higham et al. Reference Higham, Douka, Wood, Ramsey, Brock, Basell and Camps2014; Whittle et al. Reference Whittle, Healy and Bayliss2011), but it is best suited for cases with much larger sample sizes of dates and much more complex internal stratigraphic relationships within multicomponent sites. Given our relatively limited sample size (some sites had just a single date) and the single-component nature of our sites with little internal stratigraphic information to employ as priors, our more simplified primary model is justified and more appropriate.
Results
Modeling the age ranges for both the Clovis and Folsom complexes in the North American West shows that Clovis lasted 690 years (with a 95% credible range of 500–870 years), which is about two centuries longer than Folsom (Figure 2A), whereas the Folsom tradition lasted 460 years (Figure 2B; 95% credible range of 320–670 years). To investigate the overlap between the Clovis and Folsom complexes we estimated boundary ages of the calibrated dates for the end of Clovis and the start of Folsom (Table 1 and Figure 3; the resulting boundary distributions for each site included in this study are shown in Supplemental Text 1). Figure 3 shows that the modeled ages for the end of Clovis at several sites clearly overlap with a number of Folsom sites. Figure 4A shows the estimated age ±95% range for the initial appearance of Folsom in the archaeological record: 12,900–12,740 cal BP (results for 68% credible ranges are provided in Supplemental Table 3). The posterior distribution (shaded red) represents the 95% credible interval of the estimated age range for the terminal appearance of Clovis in the archaeological record: 12,720–12,490 cal BP (Figure 4A, top panel). The bottom panel of Figure 4A shows the summed probability distributions for both Clovis (in red) and Folsom (blue) dates.

Figure 2. Modeled spans for Clovis and Folsom complexes: (A) posterior distribution of the estimated span of Clovis in red; (B) posterior distribution of the estimated span of Folsom in blue.

Figure 3. Modeled boundary ages for Clovis and Folsom sites. The OxCal modeled end boundary distributions for each Clovis site in our analysis are shown in red, and the modeled start boundary distributions for each Folsom site in our analysis are shown in blue. Short brackets under each posterior distribution show the 68% credible range, and the longer brackets show the 95% credible range. The highlighted distributions are the overall modeled end for the Clovis complex (red) and the overall modeled start for the Folsom complex (blue).

Figure 4. Modeled temporal overlap between Clovis and Folsom: (A) upper panel shows the modeled posterior distributions for the estimates of the end boundary for Clovis (in red) and the start of Folsom (in blue); the lower panel shows the overlapping summed probability distributions of the modeled ages for each complex. The shaded area represents the Younger Dryas Chronozone, whereas the vertical line represents the final disappearance of the Late Pleistocene megafauna; (B) the modeled posterior distribution of the estimated period of overlap between Clovis and Folsom showing that Folsom first appears about 200 years before Clovis finally disappears (although this ranges between 80 and 400 years at the 95% credibility interval).
Clearly, available dates from the Folsom sites support a probable occurrence before the last appearance of Clovis in western North America. Results of the Bayesian analyses provide strong support for this overlap (Amodel = 97.6 and Aoverall = 97.1; see Supplemental Table 3). The overlap between the two complexes is estimated to range between 80 years and 400 years (at the 95% credibility interval), with a median overlap of 210 years. As such, our results show that the Clovis complex ceased to be deposited in the archaeological record over a period of ~200 years, or about eight generations (assuming a human generation time of 25 years) after Folsom first appeared in western North America (Figure 4B). The error in the data suggests a maximum of ~400 years or 16 generations (see Supplemental Table 4).
Importantly, the amount of overlap evident in Figures 3 and 4 indicates that the results we show here are not driven by any single sample or any one site, but that this temporal overlap is a general property of the entire distributions of radiocarbon samples. Future dating of Clovis and Folsom components and sites may further reduce the width of the error ranges around the estimates of the initial Folsom and terminal Clovis. However, although the precision of these boundary estimates will only increase with new dates, the overlap of the Folsom and Clovis complexes will remain unless future research shows that the sample of dates currently available is somehow statistically biased and therefore is a nonrandom sample of the timing of early Paleoindian complexes in western North America.
Discussion
We find a temporal overlap of the Clovis and Folsom complexes in western North America of ~200 years or about eight generations: thus, the Bayesian analysis of available data indicates that the Folsom complex likely first appeared in western North America several generations before the Clovis complex is last observed in the archaeological record. Because this sequence results from the temporal overlap of many individual dates and sites in the sample, it is highly unlikely that additional dates and sites in the future will change this overall pattern significantly. Recent dates from the Barger Gulch site are the earliest Folsom dates on record thus far (Buchanan et al. Reference Buchanan, David Kilby, Hamilton, LaBelle, Meyer, Holland-Lulewiscz and Andrews2021), and clearly any earlier Folsom dates will only extend the potential period of overlap, as would new younger Clovis dates. Given the relatively small sample sizes of reliable dates, the range for potential overlap between the two traditions is broad, at ~400 years. Therefore, any additional dates in the future will have the primary effect of reducing this error range and the potential span of overlap. Although the range of potential overlap will become more precise, new dates are unlikely to reverse this sequence. Significantly, the data in Figures 3 and 4 show that the earliest appearances of both the Clovis and Folsom complexes in the archaeological record seem much less well defined than their latest appearances. Consequently, it is reasonable to assume that future dating of the early Paleoindian record in western North America will continue to improve our estimates of the earliest stages of the Clovis and Folsom complexes.
The temporal overlap we show here falsifies the hypothesis of a hiatus between the two complexes; Figure 4 shows both demographic continuity between Clovis and Folsom and a remarkable amount of overlap in the dated components of individual sites. These results differ from previous studies that argued for little or no overlap between Clovis and Folsom. Holliday (Reference Holliday2000) and Surovell and colleagues’ (Reference Surovell, Boyd, Vance Haynes and Hodgins2016) analyses showed a temporal hiatus between Clovis and Folsom, whereas the results of Taylor, Haynes, and Stuiver (Reference Taylor, Haynes and Stuiver1996) and Waters and colleagues (Reference Waters, Stafford and Carlson2020) indicated little to no overlap between the two periods. The one exception is the study by Collard and colleagues (Reference Collard, Buchanan, Hamilton and O'Brien2010), which indicated a longer period of overlap. However, the appearance of a longer temporal overlap found by Collard and coworkers was driven by a dated component of the Hell Gap site, which has since been redated and is now considered younger (Surovell et al. Reference Surovell, Boyd, Vance Haynes and Hodgins2016) and likely in the range of ~12,600–12,450 cal BP (Pelton et al. Reference Pelton, Kornfeld, Larson and Minckley2017, Reference Pelton, Kornfeld, Minckley and Larson2018). Thus, by definition, Folsom first appears in western North America embedded within a Clovis population, through which it spreads over several generations, eventually reaching fixation by about 12,600–12,650 cal BP (Figure 4).
The pattern of innovation, diffusion, and replacement of Clovis by Folsom through time in Figure 4A is consistent with a diffusion-like transition process during which a successful innovation begins to replace an extant technology and eventually goes to fixation in a population after some period of transmission (Henrich Reference Henrich2001; Rogers Reference Rogers2010). In Figure 4A, the shaded area of overlap between the two distributions begins about 12,800 cal BP as Folsom starts to replace Clovis and reaches fixation about 12,600 cal BP when Clovis is fully replaced. However, while the lack of a hiatus between the complexes indicates demographic continuity, these data cannot be used to determine whether the mechanism of the Folsom diffusion through the archaeological record of western North America was the result of a demic expansion, in which local populations carrying the new Folsom complex outcompeted populations using the older Clovis, or instead an informational expansion—where the new innovation of Folsom technology spread as an idea through stable Clovis populations. Of course, transitions in the archaeological record are commonly a combination of both processes. However, this transition coincides with the onset of the YDC at ~12,850 ca lBP (gray-shaded area in Figure 4A; Steffensen et al. Reference Steffensen, Andersen, Bigler, Clausen, Dahl-Jensen, Fischer and Goto-Azuma2008) and the final disappearance of the Late Pleistocene megafauna ~12,700 cal BP (the vertical line in Figure 4A). Specifically, the boundary estimates in the upper panel of Figure 4A show that the initial appearance of Folsom follows closely on the heels of the onset of the YDC and that the posterior distribution of the end boundary of Clovis peaks with the estimated last appearance of the megafauna in the archaeological record. We should also note that because Folsom appears in the archaeological record before the last appearance of megafauna, it is possible that future archaeological discoveries might reveal evidence of Folsom hunting or scavenging extinct megafauna.
If we assume archaeological complexes are the material residue of adaptive strategies or knowledge systems (Renn Reference Renn2020), and given the clear historical relationship between the Folsom and Clovis complexes, then Folsom might best be thought of as a reconfiguration of Clovis knowledge. Further, if we assume that adaptive strategies are optimal solutions to local environments given certain constraints, then a transition in adaptive strategy implies either an intentional search for a new optimal solution or the chance discovery of a new optimal solution. Therefore, one possibility is that the spread of the Folsom complex was the result of a random innovation that either drifted to fixation in the population or, by chance, found a new local optimum and therefore became a more effective adaptive strategy that outcompeted the preexisting Clovis strategy. However, because the Folsom complex seems to be a large-scale reconfiguration of many behaviors and technologies, it would seem unlikely that a random innovation led to a complete reconfiguration of the Clovis lifestyle. Alternatively, Folsom may represent the spread (either demographic or informatic) of a newly designed adaptive strategy that was engineered within a particular subgroup of the larger Clovis population and spread because it was more effective—but was not associated with any external stimulus such as environmental change. If this were the case, the risk of adopting a new adaptive strategy that had been successful for hundreds of years must have been worth the cost, implying that either the Clovis adaptation was becoming less effective than it once was and thus vulnerable to competition or that it never was a particularly effective adaptive strategy, which seems unlikely given its longevity and broad distribution across the North American continent. It is likely that external factors played a role in the new adaptive strategy; the leading candidates for those factors include the beginning of the YDC, the decline of megafauna, and the shift to a single dominant large-prey animal, the bison, across large portions of the West.
Whatever the role of environmental change in the Clovis–Folsom transition, the lack of a demographic hiatus indicates there was demographic continuity. Therefore, by definition, the Folsom complex represents innovations made by Clovis people within a preexisting non-Folsom population. We should also note here that this finding provides further refutation of the extraterrestrial comet impact hypothesis of Firestone and colleagues (Reference Firestone, West, Kennett, Becker, Bunch, Revay and Schultz2007). The temporal overlap we identify here appears to have occurred across a large geographic region. The oldest Folsom sites are in Colorado and Wyoming (see also Buchanan et al. Reference Buchanan, David Kilby, Hamilton, LaBelle, Meyer, Holland-Lulewiscz and Andrews2021), whereas the youngest Clovis sites are in Wyoming, Arizona, and Oklahoma. This suggests that when Folsom first appeared on the central and northern Plains, Clovis was still persisting across large portions of the Plains and Southwest. However, because of its limited size, the available data do not have enough statistical power to pinpoint the likely geographic origin of the Folsom complex with any greater precision. Another point to consider is that the Clovis–Folsom transition took place within the geographic range that came to be Folsom territory. This range is smaller than that of Clovis (perhaps 25%–35% of its range), again occurring primarily within the modern Great Plains, Rocky Mountains, and parts of the Southwest. Other areas of North America, such as the Great Lakes and the Southeast, underwent different transitions (e.g., Clovis to Cumberland in Tennessee [Tune Reference Tune2016] and Clovis to a wider diversity of forms in the greater Southeast [Smallwood et al. Reference Smallwood, Jennings, Pevny and Anderson2019]) and perhaps for different reasons. We argue here that Folsom was associated with perceived adaptive advantages related to tool design, mobility, and hunting strategies—in terms of both prey type and the likely approach to hunting. In other regions the transition from Clovis to different complexes likely occurred for different reasons.
Because of the nature of the archaeological record, we can only observe the Clovis–Folsom transition with a relatively coarse-grained level of detail (Kolodny et al. Reference Kolodny, Creanza and Feldman2015; Perreault Reference Perreault2019). We cannot see the ethnographic details or the history of the “Folsom innovation” without finer-grained, larger datasets of reliably dated occupations and artifact assemblages. It could be the case that the innovations that came to be recognized as the Folsom complex were a collection of local innovations that spread as a single package through an intact population, or perhaps they were several independent innovations that quickly converged. It could also be the case that populations implementing the new Folsom complex pushed out, replaced, assimilated, or converted local Clovis populations. We suggest that because many of these behavioral and technological traits are not independent, it is most likely that the Folsom complex spread as a package or lifestyle, whether as a demic or informatic expansion. As is well known to Paleoindian specialists, Folsom material has never been found stratigraphically below Clovis in a multicomponent Paleoindian site. Though the sample is relatively small—there are only seven sites where Clovis and Folsom have been found stratified with Clovis below Folsom: Lubbock Lake, Blackwater Draw, Gault, Debra L. Friedkin, Jake Bluff, Carter/Kerr-McGee, and Powars II—it is not trivial. The probability of this being a random sequence is highly unlikely (p = 0.57 = 0.008). Of course, if both complexes co-occurred at the same time on the same landscapes at the same sites, a stratigraphic reversal at some sites is entirely possible. Yet, the low probability of this stratigraphic sequence suggests that Folsom was a successful innovation with a high transmission rate; once the new innovation (the Folsom suite of technology and behavior or the population that carried it) appeared in a region, it quickly became established, replacing the Clovis complex throughout western North America.
Acknowledgments
This work was partially funded by a University of Tulsa Faculty Research Grant. We would like to thank Todd J. Briere for producing Figure 1, Michael Whalen for translating the abstract, and Bruce Huckell, Thomas Jennings, Vance Holliday, and an anonymous reviewer for comments that greatly improved this article.
Data Availability Statement
All data and code are available in the main text and the supplemental materials.
Supplemental Material
For supplemental material accompanying this article, visit https://doi.org/10.1017/aaq.2021.153.
Supplemental Text 1. Description of Bayesian models and associated OxCal code.
Supplemental Table 1. Reliable Clovis and Folsom Dates Used in the Analyses.
Supplemental Table 2. OxCal Calibrated and Modeled Age Ranges for Reliable Clovis and Folsom Dates.
Supplemental Table 3. Oxcal Modeled Age Ranges for the Clovis and Folsom Temporal Start, End, and Span.
Supplemental Table 4. Oxcal Modeled End Boundary Ranges for the Clovis and Folsom Sites for Both 68% and 95% Credible Ranges.


