NOMENCLATURE
- AR
aspect ratio
- EGT
exhaust gas temperature
- SFC
specific fuel consumption
1.0 INTRODUCTION
In an aircraft propulsion engine, the exhaust nozzle determines the final engine thrust by producing a very high-velocity exhaust gas jet. An infrared signal (IR signal) is generated by the high-temperature and high-velocity gas flow emitted from the engine exhaust nozzle. This signal is a major factor to determine the mission and survivability of an aircraft( Reference Ball 1 ), since portable IR seeker missiles equipped with modern IR detectors have remained a continuous threat to the survivability of aircraft. Mahulikar( Reference Mahulikar, Sonawane and Rao 2 , Reference Mahulikar, Rao and Kolhe 3 ) has analysed the main source of infrared signals from the aircraft and it has been found out that wavelength band for high-temperature exhaust gas is 3–5 μm, while for low-temperature exhaust gas is 8–12 μm. The infrared properties are highly dependent on the engine operating conditions and the exhaust gas characteristics of the aircraft propulsion systems. Thompson et al.( Reference Mahulikar, Rao, Sane and Marathe 4 , Reference Thompson and Birk 5 ) conducted a study to reduce the infrared signal generated from the exhaust gas. And Decher( Reference Decher 6 ) analysed the characteristics of the infrared signal according to the shape of the nozzle. Recently, An et al.( Reference An, Kang, Baek, Myong, Kim and Choi 7 ) analysed the effects of S-shaped nozzle configurations of a UAV on plume IR signatures with the aim of reducing IR signature levels significantly. In this study, the thermal flow fields were analysed using a compressible Navier–Stokes–Fourier code CFD-FASTRAN( 8 ). Moreover, plume IR signatures were calculated by the narrow band model developed by Grosshandler( Reference Grosshandler 9 ) and Mahulikar et al.( Reference Mahulikar, Rao, Sane and Marathe 4 ). It was shown that although both of aspect ratio and curvature of nozzles contributed to the reduction of the temperature in the plumes, the aspect ratio turned out to play a more critical role in reducing the size of high-temperature core plumes.
Using the numerical analysis, many researchers have extensively studied how to reduce IR signal intensity from an aircraft engine. Infrared signal can be reduced through nozzle design modifications to enhance mixing of the exhaust plume with the surrounding ambient air. However, there are limited numbers of discussions regarding the relationship between the characteristics of the infrared signal and nozzle configurations of the turbojet engine. For these reasons, it is necessary to carry out a detailed experimental study on the performance and characteristics of the infrared signals from the engine exhaust nozzle by changing the nozzle’s shape. But an experimental research by using full-scale real engine is very difficult and require a large amount of the investment. It is, therefore, more reasonable to investigate the infrared signal using a micro-turbojet engine with a fuel similar to that used in a real engine. The thrust produced by the micro-turbojet engine is less than 50 lbf class which can be operated easily in a laboratory.
This paper presents an experimental study of the effect of nozzle configurations to a baseline convergent nozzle on infrared signal of the micro-gas turbine engine. Also, infrared signal reduction effects with nozzle configurations are explained by the detailed plume temperature distributions which are measured by traversing temperature rakes.
2.0 METHOD
2.1 Micro-turbojet engine and exhaust nozzle
A micro-turbojet engine from Netherlands AMT is used in this study. The basic specifications of the micro-turbojet engine are as follows (Table 1).
Table 1 Micro-turbojet engine specifications

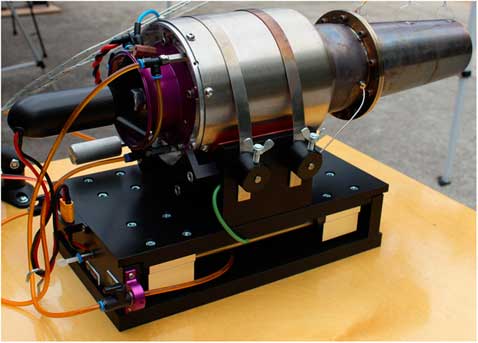
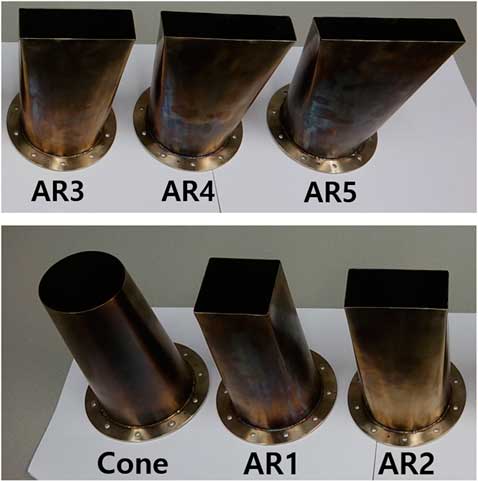
A mixture of kerosene and Aero shell 500 lubricant (4.5%) is used as the engine fuel. Initially, the engine is started by an electric motor. Then the fuel is ignited by using a glow plug. After the engine start-up, the electric motor is disengaged from the engine. The fuel to the engine is supplied by two different fuel pumps, one pump for initial ignition and another pump acts as a main fuel pump after the flame in the combustor is self-sustained. The engine operations are controlled by an Engine Control Unit (ECU). To examine the effect due to different nozzle shapes, the inlet of a nozzle is cut in and a flange is modified for attaching various different shaped nozzles as shown in Fig. 1. A cone-type nozzle and five rectangle type nozzles used for the experiment are shown in Figs 2 and 3, respectively. The baseline cone nozzle exit area is 3,137.07 mm2 and the maximum area deviation with the square nozzle is within 1.22%.

Figure 1 (Colour online) AMT Olympus micro-turbojet engine.
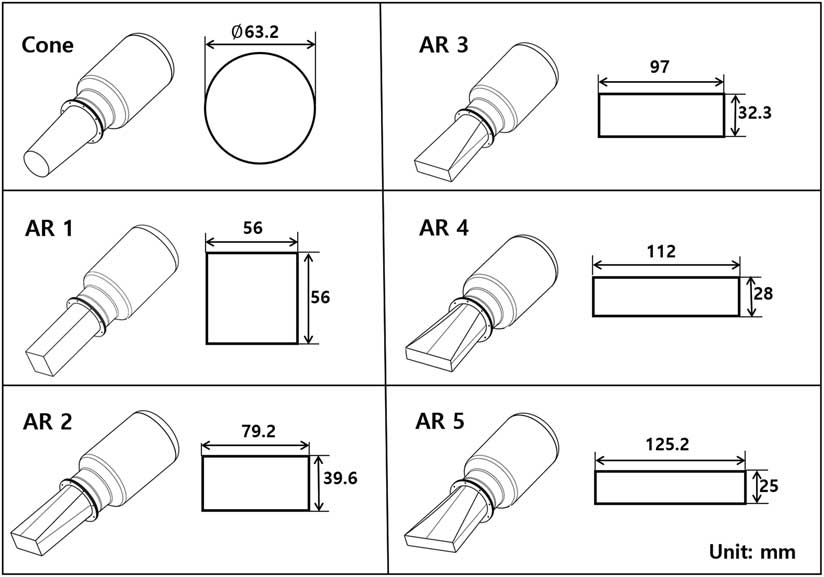
Figure 2 Schematic diagram of nozzle variants.

Figure 3 (Colour online) Picture of manufactured nozzles.
2.2 Test bed and experimental conditions
A schematic diagram of the engine control and infrared signal measuring device is shown in Fig. 4. The engine thrust is measured by a load cell (MLP-200, Transducer Technique) and has a measurement error less than 0.06% at full-scale operating range and the maximum measurable value is 200lbf. Fuel mass flow rate is measured by a turbine flow metre (OCX00-10-X, Orbit Control), measurement error is about 1% and the measurement is possible up to 10 bar. Engine rpm is measured by an rpm sensor located in the impeller blade. The exhaust gas temperature is measured by a thermocouple located at the turbine outlet. The engine throttle adjustment is possible and can be either done manually or using a preset operating schedule programme in a control computer. Engine operating condition data are transmitted simultaneously to the engine data terminal (EDT) and the computer.

Figure 4 Schematic diagrams of the engine control and infrared signal measurement.
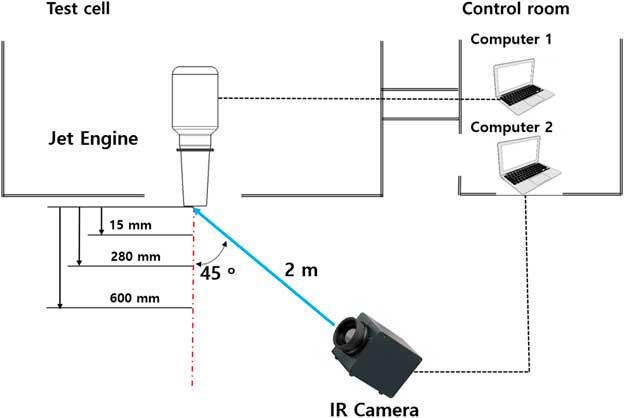
Figure 5 shows the layout of the engine test and IR measurement position. Infrared signal emitted from the engine is measured by an infrared thermography camera (Variocam hr head, JENOPTIK). The temperature measurement range of the device is −40 to 1200°C and the wavelength measurement is 7.5–14 μm. This device is capable of measuring only irradiance and not measuring radiance or spectral radiance. The unit of irradiance which is the radiant flux received by a surface per unit area is the watt per square metre (W/m2). The measurement position is fixed at a 45° angle from the centre position of the nozzle exit and 2 m away from the engine nozzle exit plane.
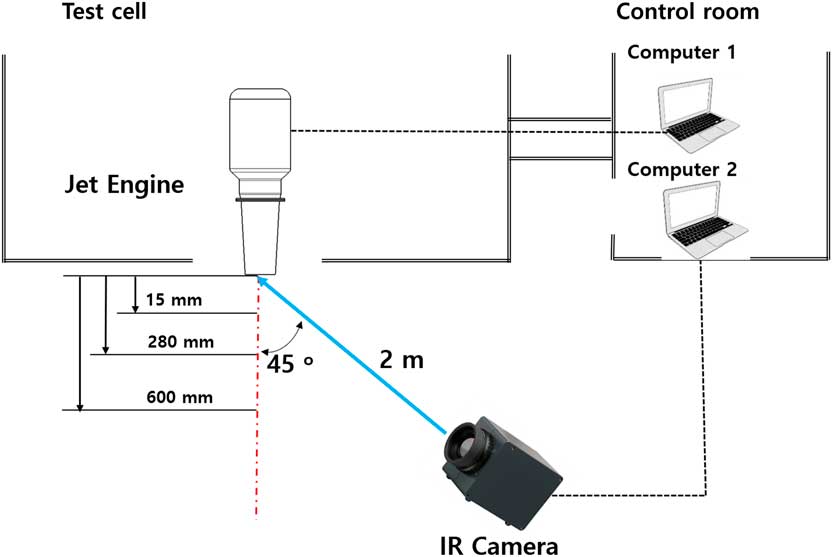
Figure 5 (Colour online) Layout of the engine test and IR measurement.
In order to measure the spatial temperature distribution of the engine exhaust plume in detail, a system capable of measuring the temperature while moving in the x–y direction is used. Figure 6 shows a schematic diagram of the x–y moving temperature measurement system. The main components of x–y traverse mechanism include a computer with PCI card, a motor drive device (UMI-7764), two step drivers and two stepping motors. The UMI-7764 motion drive makes the mechanism to operate in two axes, while step driver accepts the pulse signal from the computer and transfers it to the stepping motor allowing it to operate. The stepping motor is connected to a ball screw. When the motor operated, the ball screw rotates and moves the slider to the measurement position. The slider can move 0.02 mm per each motor step. Sixteen K-Type thermocouples are arranged at 20 mm intervals. The temperature standard deviation of 16 thermocouples is 0.67°C and the precision temperature interval of each thermocouple at 95% confidence level is ±1.32°C. The thermocouple is moved to the co-ordinate position set in the Labview programme with 10 mm distance in the x–y direction by two step motors. After the temperature is measured for 5 s, the thermocouple moves to the next measurement position. Data are recorded using a data processing device (CRIO-9075, National Instruments, Inc.). Temperature measurements were performed at 53×59 positions at 10 mm intervals.
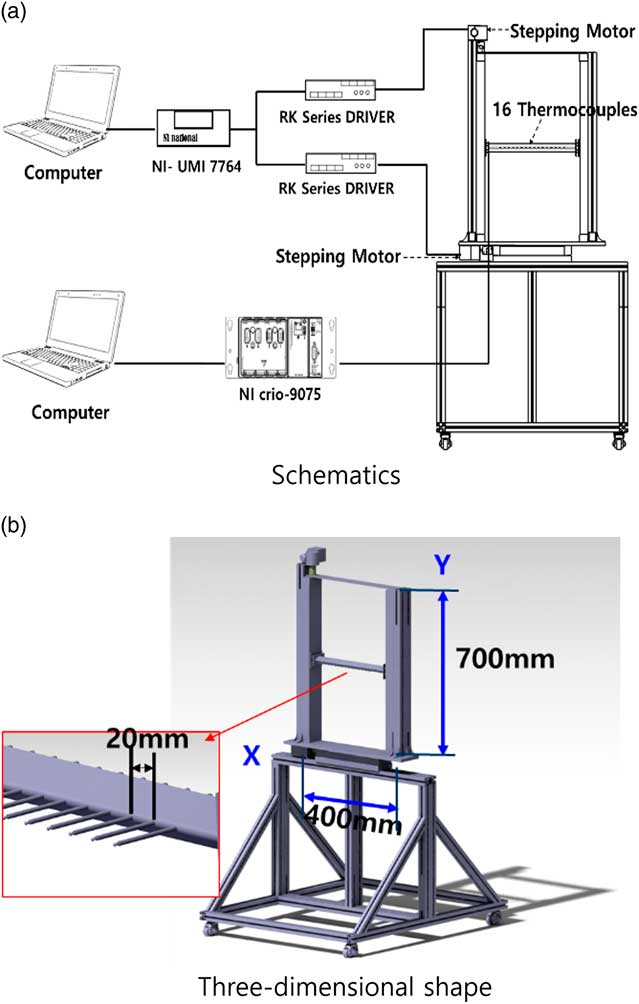
Figure 6 (Colour online) Schematics of the x–y traverse temperature measuring system.
The engine test was carried out for 161 seconds. After the engine is ignited, the engine undergoes an idle state where the throttle is 0%, then the throttle is increased to 100% for 20 seconds, then the throttle is reduced 10% step for every 10 seconds until the throttle reaches zero percentage (idle state). Air temperature, pressure and humidity were recorded and used to correct the engine performance.
3.0 RESULTS AND DISCUSSION
3.1 Engine performance
The engine performance is corrected to the standard atmospheric temperature and pressure. The correction formula for temperature and pressure is as follows (Walsh et al.(
Reference Walsh and Fletcher
10
)). Temperature ratio (
 ${\rm \rtheta }$
) and pressure ratio (
${\rm \rtheta }$
) and pressure ratio (
 ${\rm \rdelta}$
) are given by Equation (1) and
${\rm \rdelta}$
) are given by Equation (1) and
 $T_{{\rm std }} $
is 288.15 K and
$T_{{\rm std }} $
is 288.15 K and
 $P_{{\rm std}} $
is 101,325Pa. The corrected rotational speed (
$P_{{\rm std}} $
is 101,325Pa. The corrected rotational speed (
 $N_{{\rm corr}} $
) is calculated by Equation (2), the corrected thrust (
$N_{{\rm corr}} $
) is calculated by Equation (2), the corrected thrust (
 $F_{{\rm corr}} $
) is given by Equation (3), the corrected SFC (
$F_{{\rm corr}} $
) is given by Equation (3), the corrected SFC (
 ${\rm SFC}_{{\rm corr}} $
) is given by Equation (4)
${\rm SFC}_{{\rm corr}} $
) is given by Equation (4)
 $${\rm {\rtheta }}{\equals}{T \over {T_{\rm {std}} }} , \quad {\rm{\rdelta}} {\equals} {P \over {P_{\rm {std}}}}$$
 $$\hskip6.5ptN_{\rm{corr}} {\equals} {N \over {\sqrt {\rm{\theta}} }}$$
 $$F_{\rm {corr}} {\equals} {F \over {\rm{\rdelta}} }$$
 $${\rm{SFC}}_{\rm{corr}} {\equals} {{\rm{SFC}} \over {\sqrt {\rm{\theta}} }}$$
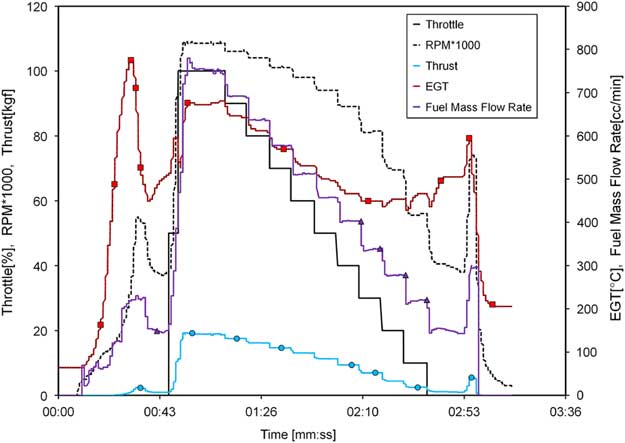
The characteristics of the engine equipped with the cone type exhaust nozzle are shown in Fig. 7. At the engine start, a large amount of fuel for ignition is used, for this reason, exhaust gas temperature is very high during the initial startup period. Thereafter, in the normal operation period, the values like rotational speed, the exhaust gas temperature, the fuel flow rate, the thrust, etc. are controlled by the throttle input value. At engine shutdown, the exhaust gas temperature is sharply increased because of a momentary abnormal operating condition of the main fuel pump which in turn increases the fuel flow rate.
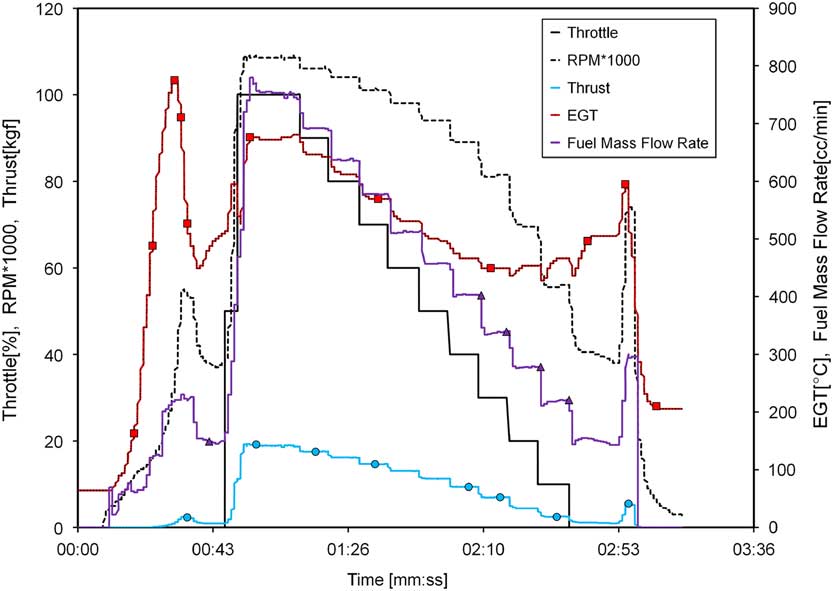
Figure 7 (Colour online) Engine operating characteristics with time.
Figure 8 shows the variation of corrected thrust with corrected rotational speed for each nozzle configuration. When compared to the cone nozzle, at 95% RPM, the AR3 nozzle thrust reduces to a maximum of 4.26%, while AR4 nozzle thrust increases by 1.54%. Compared with the cone nozzle, the thrust decreased with exception of AR4.
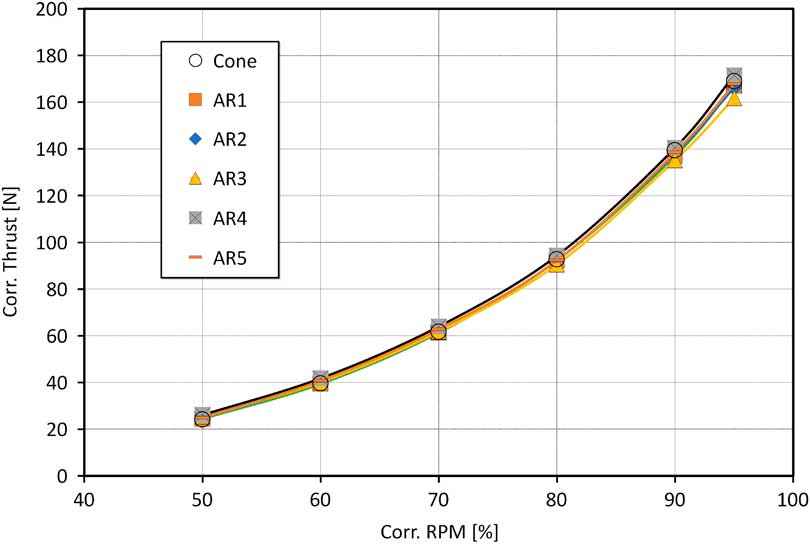
Figure 8 (Colour online) Engine corrected thrust with corrected rpm.
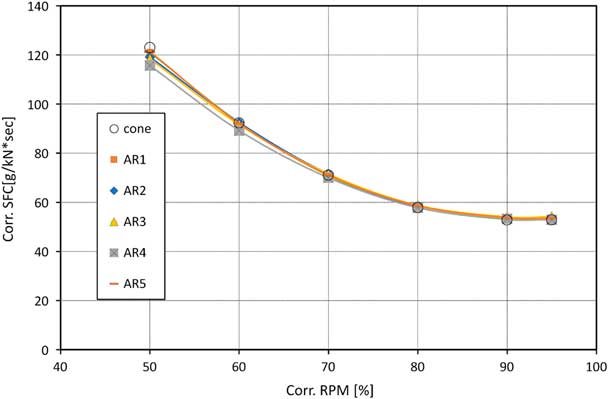
Figure 9 shows corrected SFC variations with nozzle configurations. Significant differences are visible at lower RPM, but these differences diminish as the RPM increases. Only in case of AR3 at 95% RPM, the SFC value is increased to 2.65% when compared to the cone type nozzle. However, SFC increases of 0.18% and 1.32% were measured for AR4 and AR5 cases, respectively. Therefore, the change of SFC according to the aspect ratio of the nozzle compared with the baseline cone type nozzle was within about 2.65%. Dix et al.( Reference Dix, Saddington, Knowles and Richardson 11 ) conducted performance tests on convergent nozzles with various notches. They used a jet engine with a 150 N thrust at 103,500 rpm. Experimental results show that the similar thrust can be obtained within the error range of various shape convergent nozzles which is almost similar to the results in this study.
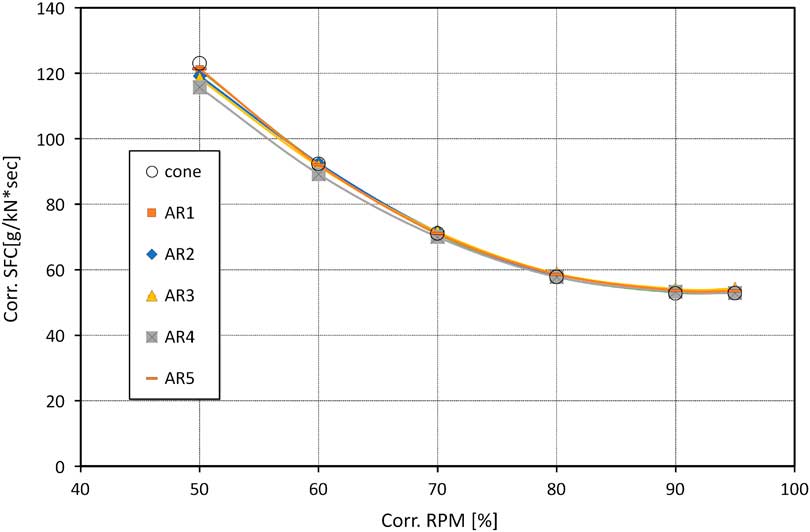
Figure 9 (Colour online) Engine-specific fuel consumption with corrected rpm.
3.2 Infrared signal
Figure 10 shows the irradiance image for the cone nozzle. Infrared signals of the plume were obtained from the nozzle exit plane at 15 mm (R4), 280 mm (R5) and 600 mm (R6). The IR and temperature distribution of the plume were measured with the engine exhaust gas temperature maintained about 550°C.
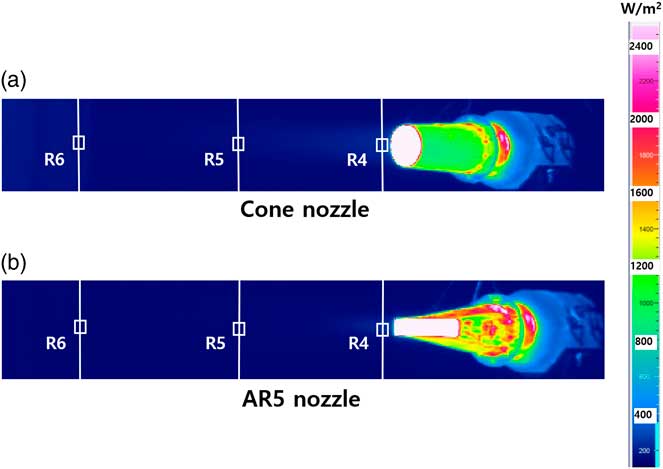
Figure 10 (Colour online) Infrared irradiance images of cone and AR5 nozzle.
Figure 11 shows the irradiance and gas temperature emitted from the plume at each measurement position according to the nozzle shape. At the 15 mm position near the nozzle, the irradiance value is almost constant regardless of the shape of the nozzle, and the gas temperature is maintained at an almost constant value. However, at a distance of 280 mm, the irradiance value sharply decreases as compared to the value at the 15 mm position, and the decrease rate increases as the aspect ratio changes from 1 to 5. Irradiance was reduced by about 19% for cone nozzles and 27% for AR5 nozzles. The temperature of the plume gas was also greatly reduced, and the temperature was reduced by 22% for the cone nozzle and by 61% for the AR5 nozzle. For a 600 mm position away from the nozzle, the irradiance is reduced but the reduction rate is small compared with 280 mm case. The comparison of the infrared signal and the gas temperature according to the nozzle shape at the same position from the nozzle outlet is as follows. At 280 mm at the nozzle outlet, the gas temperature was reduced by 50% in the case of AR5 compared to the cone nozzle, and the irradiance was reduced by 14%. At 600 mm at the nozzle outlet, the gas temperature was reduced by 40% in the case of AR5 compared to the cone nozzle, and the irradiance was reduced by 10%.
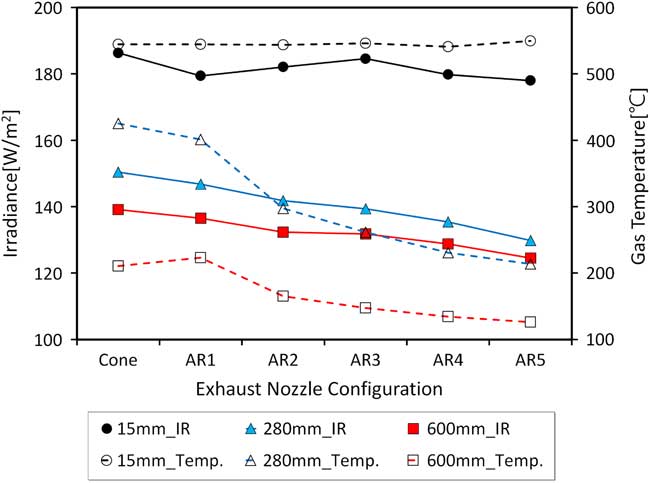
Figure 11 (Colour online) Infrared irradiance and plume gas temperature with nozzle configuration.
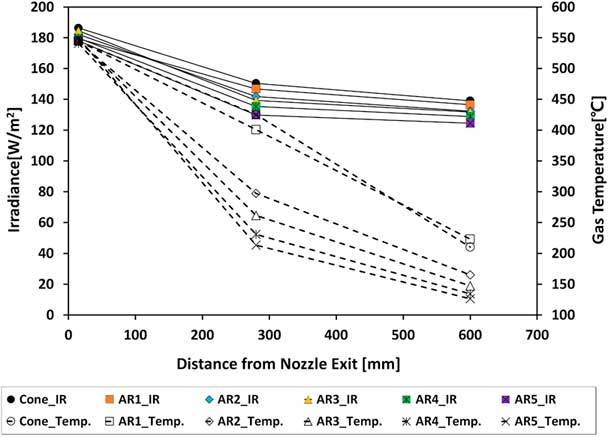
Figure 12 shows the irradiance and gas temperature emitted from the plume with distance from nozzle exit plane. From this result, it can be seen that the gas temperature decreases linearly with the distance from the nozzle, and the irradiance decreases accordingly. Also, it can be seen that the larger the aspect ratio, the more the temperature of plume gas is decreased.
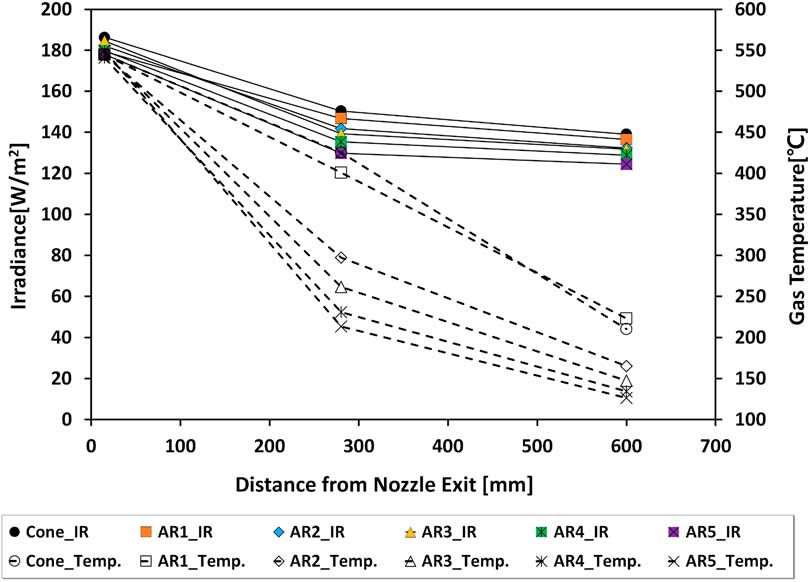
Figure 12 (Colour online) Infrared irradiance and plume gas temperature with distance from nozzle exit.
3.3 Plume gas temperature distribution
The magnitude of the infrared signal has a direct correlation with the temperature of the plume gas. As the aspect ratio increased, the plume gas temperature decreased sharply. Therefore, it is very important to know how the plume gas is spatially distributed. Figure 13 shows plume gas spatial temperature distribution with nozzle configuration. In the case of the cone nozzle, the temperature distribution of the circular shape is shown. Even if the distance from the nozzle is increased the shape of the circular remained and the high temperature of the centre is maintained. However, in the case of AR5, the shape of the plume gas is almost rectangular, and the temperature of the gas is drastically lowered at 280 mm, and the region of 200°C is hardly visible at 600 mm. This can be seen more clearly in the three-dimensional temperature distribution of Fig. 14. In the case of the cone nozzle, it can be seen that the high-temperature core region of the centre proceeds far away, but in the case of AR5, the high-temperature core portion dissipates the energy faster and the temperature spreads to the surroundings.
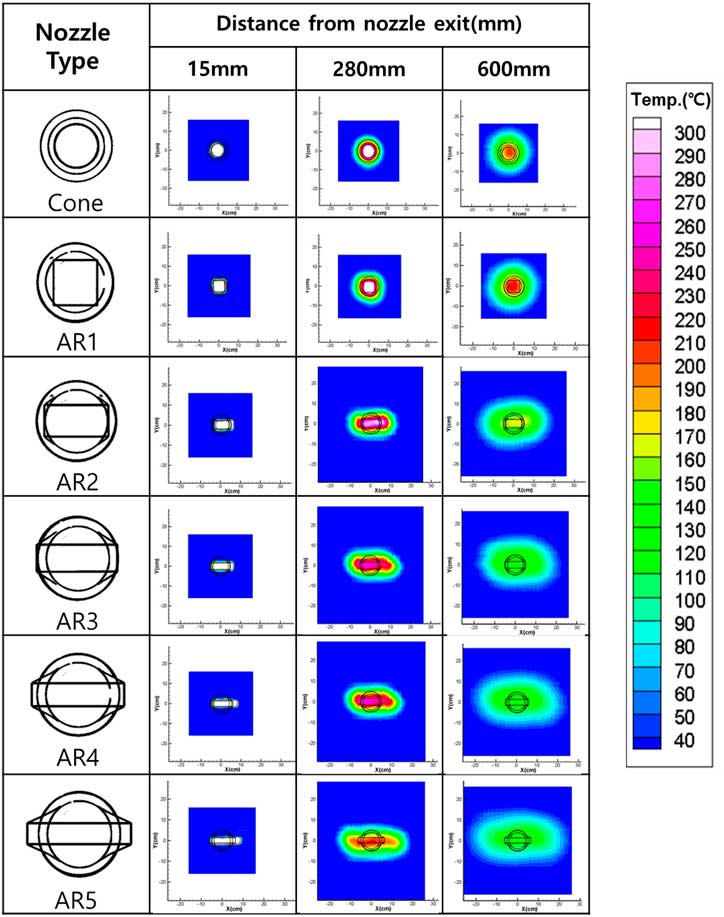
Figure 13 (Colour online) Plume gas spatial temperature distribution with nozzle configuration.
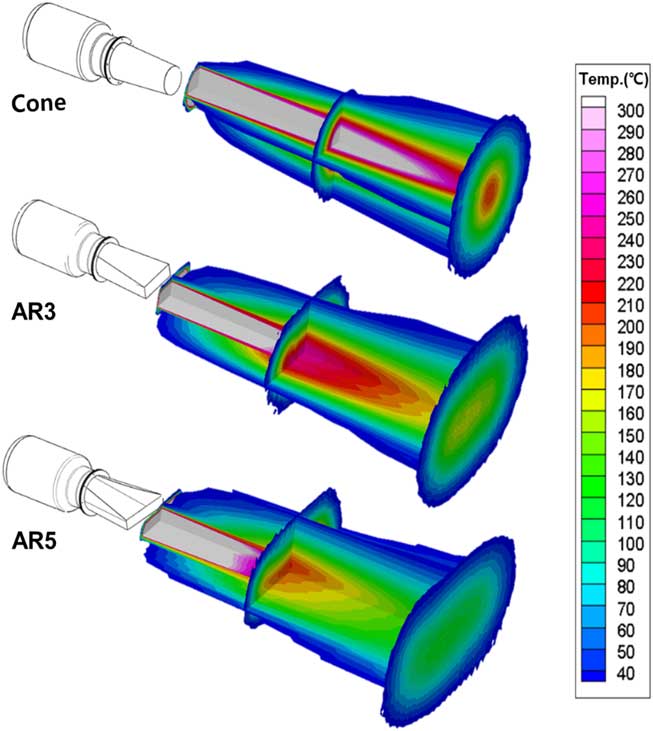
Figure 14 (Colour online) Plume gas 3D spatial temperature distribution with nozzle configuration.
Figure 15 shows the average temperature in the measured region above 40°C at each location of the plume gas and the area of which occupied above 40°C at this point. In this graph, it can be seen that the average temperature decreases as the plume gas area increases from the nozzle exit. Also, it can be seen that the larger the aspect ratio, the larger the plume gas area.
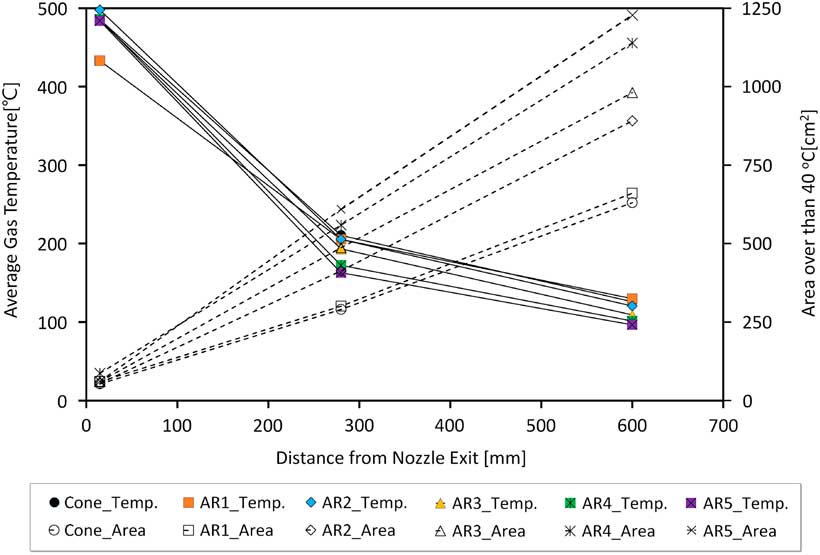
Figure 15 (Colour online) Plume gas average temperature with exceeding 40°C.
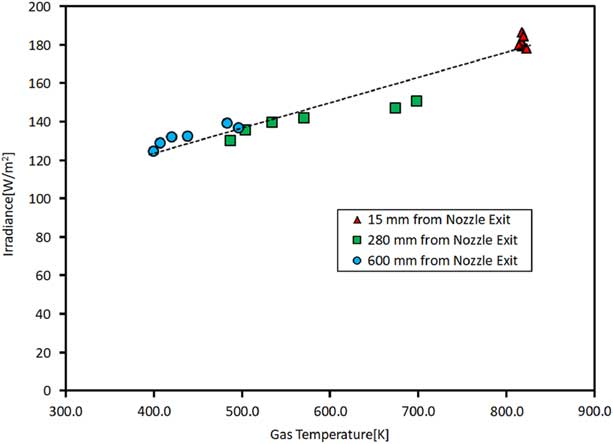
The relationship between gas temperature and irradiance for all experimental cases is shown in Fig. 16. In this graph, the gas temperature is about 820 K at a point 15 mm from the nozzle outlet, and about 400 K at a point of 600 mm. It can be seen that the almost constant gas temperature at the 15 mm distance from nozzle exit becomes larger as the distance increases with various aspect ratio. Therefore, as the distance from the nozzle outlet increases, the gas temperature gradually decreases, and the irradiance is also linearly reduced as shown in the dotted trend line.
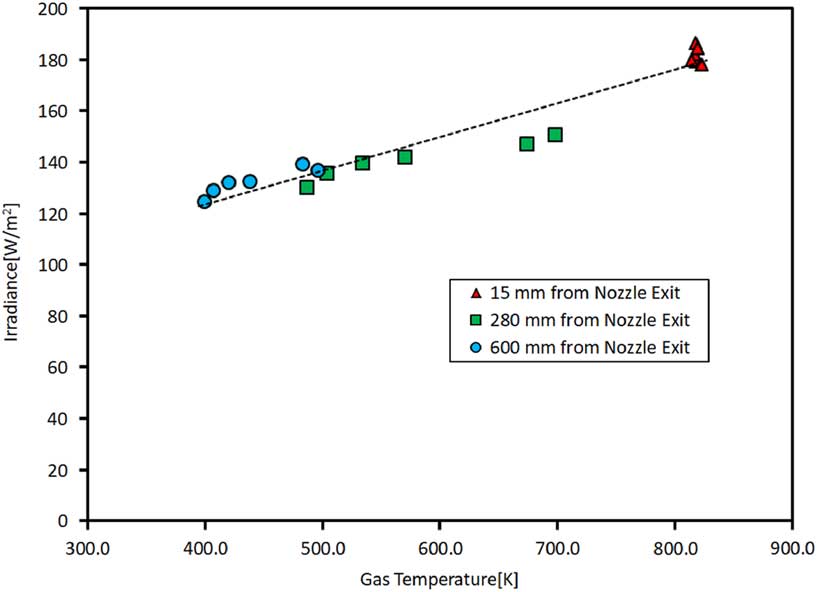
Figure 16 (Colour online) Infrared irradiance with gas temperature.
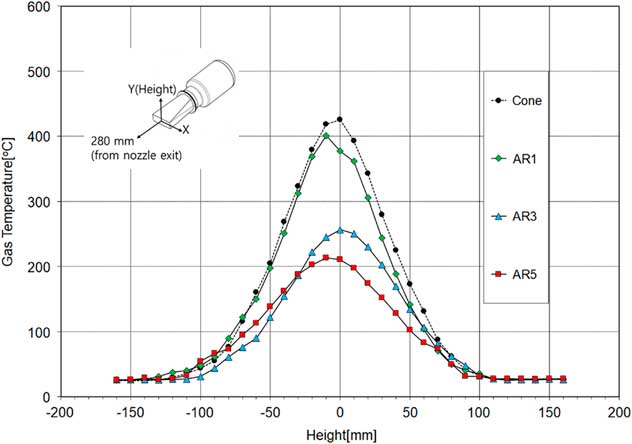
Figure 16 shows the intensity of the infrared irradiance depends on the gas plume temperature. In addition, Fig. 12 shows that the temperature of the gas plume gradually decreases as the aspect ratio increases. Therefore, it is necessary to explain the characteristic that the gas temperature decreases as the aspect ratio of the rectangular nozzle increases. Figure 17 shows gas temperature in a height direction at a distance of 15 mm at the centre of the exit of various nozzles. In the case of the cone type nozzle, the temperature of about 540°C in the centre portion is kept almost constant, and the temperature is rapidly decreased in the gap of about 20 mm. As the aspect ratio increases, the height of the rectangular nozzle outlet gradually decreases. When the aspect ratio changes from 1 to 5, the height of the exit of the nozzle becomes smaller from 56 mm to 25 mm. As shown in Fig. 17, the area occupied by the high-temperature part of the nozzle outlet becomes smaller as the aspect ratio becomes larger. And similar abrupt temperature drop characteristics of plume gas is also shown in the aspect ratio of the rectangular nozzle at 1, 3, and 5. Therefore, as the aspect ratio becomes larger, the area of the high-temperature portion becomes smaller, so that the temperature of the high-temperature portion is reduced more quickly as compared with cone type and low aspect ratio nozzles. Furthermore, the outlet of the rectangular nozzle has the same exit area as the cone nozzle, but AR 1, 3 and 5 are 13%, 30% and 51% larger than the cone nozzle circumference, respectively. In Fig. 13, plume gas is emitted to the atmosphere in a shape similar to the configuration of each nozzle outlet. Consequently, as the aspect ratio of the rectangular nozzle increases, the overall heat exchange area between the plume gas and the atmosphere becomes larger. This effect can be easily seen in Fig. 18 in the height direction at a distance of 280 mm from the nozzle outlet. As a result, the intensity of the infrared signal tends to decrease as the aspect ratio increases.
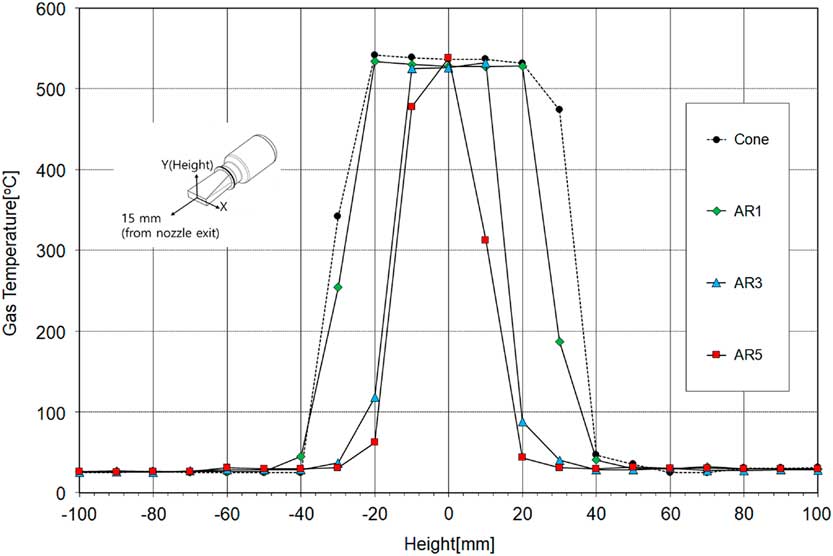
Figure 17 (Colour online) Gas temperature with height at 15 mm from nozzle exit.
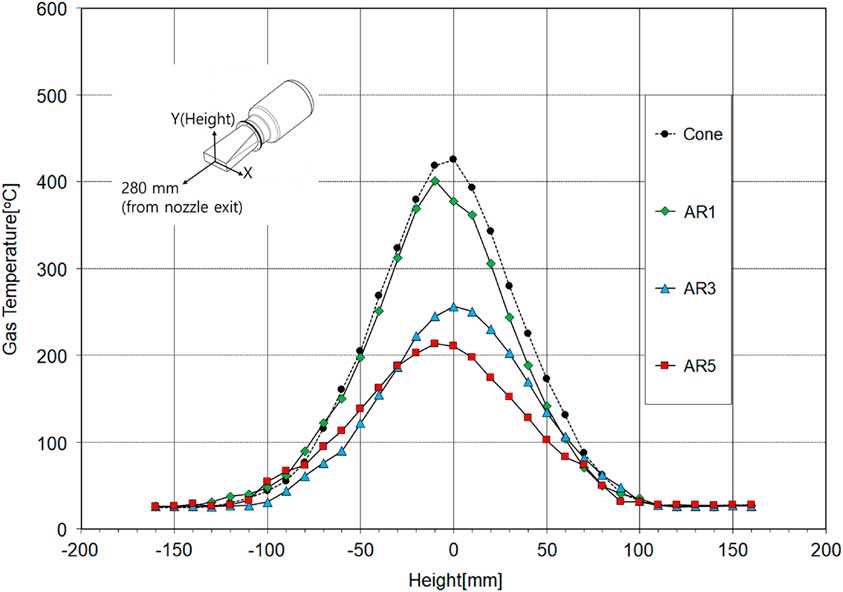
Figure 18 (Colour online) Gas temperature with height at 280 mm from nozzle exit.
4.0 CONCLUSION
The engine performance characteristics and the infrared signal are investigated experimentally by the changing the shape of exhaust nozzle of a micro-turbojet engine. As a result, it was confirmed that the thrust and the fuel consumption rate of the engine do not change greatly by varying the exhaust nozzle shape. In the case of the aspect ratio of 5, the specific fuel consumption of the engine is increased by about 3% compared to the reference cone nozzle, but the infrared signal can be reduced by up to 14% at 600 mm position of the nozzle tip. As a result of measuring the temperature distribution of the plume gas, the temperature distribution characteristics of the aspect ratio was understood. In the case of cone shape, the distribution of plume gas formed to circular shape, and the high-temperature core region continued to develop farther, while the temperature distribution was maintained in the rectangular shape as the aspect ratio increased, and the average temperature decreased sharply. As the aspect ratio increases, the plume spreads more widely. This is because the area of contact with the surrounding cool air increases as the aspect ratio of the exhaust nozzle increases, leading to the rapid reduction of the temperature.
The present study focused on the characteristics of the temperature distribution and infrared irradiance of the nozzle plume in a micro-turbojet engine. The spectral information with regard to the plume infrared wavelengths will be needed to fully understand the behaviour of the infrared signal of the plume. In addition, continuous IR signatures associated with the hot metal surfaces of the nozzle will remain essential, in particular, in the longwave (8–16 μm) band. We hope to report extension of the present study to these topics in near future.
Acknowledgements
This work has been supported by the Low Observable Technology Research Center Program of the Defense Acquisition Program Administration and Agency for Defense Development, Republic of Korea.