


I. INTRODUCTION
A. Application of quantitative phase analysis in mineral exploration
The Lagunas Norte high-sulphidation epithermal gold deposit in the Alto Chicama region of Peru represents the largest greenfields discovery made by the gold industry in the past decade. Discovery of the deposit can be attributed to the identification of elevated gold values in stream sediments and the recognition of extensive zones of intense hydrothermal alteration caused by the interaction of the host rocks with highly acidic hydrothermal fluids.
To identify mineralogical gradients that could be used as vectors to ore at Lagunas Norte and similar high-sulphidation epithermal deposits, the mineralogical characterisation of the hydrothermally altered rocks is crucial. It is not only sufficient to identify coexisting minerals, but also to quantitatively determine the mineralogical composition of the variably altered host rocks as relative changes in mineral abundances might provide important information on the temperature of hydrothermal alteration and the fluid–rock ratio. However, indicator minerals such as pyrophyllite, kaolinite, and alunite present in the altered rocks have similar elemental compositions and may not be easily recognisable in mixtures with more abundant minerals such as quartz and pyrite. Therefore, normative calculations using the chemical composition of bulk samples cannot be employed. Owing to the mineralogical complexity, it is preferable to use techniques based on structural characteristics for mineralogical characterisation. One of these methods is X-ray diffraction (XRD) analysis by the Rietveld method, a technique that has become popular in recent years for the quantification of mineral contents (e.g., Hill et al., Reference Hill, Tsambourakis and Madsen1993; Raudsepp et al., Reference Raudsepp, Pani and Dipple1999; Monecke et al., Reference Monecke, Köhler, Kleeberg, Herzig and Gemmell2001).
However, XRD analysis using the Rietveld method has so far not been applied in mineral exploration for high-sulphidation epithermal deposits as the hydrothermally altered rocks in this deposit type typically contain more than one disordered Si–Al layer silicates. The present study introduces new disorder models for kaolinite and pyrophyllite and shows that these can be successfully implemented into an existing Rietveld refinement code. It is shown that quantification of phase mixtures containing these disordered minerals can be reliably performed, permitting future implementation of quantitative XRD in mineral exploration.
B. Disorder in Si–Al layer silicates
Minerals such as the 1:1 layer silicates kaolinite and dickite, Al2Si2O5(OH)4, or the 2:1 layer silicate pyrophyllite, Al2Si4O10(OH)2, exhibit a wide range of disorder, mainly caused by faults in layer stacking. Layer stacking typically produces rod-like intensity distributions in reciprocal space (Drits and Tchoubar, Reference Drits and Tchoubar1990). The intensity along these rods is more or less modulated, depending on the degree of disorder. The resulting diffraction patterns cannot be described with the traditional Bragg peak concept.
1. Kaolinite
Kaolinite is one of the three polytypes of the kaolin group. The mineral consists of layers of linked SiO4 tetrahedra sheets and AlOOH octahedral sheets. One of the three possible positions of the octahedral Al cation is unoccupied (dioctahedral arrangement) and layers containing these three different positions are denoted as layers of type A, B, or C, respectively (Figure 1). The two positions B and C can be transferred into each other by a pseudo-mirror plane normal to the b-axis. An ordered kaolinite consists of stacks of either B- or C-type layers with a shift of successive layers by ca. –a/3 and a small shift in –b-direction, leading to a triclinic symmetry with the angle gamma slightly deviating from 90° (Bish and Von Dreele, Reference Bish and Von Dreele1989). This deviation has reverse signs for B- and C-layers which hampers structural formulation of stacks of both layer types in a common unit cell. Bookin et al. (Reference Bookin, Drits, Plançon and Tchoubar1989) proposed a transformation of both layer types and translation vectors to fit in the same orthogonal unit cell. This setup is compatible with the approach taken in the present work.

Figure 1. (Color online) Layer type B (left) with vacant B position and layer type C (right) with vacant C position. The octahedra have different colours to enhance visualisation.
Figure 2 illustrates ordered stacking of two B layers. Only the octahedral sheet of the lower layer and the tetrahedral sheet of the following layer are displayed for clarity.

Figure 2. (Color online) Ideal stacking of kaolinite with two B layers (left) and stacking of kaolinite with an additional translation of b/3 (right). The octahedral have different colours to enhance visualisation.
The ideal stacking in kaolinite leads to an interlayer arrangement which favours the formation of long hydration bonds. The projection of the tetrahedra of the upper layer coincides with alternating vacant and occupied octahedra in the underlying layer. A similar arrangement can be achieved by introducing an additional translation in the b/3-direction. A shift in –b/3 would lead to a coincidence of all tetrahedra with only occupied octahedra, but this arrangement is energetically unfavourable (Newnham, Reference Newnham1961).
Another polytype of the kaolin group is the mineral dickite. Disordered kaolinite contains not only kaolinitic stacking, but also layer arrangements resembling ordered dickite. Dickite consists of a regular alternating stacking of B and C layers, which can be described by a unit cell containing two layers. Figure 3 shows a projection of the stacking. Only the octahedral sheet of the lower layer and the tetrahedral sheet of the next layer are shown for clarity. The interlayer arrangement shows the same coincidence as in the stacking of kaolinite. In analogy to kaolinite, a second similar arrangement is possible by a shift of –b/3.

Figure 3. (Color online) Ideal stacking of dickite with a B and a C layer (left) and stacking of dickite with an additional translation of −b/3 (right). The octahedra have different colours to enhance visualisation.
2. Pyrophyllite
The layers of pyrophyllite consist of one octahedra sheet which is sandwiched between two tetrahedra layers on both surfaces. Like other layer silicates, pyrophyllite may form different polytypes, depending on the layer orientation, interlayer shifts, and the position of the vacant octahedral position. Two of these possible arrangements are the ordered polytypes 1A and 2M. Both consist of layers with the same orientation and position of the unoccupied octahedron, but differ in the stacking sequence.
Figure 4 shows a single pyrophyllite layer. The two tetrahedra sheets of one layer are shifted parallel to each other in the a–b-plane by an intralayer vector. The layers in the 1A stack are translated parallel to each other by an interlayer vector. The angle between the intralayer vector and the interlayer vector is approximately either +120° or −120°, but always the same per stack. One of these vectors points approximately in the − a-direction, the other one draws an angle of 120° with the a-direction and the intralayer vector (Figure 4).

Figure 4. (Color online) Structure of the pyrophyllite layer. The black arrow represents the direction of the 1A intralayer translation. The red arrows symbolise the two possible directions of interlayer translations.
A regular alternation of the two interlayer vector directions leads to the polytype 2M. The length of the displacement is approximately a/3. Kogure et al. (Reference Kogure, Jige, Kameda, Yamagishi, Miyawaki and Kitagawa2006) examined natural pyrophyllite samples and found that the two directions of interlayer shifts may occur irregularly in the same stack. They proposed a disorder model that describes the occurrence of an interlayer shift by a probability parameter p. For p = 1, the direction is always the same (+120° or −120°, polytype 1A). p = 0 leads to a regular alternation of the two directions (polytype 2M). Values for p between zero and one describe a random mixture of both directions. p = 0.5 denotes the highest degree of disorder. Simulations of XRD powder patterns with the software DIFFaX (Treacy et al., Reference Treacy, Newsam and Deem1991) showed typical peak shapes of natural occurring pyrophyllite samples.
II. MATERIALS AND METHODS
A. Reference materials
Two natural reference materials were chosen for each mineral, a weakly disordered material and an intermediate disordered example. The two kaolinite samples are standards from the Source Clay Repository of The Clay Minerals Society. The sample KGa-1 is a low-defective kaolinite from Washington in Georgia, USA, and the sample KGa-2 is an intermediate-defective material from Warren in Georgia, USA. Both materials were characterised by previous workers, including Chipera and Bish (Reference Chipera and Bish2001). A weakly disordered pyrophyllite from the Ukraine, UKR-1, and an intermediate disordered pyrophyllite from Vogtland in Germany, VGT-1, were chosen to test the pyrophyllite disorder model. These two samples are taken from the mineralogical collections of the TU Bergakademie Freiberg.
The kaolinite samples were separated by grain size using the Atterberg method to reduce the amount of quartz and other impurities. The pyrophyllite samples were hand-picked from crushed coarse-grained material. Mixtures of kaolinite, pyrophyllite, and a highly crystalline corundum standard (American Elements AL-OX-04) were prepared to test the quantitative phase analyses.
Mineral quantification was also performed on a natural sample form Lagunas Norte. The sample is an altered mudstone composed of quartz, alunite, pyrophyllite, and kaolinite.
B. X-ray diffraction
All powder specimens were prepared by a side-loading technique into a 27 mm-diameter sample holder and measured in Bragg–Brentano geometry on a URD-6 (Seifert-FPM) diffractometer (CoKα radiation generated at 40 kV and 30 mA), equipped with an automatic divergence slit (irradiated sample length of 15 mm), a diffracted-beam graphite monochromator, a 0.2 mm detector slit, and a point detector (selectively a proportional counter or an energy dispersive detector). Parameters of measurement included a 0.02° 2θ step size, a counting time of 20 s, a total measuring time of ~1250 min, and a measured interval from 5 to 80° 2θ.
C. Rietveld refinement
Rietveld refinement of the experimental XRD data was conducted using the software BGMN (Bergmann et al., Reference Bergmann, Friedel and Kleeberg1998). BGMN contains a structure description language permitting the implementation of physically sound disorder models. This interpreter language was used to perform a recursive structure factor calculation (Ufer et al., Reference Ufer, Kleeberg, Bergmann, Curtius and Dohrmann2008), similar to that of the simulation software DIFFaX (Treacy et al., Reference Treacy, Newsam and Deem1991).
The disorder models for kaolinite and pyrophyllite require the definition of more than one layer type. BGMN allows the definition of the so-called sub-phases. Sub-phases are sets of structural parameters (e.g., atomic positions and broadening parameters) which share the same unit cell. Structure factors of each sub-phase can be calculated individually and combined with each other, even as complex numbers. This permits recursive calculations. The statistical description of stacking disorder from one layer to the next is hereby performed by the definition of quadratic translation vector matrices and probability matrices. Details of the implementation of this formalism can be found in Ufer et al. (Reference Ufer, Kleeberg, Bergmann and Dohrmann2012).
All disorder models were described in an orthogonalised triclinic unit cell enlarged 100 times in the c-direction. This produced enough sampling points in reciprocal space to reproduce a wide range of intensity distributions along the reciprocal rods from nearly ordered to randomly disordered.
D. Disorder models
The disorder model of kaolinite describes the structure of a mixture of the two polytypes kaolinite and dickite. Eight possible stacking sequences can be described. B–B or C–C stacking hereby refer to ordered kaolinitic stacking, whereas B–C and C–B refer to ordered dickitic stacking. All of these types of stacking may contain an additional translation component of b/3 respective –b/3. It is necessary to double these eight sequences for the declaration of a quadratic stacking matrix. Therefore, four layers were defined as sub-phases, two identical B layers and two identical C layers. The atomic positions of the B layers are derived from an ordered dickite structure model (Newnham, Reference Newnham1961). The positions of the C layers are calculated from the B layer structure by a mirror operation. Some stacking arrangements are equivalent, because of the symmetrical relationship of the two layer types. The following stacking parameters were declared as refineable parameters.
txBB and tyBB are the relative translation components for kaolinitic stacking. Note that they differ from the ideal kaolinitic stacking of –a/3 because of the transformation to the orthogonal unit cell. txBC and tyBC are the dickitic translation components. pBB is the probability for the occurrence of a kaolinitic stacking. pBC, the probability of a dickitic stacking, can be calculated by 1 – pBB. pBB(ordered), and pBC(ordered) are the proportion of the two stacking sequences that contain no additional translation by b/3. In addition, lattice parameters, peak broadening parameters, and a scaling factor are refined.
The disorder model of pyrophyllite described the stacking according to Kogure et al. (Reference Kogure, Jige, Kameda, Yamagishi, Miyawaki and Kitagawa2006). Two identical sub-phases are declared. The atomic positions of the 2:1 layer are derived from Lee and Guggenheim (Reference Lee and Guggenheim1981). Only one refineable probability parameter p1A describes the stacking in a 2 × 2 matrix. For p1A = 1 all interlayer vectors have the same direction, which corresponds to the polytype 1A. p1A = 0 corresponds to a regular alternation of the two directions (two-layer polytype 2M). Values of p1A between 0 and 1 describe stacking disorder with the highest degree of disorder for p1A = 0.5. The two angles α0 and α120 between the a-axis and the two interlayer shifts are refineable parameters, because they can deviate slightly from the ideal values of 120°. The length of this translation dt(inter) will also be refined because it can deviate from the ideal translation length of a/3. In analogy to kaolinite, lattice parameters, peak broadening parameters, and a scaling factor were refined. All refineable parameters are restrained in both disorder models within reasonable limits.
Impurities present in the reference materials (quartz, rutile, anatase, hematite, muscovite, and kaolinite) and the sample from Lagunas Norte are described as standard Rietveld models. Effects of preferred orientation are corrected by a spherical harmonics function (Bergmann et al., Reference Bergmann, Monecke and Kleeberg2001) or, in case of the disorder models, as a three-dimensional ellipsoidal function. The instrumental contribution to the peak profile is modelled by a fundamental parameter approach (Cheary and Coelho, Reference Cheary and Coelho1992).
III. RESULTS
A total of seven measurements and Rietveld refinements were performed. This included two reference samples of each of the two disordered minerals, two known mixtures, and one natural sample from the Lagunas Norte high-sulphidation epithermal deposit. Table 1 shows the results of the quantification of the mineral contents and Table 2 gives the results of the refinement of structural parameters of the two disorder models.
Table I. Quantitative mineral composition of reference materials and mixtures, as determined by the Rietveld refinement.
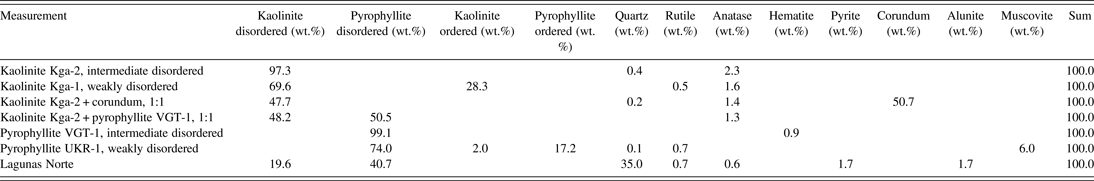
Table II. Refinement results of structural parameters. Underlined parameters reached a refinement limit.
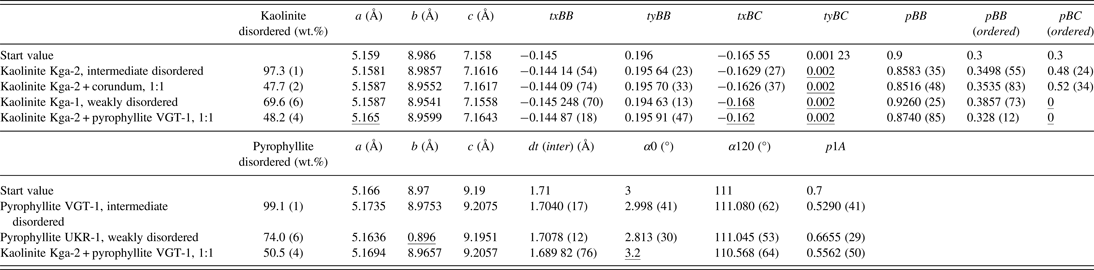
The estimated standard deviation σ, referring to the last digits, is declared in brackets for some parameters. a, b, and c: lattice parameters. txBB, tyBB, txBC, and tyBC: relative translation components for kaolinitic, respectively. Dickitic stackings. pBB, pBB(ordered), and pBC(ordered), probabilities of stacking sequences in kaolinites; dt(inter), length of interlayer translation in pyrophyllite; α0 and α120, angles between intralayer and interlayer shifts; p1A, probability of polytypic 1A stackings.
A. Intermediately disordered kaolinite KGa-2
The Rietveld fit of the intermediate disordered kaolinite KGa-2 is shown in Figure 5. The kaolinite is dominated by kaolinitic stacking (pBB = 0.8583) with a strong tendency of additional b/3 translations. One translation component of dickitic stacking, tyBC, reached a refinement limit and pBC has a high standard deviation σ. This may be caused by the low abundance of this type of stacking.

Figure 5. (Color online) Rietveld refinement plot of the intermediately disordered kaolinite KGa-2. The red curve represents the difference between the observed and calculated intensities.
B. Mixture of the intermediately disordered kaolinite KGa-2 and corundum
The kaolinite KGa-2 was mixed with corundum at a ratio of 1:1 to test whether the disorder model can be used in phase quantification (Figure 6). The calculated mineral contents are satisfying, with 49.3 wt.% of kaolinite and impurities and 50.7 wt.% corundum. The structural parameters of the refinement of the kaolinite standard and the mixture are in good agreement except for the lattice parameter b. Generally, the lattice parameters a and b of pyllosilicates are difficult to refine. The ratio of b and a is close to √3, which is a consequence of the pseudo-trigonal symmetry of the layers. This leads to strong overlaps of hk reflection classes, which is even more severe in the presence of stacking disorder. On the other hand, 00l reflections are not affected by the present kind of stacking disorder and the c lattice parameter can be refined quite reliably.

Figure 6. (Color online) Rietveld refinement plot of a 1:1 mixture of the intermediately disordered kaolinite KGa-2 (blue line) and corundum (green line). The red curve represents the difference between the observed and calculated intensities.
C. Weakly disordered kaolinite KGa-1
A first refinement of the weakly disordered kaolinite KGa-1 showed that the application of the disorder model did not lead to a satisfying result. Intensity was left over at the peak positions of ordered kaolinite. The fit result could be improved by adding an additional model for an ordered kaolinite (Figure 7). The quantification showed that this material can be described as a mixture of 69.6 wt.% disordered kaolinite and 28.3 wt.% ordered kaolinite (plus 2.1 wt.% impurities). The disordered kaolinite has a slightly higher content of kaolinitic stacking and slightly less b/3 translations than the intermediate disordered kaolinite KGa-2. The phenomenon of the coexistence of a disordered and an ordered kaolinite was already described by Plançon et al., (Reference Plançon, Giese, Snyder, Drits and Bookin1989). It is unclear at present whether the natural kaolinite is a physical mixture of particles or the ordered “phase” represents some kind of segregation of ordered domains within bigger crystallites.

Figure 7. (Color online) Rietveld refinement plot of the weakly disordered kaolinite KGa-1. The blue line represents the disorder model and the green line is the ordered model. The red curve is the difference between the observed and calculated intensities.
D. Intermediately disordered pyrophyllite VGT-1
Figure 8 shows the Rietveld fit of the intermediately disordered pyrophyllite VGT-1. This material is fairly pure pyrophyllite, it only contains 0.9 wt.% hematite. The refinement of the probability parameter p1A = 0.529 shows that the pyrophyllite almost has the highest degree of disorder.

Figure 8. (Color online) Rietveld refinement plot of the intermediately disordered pyrophyllite VGT-1. The red curve represents the difference between the observed and calculated intensities.
E. Weakly disordered pyrophyllite UKR-1
The weakly disordered pyrophyllite UKR-1 contains considerable impurities of kaolinite, muscovite, quartz, and rutile. The kaolinite in this sample is described as an ordered structure. A refinement using just the disorder model to describe the pyrophyllite led to the same result as in the case of the weakly disordered kaolinite KGa-1. It was necessary to introduce a structural model for an ordered pyrophyllite to fit all peaks (Figure 9). The quantification showed that this sample contains 74.0 wt.% disorder pyrophyllite and 17.2 wt.% ordered pyrophyllite. It is again not clear if the pyrophyllite represents a physical mixture of two particular phases or any segregation of differently ordered domains within a bigger stack. The disordered pyrophyllite shows a weak tendency to the 1A polytype (p1A = 0.6655).

Figure 9. (Color online) Rietveld refinement plot of the weakly disordered pyrophyllite UKR-1. The blue line represents the disorder model and the green line is the ordered model. The red curve is the difference between the observed and calculated intensities.
F. Mixture of the intermediately disordered kaolinite KGa-2 and pyrophyllite VGT-1
A 1:1 mixture of the kaolinite KGa-2 and the pyrophyllite VGT-1 was prepared to test whether mixtures of these minerals can be quantified reliably, which is necessitated by the fact that samples from high-sulphidation epithermal deposits such as Lagunas Norte commonly contain both minerals. In addition to kaolinite and pyrophyllite only anatase was considered in the refinement (Figure 10). All other impurities were close to the detection limit because of the dilution. The quantification results are satisfying, but three structural parameters of kaolinite and one of pyrophyllite reached their respective refinement limits.

Figure 10. (Color online) Rietveld refinement plot of a 1:1 mixture of kaolinite KGa-2 and pyrophyllite VGT-1. The blue line is the kaolinite model and the green line is the pyrophyllite model. The red curve represents the difference between the observed and calculated intensities.
G. Sample from Lagunas Norte
The hydrothermally altered mudstone sample from Lagunas Norte contains disordered kaolinite and pyrophyllite in addition to alunite and quartz. In addition, small amounts of rutile, anatase, and pyrite were detected. The refinement results indicate that the sample does not contain ordered kaolinite or pyrophyllite. Given the complicated composition of this natural sample, the results of the Rietveld refinement are acceptable (Figure 11).

Figure 11. (Color online) Rietveld refinement plot of a sample from the Lagunas Norte high-sulphidation epithermal deposit. The blue line is the kaolinite model and the green line is the pyrophyllite model. The red curve represents the difference between the observed and calculated intensities.
IV. CONCLUSION
The present contribution shows that disorder models for the description of stacking disorder of kaolinite and pyrophyllite can be successfully implemented in the Rietveld program BGMN. Reasonable results could be archived for reference materials. However, the refinement of parameters describing minor types of stacking often reached their refinement limits or show extremely high standard deviations, for example, the translation components of dickitic stacking or the stacking probability pBC(ordered) in a kaolinitic dominated stack. Samples containing weakly disordered Al–Si-layer silicates had to be described with two structure models, one for a disordered stack and one for an ordered stack. Phase mixtures, including mixtures of disordered kaolinite and pyrophyllite, could be successfully quantified, but the refinement of structural parameters became partly questionable. A stable refinement of these parameters in mixtures is difficult, but a physically based choice of refinement limits allows the refinement of structural parameters without the risk of running into false minima with drastic consequences for the quantitative results. A careful choice of these limits, as opposed to keeping them fixed, is an applicable compromise between numerical stability, significance of structural results, and computational effort. The examination of additional reference materials is necessary to choose suitable limits to stabilise the refinement of structural parameters. Nevertheless, the correct quantification of standard mixtures and the relatively low standard deviation of phase contents showed that these models allow the use of the Rietveld technique to quantify the content of coexisting disordered layer silicates. The approach is expected to deliver more reliable results of mineral quantification for coexisting dioctahedral minerals, allowing the use of the Rietveld method as a tool in the exploration and characterisation of alteration halos of ore deposits.
ACKNOWLEDGEMENTS
We thank F. Robert for facilitating research at Lagunas Norte. H. Hanneman is thanked for his insights into the deposit geology. Field work by TM was kindly supported by Barrick Gold and the Canadian Mining Industry Research Organization Project 08E04. The manuscript benefited from comments made by an anonymous reviewer.


