


Introduction
Formal and informal perceptual evaluation of speakers' voices is a well established field of study. Early (and later) studies demonstrated negative listener reaction to dysphonic voices.Reference Blood, Mahan and Hyman1–Reference Ruscello, Lass and Podbesek5 Davis and Harris showed that elementary school teachers could identify children with disordered voices, a skill that might be useful for screening purposes.Reference Davis and Harris6 Bonet and Casan proposed perceptual screening for dysphonia as a means of identifying a population (child choristers) at risk of vocal pathology.Reference Bonet and Casan7 Perceptual analysis remains an important feature of vocal assessment, both in research and clinical practice, and is endorsed by some as a necessary counterpart to other measures of voice, such as acoustic analysis.Reference Behrman8–Reference Webb, Carding, Deary, MacKenzie, Steen and Wilson13 However, there continues to be an issue regarding variability in listener perception in relation to normal and pathological voices.Reference Kreiman, Gerratt, Precoda and Berke14, Reference Muñoz, Mendoza, Fresneda, Carballo and Lopez15 Indeed, the collective work of Kreiman's group has led them to conclude that, ‘…pathologic voice quality assessment using traditional perceptual labels [viz ‘breathy’, ‘rough’, etc] is not generally useful’.Reference Kreiman and Gerratt16
The GRBAS scale is a perceptual rating scale widely reported in voice research.Reference Hirano17 Using a four-point scale (where zero = normal and three = severe), this system characterises the voice according to grade (i.e. overall severity), roughness, breathiness, asthenicity and strain. Some authors have proposed the adoption of this scale for routine clinical use.Reference Carding, Carlson, Epstein, Mathieson and Shewell10, Reference Webb, Carding, Deary, MacKenzie, Steen and Wilson13 Various studies have considered the clinical utility of the scale, including its rater reliability and method of presentation (i.e. ordinal versus visual analogue scale).Reference Speyer, Wieneke and Dejonckere12, Reference De Bodt, Van de Heyning, Wuyts and Lambrechts18–Reference Millet and Dejonckere22 Other authors have employed the scale, fully or partially, as a ratings tool, and have incidentally reported on rater reliability.Reference Karnell, Melton, Childes, Coleman, Dailey and Hoffman23, Reference Piccirillo, Painter, Haiduk, Fuller and Fredrickson24
The raters employed in such studies have varied in number from twoReference Webb, Carding, Deary, MacKenzie, Steen and Wilson13, Reference De Bodt, Van de Heyning, Wuyts and Lambrechts18, Reference Millet and Dejonckere22 to 28.Reference Lee, Drinnan and Carding25 Some raters have been specially ‘trained’ in use of the scale,Reference Ma and Yiu26 while others have been more or less experienced in the field of clinical voice management, being variously patients,Reference Lee, Drinnan and Carding25 students,Reference Piccirillo, Painter, Haiduk, Fuller and Fredrickson24 speech and language therapists and pathologists,Reference Speyer, Wieneke and Dejonckere12, Reference Karnell, Melton, Childes, Coleman, Dailey and Hoffman23, Reference Lee, Drinnan and Carding25, Reference Murry, Medrado, Hogikyan and Aviv27 and ENT surgeons and phoniatricians.Reference De Bodt, Wuyts, Van de Heyning and Croux19–Reference Millet and Dejonckere22
The number of voices rated in these studies has ranged from nineReference De Bodt, Wuyts, Van de Heyning and Croux19 to 943.Reference Dejonckere, Remacle, Fresnel-Elbaz, Woisard, Crevier-Buchman and Millet21 Some studies have included normal voices.Reference Webb, Carding, Deary, MacKenzie, Steen and Wilson13, Reference Karnell, Melton, Childes, Coleman, Dailey and Hoffman23, Reference Piccirillo, Painter, Haiduk, Fuller and Fredrickson24, Reference Murry, Medrado, Hogikyan and Aviv27 Where dysphonic voices have been rated, there has generally been limited detail on background pathology.Reference Karnell, Melton, Childes, Coleman, Dailey and Hoffman23, Reference Piccirillo, Painter, Haiduk, Fuller and Fredrickson24 Only Dejonckere et al. have reported the severity of ratings according to the broad category of vocal pathology involved; they noted an incomplete pattern of increasing severity of GRBAS scores for patients with functional problems, vocal fold nodules, benign tumours, vocal fold paralysis and malignant tumours.Reference Dejonckere, Obbens, de Moor and Wieneke20
Specific rating trends have been reported, including: highest agreement for overall severity (i.e. grade);Reference Webb, Carding, Deary, MacKenzie, Steen and Wilson13, Reference De Bodt, Wuyts, Van de Heyning and Croux19–Reference Millet and Dejonckere22 greater test–retest reliability among more experienced raters and (for some sub-scales) among speech and language pathologists compared with ENT surgeons;Reference De Bodt, Wuyts, Van de Heyning and Croux19 more severe rating by patients themselves compared with speech and language therapists;Reference Lee, Drinnan and Carding25 and improved inter-rater agreement with sustained use of the GRBAS scale over time.Reference Dejonckere, Remacle, Fresnel-Elbaz, Woisard, Crevier-Buchman and Millet21 However, it is of concern that while some groups report gratifyingly high rates of inter- and intra-rater agreement (e.g. near-perfect agreement among experienced speech and language pathologists in Murry and colleagues' study,Reference Murry, Medrado, Hogikyan and Aviv27 and ≥0.92 per cent agreement for all GRBAS scoring among speech and language pathology students in Piccirillo and colleagues' study),Reference Piccirillo, Painter, Haiduk, Fuller and Fredrickson24 rater reliability continues to be a significant issue (with some groups reporting the highest κ value for inter-rater reliability as no better than ‘moderate’ (for overall grade)).Reference De Bodt, Wuyts, Van de Heyning and Croux19, Reference Dejonckere, Remacle, Fresnel-Elbaz, Woisard, Crevier-Buchman and Millet21
Inhaled asthma medication has the potential to directly affect the larynx, and therefore asthma, or its treatment, may have a direct effect on patients' voices. Up to 50 per cent of patients taking inhaled corticosteroids may suffer from dysphoniaReference Baker, Baker and Le28 which is usually reversible.Reference Barnes, O'Byrne and Thomson29 This has been attributed to fungal infection or steroid-induced adductor myasthenia of the larynx,Reference Williamson, Matusiewicz, Brown, Greening and Crompton30 although laryngoscopy or voice laboratory assessment may reveal more complicated abnormalities such as apposition abnormalities and cycle to cycle irregularity.Reference Crompton, Sanderson, Dewar, Matusiewicz, Ning and Jamieson31–Reference Lavy, Wood, Rubin and Harries34
The present study formed a component of a larger study characterising the vocal quality, self-perception of vocal morbidity, and laryngeal and nasal appearances in patients attending a problem asthma clinic, the results of which have been reported in summary form elsewhere.Reference Stanton, Johnson, Carter, MacKenzie and Bucknall35–Reference Stanton, Sellars, MacKenzie, McConnachie and Bucknall38 The current study aimed to add to the general sum of knowledge in the field of voice perception, while highlighting issues of rater reliability in relation to the GRBAS scale and potentially outlining vocal features of a more specific patient population.
Materials and methods
Patients were recruited to the study from a problem asthma clinic based in a central teaching hospital. All patients attending the problem asthma clinic were eligible for inclusion in the study. Initially, 121 letters of invitation to take part in the study were sent to patients attending the clinic. If no response was obtained, attempts were made (by telephone or during clinic visits) to reiterate our invitation. Additional patients from the clinic were invited to participate. Sixty patients agreed to take part in the study (17 of whom subsequently withdrew) and 27 declined. Further attempts to contact remaining patients for recruitment were unsuccessful. Forty-three patients were ultimately included in the protocol, which involved attendance on a single afternoon. This study was conducted in accordance with the recommendations of the Helsinki Declaration of 1975 and was approved by the North Glasgow University Hospitals NHS Trust local research and ethics committee (research and ethics committee reference number 03RE002). All patients gave written, informed consent for their participation in the study.
Patient investigation included separate nasal and laryngological examinations. The latter were undertaken by a single otolaryngologist observer using a fibre-optic laryngoscope. Following topical application of co-phenylcaine to the nose, each patients' larynx and laryngopharynx were examined. Laryngeal assessment was based on structure and function. Laryngeal appearance was noted, along with the mobility of the vocal folds on phonation, inspiration and expiration. Findings were documented as normal or abnormal, with the latter category being further subdivided into organic or functional abnormalities. Patients also completed the voice symptom scale, a 30 item questionnaire which has been thoroughly evaluated in the self-assessment of voice quality.Reference Wilson, Webb, Carding, Steen, MacKenzie and Deary39
Voice recordings were then undertaken in a soundproof booth housed within the otolaryngology department. Recordings were made using digital audio tape in a digital tape recorder. Patients were asked to speak approximately 10 to 15 cm away from the microphone. They were asked to state their name and to engage in a few seconds of simple, spontaneous speech (topics suggested by the researcher included how they had got to the hospital that day, what they had watched on television the previous evening, etc) before reading the standard ‘rainbow passage’.Reference Fairbanks40 These recordings were made by one of two independent observers who were not involved in any further data analysis.
After all patients' recordings had been made, the recordings were transferred onto two compact discs (CDs) by the medical illustration department, for review by the raters. All stimuli were randomised and then further assigned in a different order on each CD. Each patient's recording therefore corresponded to an individual track on each CD. A master list was kept in which the track numbers were linked to patient names; this list was not seen by the raters.
The raters (A, B and C) were three experienced speech and language therapists who were already very familiar with the GRBAS scale, both in their daily work and from earlier rating exercises undertaken in response to the lack of formalised training for this scale.Reference Carding, Carlson, Epstein, Mathieson and Shewell10 In an attempt to ensure optimal inter-rater agreement for the study, the raters engaged in pre-rating discussion around their individual understanding of the GRBAS scale and additional categories, and undertook listening exercises with recorded (non-study) pathological voices until consensus was reached.
The raters then graded the study patients' voices according to the GRBAS scale, with a further assessment of fluctuations in voice quality (i.e. instability).Reference De Bodt, Van de Heyning, Wuyts and Lambrechts18, Reference Dejonckere, Remacle, Fresnel-Elbaz, Woisard, Crevier-Buchman and Millet21, Reference Dejonckere, Remacle, Fresnel-Elbaz, Woisard, Crevier and Millet41 In addition, the speech and language therapists rated: audible respiration (reflecting any auditorily detectable respiration whether of laryngeal or lung origin) on an ad hoc, zero to three scale (interpreted as per the GRBAS rating scores); pitch range (as reduced or normal); overall pitch height (as low, medium or high); perceived gender (as male or female); and perceived age (by decade). Each CD was listened to and independently rated on two occasions at least seven days apart.
Patients' total GRBAS scores were calculated without using the instability component, as this parameter was not in widespread use. Mean values and standard deviations of the total score, the five component items and the two additional items were reported for all recordings rated, and separately for each rater and for each of the two rating occasions. Analysis of variance (ANOVA) methods were used to test for differences between the average ratings of the three raters (controlling for between-patient and between-occasion differences) and between the two rating occasions (controlling for between-patient and between-rater differences).
Inter- and intra-rater reliability coefficients were calculated using the methods of the generalisability theory,Reference Gleser, Cronbach and Rajaratnam42 using random effects ANOVA models to estimate the components of variance; the patient × occasion variance terms were assumed to be zero in all models, since the same recording was rated on each rating occasion. Inter-rater reliability estimates were also estimated separately for the two rating occasions, and intra-rater reliability estimates were estimated separately for each rater. Bootstrap methods were used to construct 95 per cent confidence intervals (CIs) for all reliability estimates, and to test for differences in reliability between raters or between rating occasions, based on 10 000 bootstrap samples from the 43 patients.Reference Efron and Tibshirani43
In order to compare subgroups of patients, mean values for the total GRBAS scale, for each scale item and for the two additional items were calculated for each patient using the six scores (i.e. from three raters on two occasions). SPlus® for Windows (version 6.1) and MinitabTM (version 14) software was used to perform all calculations.
Results and analysis
Mean ratings
Table I shows means and standard deviations (SDs) for the total GRBAS scale scores, the five component items and the two additional items. There were significant differences between the mean ratings allocated by the three raters for all scale items (p = 0.014 for grade, and p < 0.0001 for all other items). Rater A tended to give higher ratings, except for breathiness and asthenicity. There was a trend among all three raters towards reduction in mean rating on the second occasion. For the asthenicity scale item, this reduction was significant (p = 0.0026), with weaker evidence for ratings of strain (p = 0.046) and total GRBAS scores (p = 0.033).
Table I Scores for GRBAS scale total, individual GRBAS items and additional items, by rater and rating occasion

Data are shown as mean (standard deviation). *F test with analysis of variance, for differences between raters and between occasions, controlling for between-patient differences. GRBAS = grade-roughness-breathiness-asthenicity-strain scale
Reliability
Table II shows the inter- and intra-rater reliability estimates, with 95 per cent CIs, for the total GRBAS score, the five component items and the two additional items. Figure 1 shows the estimates of inter-rater reliability separately for each rating occasion, and the estimates of intra-rater reliability separately for each rater.

Fig. 1 Inter-rater reliability estimates on each rating occasion, and intra-rater reliability estimates for each rater, with 95% confidence intervals (CIs), for the GRBAS scale total score, individual item scores and additional item scores.
Table II Inter- and intra-rater reliability estimates for GRBAS total scores, individual GRBAS item scores and addition item scores
GRBAS = grade-roughness-breathiness-asthenicity-strain scale; CIs = confidence intervals
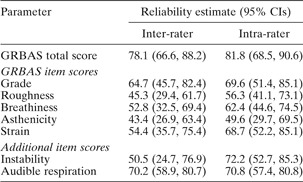
The total GRBAS scores showed good overall performance, with inter-rater reliability estimated as 78.1 per cent (95 per cent CI: 66.6, 88.2 per cent) and intra-rater reliability as 81.8 per cent (95 per cent CI: 68.5, 90.6 per cent). However, this level of reliability was not sustained across the individual scale items. The reliability of the grade item appeared best, with an overall inter-rater reliability of 64.7 per cent and an intra-rater reliability of 69.6 per cent. Asthenicity achieved the lowest inter- and intra-rater reliability estimates, at 43.4 and 49.6 per cent, respectively. The optional item instability had an overall inter-rater reliability of only 50.5 per cent; for this item, there was a marked improvement in inter-rater reliability, comparing the first assessment (35.4 per cent) and the second (65.9 per cent), an increase of 30.5 per cent (95 per cent CI: 13.9, 52.7 per cent). None of the other items showed a statistically significant difference in inter-rater reliability between the two measurement occasions. The instability item had rather better intra-rater reliability, at 72.2 per cent. Audible respiration achieved 70.2 per cent inter-rater reliability and 72.2 per cent intra-rater reliability overall, although there was considerable variability among raters.
In fact, there was variability between the raters for many scale items, in terms of the level of intra-rater reliability achieved (Figure 1). Rater C achieved the highest degree of consistency for all scale items, dropping no lower than 62.3 per cent. Rater A, by comparison, was the least reliable on all but the strain item, with a low of 24.5 per cent for asthenicity. The CIs for individual raters' reliability estimates were wide, and the only differences between raters which reached statistical significance were between raters C and A on grade, asthenicity and audible respiration.
Separate analyses were undertaken for inter- and intra-rater reliability (for grade, roughness, breathiness, asthenicity, strain, instability and audible respiration assessment) for subjects with laryngeal abnormalities or functional laryngeal problems (see Table III). Results for this sub-group analysis showed a strong tendency to greater inter-rater reliability, with improved consistency ranging between 5.5 per cent (for total score) and 29.5 per cent (for instability); however, no statistically significant differences were observed. The only exceptions to this trend were the reduced consistency rates for roughness and audible respiration (which were 5.6 and 1.7 per cent, respectively, in the other direction). Intra-rater reliability was significantly better for grade assessment in patients with any laryngeal abnormality, compared with patients with normal laryngeal appearance (78.8 versus 47.3 per cent, respectively; 95 per cent CI for difference: 6.2 to 59.1 per cent). A similar trend was apparent for other categories. In this instance, improved consistency ranged between 2.4 per cent (for strain) and 31.5 per cent (for grade). The only exception for intra-rater reliability was audible respiration (5.0 per cent in the other direction).
Table III Laryngoscopic findings

Pts = patients; mod = moderate
A contradictory, although inconsistent, trend was seen for poorer reliability of observations when patients with functional laryngeal problems alone were considered (versus patients with no laryngeal problems; see Table III). In such cases, inter-rater reliability agreement decreased by between 9.1 and 25.3 per cent, with the exception of asthenicity (20.5 per cent in the other direction). The picture is less clear-cut for intra-rater reliability, with poorer results of between 8.8 per cent (for audible respiration) and 43.5 per cent (for strain), but with three GRBAS scale items moving in the direction of improved consistency (grade, 2.5 per cent; breathiness, 2.7 per cent; and asthenicity, 9.5 per cent). A statistically significant difference was only observed for intra-rater reliability in strain assessment.
Other results
Perceived age
For 29 of the 43 patients, there was majority agreement (≥4/6 observations across raters on both occasions) of perceived age. This was in agreement with the patients' actual age in only 13 (44.8 per cent) patients. On the two rating occasions, raters' perception of age was in agreement with actual age within a range of 39.5 to 46.5 per cent.
Perceived gender
The patient's perceived gender was incorrect on only six occasions (2.3 per cent), out of a total of 258.
Perceived pitch range
There was full agreement among the three raters on two ratings in 15 patients (34.9 per cent). Figure 2 illustrates the majority perception of pitch range, with 27 of the patients (62.8 per cent) considered as normal. No significant statistical relationship could be demonstrated between the perceived pitch range and the grade item score or total voice symptom scale score (p = 0.17 and 0.52, respectively; Mann–Whitney U test). Raters' perceptions of pitch range did not appear to distinguish particularly well between the different subgroups identified at laryngoscopy, although eight of the nine patients with reduced pitch range had some form of laryngoscopic abnormality (see Table IV).

Fig. 2 Raters' perceptions of pitch range.
Table IV Majority pitch ratings* compared with laryngeal abnormality findings

* >3/6 agreements across raters and rating occasions. †n = 27; ‡n = 9.
Perceived pitch height
There was full agreement among the three raters on two ratings in 13 patients (30.2 per cent). Figure 3 illustrates the majority perception of pitch height, with 25 of the patients (58.1 per cent) considered as falling within a ‘medium’ overall pitch height. There was no significant difference between the low and medium pitch height groups in terms of their grade item score and total voice symptom scale scores (p = 0.11 and p = 1.0, respectively; Mann–Whitney U test). Perception of pitch height did not distinguish between the different subgroups identified at laryngoscopy.

Fig. 3 Raters' perceptions of pitch height.
Discussion
The findings of this project reported elsewhereReference Stanton, Johnson, Carter, MacKenzie and Bucknall35–Reference Stanton, Sellars, MacKenzie, McConnachie and Bucknall38 confirm the results of other studies regarding the presence of organic and functional laryngeal abnormalities with or without associated vocal consequences in an asthmatic population.Reference Baker, Baker and Le28–Reference Lavy, Wood, Rubin and Harries34 It is against this background of observed pathology (Table III) that the results of the present study must be considered.
Some authors have been able to report very high levels of reliability for the GRBAS scale. For example, Murry and colleagues have described reliability coefficients in a voice-disordered population ranging from 0.88 for strain to 0.98 for grade, and reliability coefficients in a normal population of 0.99 for all GRBAS items; Piccirillo and colleagues have reported coefficient α reliability estimates ranging from 0.92 (for asthenicity) to 0.96 (for grade and breathiness).Reference Piccirillo, Painter, Haiduk, Fuller and Fredrickson24, Reference Murry, Medrado, Hogikyan and Aviv27 The reliability of the GRBAS scale in the present study has been shown to be fairly robust for total scores, both on an inter- and an intra-rater basis. However, total scores are not in common clinical use and may have little clinical relevance, although the present findings could be viewed as prima facie evidence for considering the use of total scores as a possible indicator in clinical practice. More commonly, grade is used as a measure of overall severity and has been generally reported as showing the best levels of agreement.Reference Webb, Carding, Deary, MacKenzie, Steen and Wilson13, Reference De Bodt, Wuyts, Van de Heyning and Croux19, Reference Dejonckere, Remacle, Fresnel-Elbaz, Woisard, Crevier-Buchman and Millet21, Reference Millet and Dejonckere22 By comparison, in the current study the raters achieved a rather modest 64.7 per cent for inter-rater reliability and 69.6 per cent for intra-rater reliability for the grade item score. When one considers the asthenicity scale item, inter- and intra-reliability scores dropped as low as 43.4 and 49.6 per cent, respectively, a tendency that is repeated in other studies for the categories of both asthenicity and strain, usually, however, to the greater detriment of strain.Reference Webb, Carding, Deary, MacKenzie, Steen and Wilson13, Reference De Bodt, Wuyts, Van de Heyning and Croux19, Reference Dejonckere, Remacle, Fresnel-Elbaz, Woisard, Crevier-Buchman and Millet21, Reference Dejonckere, Remacle, Fresnel-Elbaz, Woisard, Crevier and Millet41 Moreover the reliability of the GRBAS scale remains open to question, as our findings also demonstrated a clear and consistent effect of the rater on the total score, the individual GRBAS scale item scores, and the instability and audible respiration scores, as well as a less consistent effect of rating occasion on total, asthenicity and strain scores (Table I). The latter effect also underlines the fragility of asthenicity and strain as reliable categories.
Although Dedivitis and colleagues do not report grade item scores, they observed, as did we, rather poor concordance rates for other GRBAS items in their patient population (smokers), which was in some respects similar to the current study population in being not specifically normal or voice-disordered but having clearly a significant proportion of vocal pathology. Furthermore, a tendency towards improved reliability in scoring, noted in the current study when subjects with laryngeal pathology were considered separately, was also found in Dedivitis' population of smokers.Reference Dedivitis, Barros, Queija, Alexandre, Rezende and Crazza44 This tendency also finds a partial resonance with Dejonckere and colleagues' finding that their raters tended to rate more severely for organic pathologies,Reference Dejonckere, Obbens, de Moor and Wieneke20 but is in contrast to the findings of Kreiman et al., who reported improved agreement for listeners judging the voices of normal subjects.Reference Kreiman, Gerratt, Precoda and Berke14 Muñoz and colleagues did not use the GRBAS scale for perceptual ratings, and found that their raters were not able to distinguish unequivocally between recorded subjects with normal laryngeal status and those with identifiable pathology.Reference Muñoz, Mendoza, Fresneda, Carballo and Lopez15 Such inconsistent findings across studies, possibly confounded by differing methodologies and different rating scales, underline some of the difficulties of achieving meaningful and reliable scores for perceptual evaluation of voice.
Despite the apparent attraction of an instability category to account for variability in perceived voice quality, this item too had a disappointing outcome, in line with the results reported by Dejonckere and colleagues.Reference Dejonckere, Remacle, Fresnel-Elbaz, Woisard, Crevier-Buchman and Millet21 It is therefore not surprising that this proposed addition has not generally been taken up in the literature. In the present study, the further addition of an audible respiration category (to account for the possible respiratory component in the perceived voice quality of a problem asthma clinic population, and scored zero to three as per the GRBAS scale) appeared to capture a feature recognised and agreed upon to a good degree by the raters (70.2 and 72.2 per cent overall inter- and intra-rater reliability, respectively). There is clearly a growing interest in the presence of vocal and laryngeal pathology in patients with respiratory disease, and this aspect of voice quality may need to be more closely defined and incorporated into any perceptual evaluation of this group, if not more generally.Reference Baker, Baker and Le28–Reference Lavy, Wood, Rubin and Harries34
Various researchers and professional bodies have sought to establish the GRBAS scale as the best candidate for reliable perceptual evaluation of voice quality.Reference Carding, Carlson, Epstein, Mathieson and Shewell10, Reference Webb, Carding, Deary, MacKenzie, Steen and Wilson13, Reference Carding, Carlson, Epstein, Mathieson and Shewell45, Reference Dejonckere46 While there may be a case for using the GRBAS as the ‘gold standard’, this has not been accepted in the United States, where the American Speech-Language-Hearing Association has endorsed the use of the somewhat similar Consensus Auditory-Perceptual Evaluation of Voice (CAPE-V) scale. For all such scales, however, there must continue to be concern over the reported variability of rater reliability. It is of some significance that the present study revealed not only a consistent inter-rater effect (Table I) (with rater A tending to score higher on most scales) but also a considerable variability in intra-rater reliability across the raters (such that rater C achieved much greater consistency between rating occasions) (Figure 1). The latter finding in particular would suggest that some individuals may have better established internal listening standards. A similar phenomenon has been reported in two studies of the application of cervical auscultation in determining the sounds of swallowing, with certain individuals proving much more consistent in their responses than their peers.Reference Leslie, Drinnan, Finn, Ford and Wilson47, Reference Stroud, Lawrie and Wiles48 Leslie and colleagues reported intra-rater κ values ranging from −0.12 to 0.71, while Stroud et al. described one listener with ‘almost perfect’ intra-rater reliability. Such findings of superior consistency in listening performance lead one to speculate that close listening for perceptual rating purposes may be susceptible to the effects of training once standards have been established.Reference Wolfe, Martin and Palmer49 In the study by Karnell et al., which employed both the GRBAS scale and the CAPE-V scale, the use of perceptual anchors in listening tasks may have contributed to the satisfactory correlation coefficients (≥0.80) observed for both inter- and intra-rater reliability.Reference Karnell, Melton, Childes, Coleman, Dailey and Hoffman23 In a recent study, Eadie and Baylor, using perceptual categories derived from the CAPE-V scale, were able to demonstrate an effect of training in graduate speech language pathology students, in terms of improvements in intra-rater reliability (for overall severity of speech, p = 0.015) and in inter-rater reliability (more specifically for measures of breathiness, p = 0.0167).Reference Eadie and Baylor50 Awan and Lawson investigated use of the CAPE-V scale and found that perceptual anchor modality may be critical in improving rater reliability, with a combination of textual and auditory anchors proving to be most effective.Reference Awan and Lawson51 These effects remain to be demonstrated for the GRBAS scale.
The remaining aspects of perceived voice considered in this study comprised age, gender, pitch range and pitch height. Of these categories, only gender reached good inter-rater agreement, an excellent 97.7 per cent, with one rater accounting for all the errors. Given the otherwise perfect agreement, this may reflect an element of rater fatigue or other form of inattention, factors which are not alluded to in other accounts of rater reliability in the voice literature.
• Perceptual scales have been identified as an essential component in evaluation of the disordered voice
• The GRBAS scale has been recommended for perceptual evaluation of voice in voice-disordered populations
• The findings of this study do not support the routine use of this scale in characterising voice quality for clinical purposes
• Some scales for ad hoc perceptual analysis used in this study achieved superior rater agreement; further investigation of such scales may be indicated
• There are indications, supported by other published findings, that training in perceptual analysis of voice quality may improve rater reliability
Perceived age, pitch range and pitch height reached poor levels of agreement among the raters. It is not surprising, therefore, that on the present evidence no correlation could be demonstrated between, on the one hand, the more specific, less well defined perceived categories of pitch range and height and, on the other, the GRBAS scale grade item and the total voice symptom scale score. There is some evidence in the literature to support the concept of a correlation between perceived attributes of disordered voice and the patient experience, but correlations of a similar nature in the present data could not be made.Reference Murry, Medrado, Hogikyan and Aviv27, Reference Pribuisiene, Uloza, Kupcinskas and Jonaitis52 Nevertheless, the process of voice perception remains subject to many poorly controlled factors, and the present negative results cannot be assumed to be the final word on the matter. Factors impinging on perception, and reported investigations thereof, may include listener experience, speaking task (e.g. sustained vowels versus connected speech) and experimental method adopted in the study (e.g. improving agreement by multiple presentation of the same stimuli).Reference Kreiman and Gerratt16, Reference Lee, Drinnan and Carding25, Reference Bele53–Reference Zraick, Wendel and Smith-Olinde59 Further work on these and other factors is required in order to be able to define the clinically relevant features of perceived voice, both normal and pathological, that can constitute a valid, reliable instrument for rating, triage and outcome purposes. Beyond this, however, the challenge may be to develop a robust, multi-dimensional (i.e. including perceptual, acoustic, laryngoscopic and self-reported data) evaluation to enable a truly complete characterisation of the voice, and to guide intervention for disordered voices.Reference Behrman8, Reference Bhuta, Patrick and Garnett9, Reference Eadie and Doyle11, Reference Speyer, Wieneke and Dejonckere12, Reference Kreiman and Gerratt16, Reference Behrman, Sulica and He60–Reference Deary, Wilson, Carding and Mackenzie62
Acknowledgement
This work was supported by the Ritchie Trust Research Fellowship from the Royal College of Physicians and Surgeons of Glasgow.


