1 Introduction
Magnetic fields in laboratory plasmas are extensively studied and are well explained in the literature (Samukawa Reference Samukawa1994). The presence of external magnetic fields has remained a topic of interesting fusion research. A varying magnetic field causes changes in the properties of the ions and electrons in a plasma environment. It changes the ionization balance and the plasma spatial distribution. The existence of magnetic fields in dusty plasmas is observed in different astrophysical situation, e.g. cometary plasma tails (Ip & Mendis Reference Ip and Mendis1976) and star-formation regions (Crutcher Reference Crutcher2012). Experimental observation has been carried out on the study of nanodust clouds for very weak magnetic field strengths (Greiner et al.
Reference Greiner, Carstenson, Kohler, Pilch and Piel2013; Tadsen, Greiner & Piel Reference Tadsen, Greiner and Piel2014). Experiments with paramagnetic dust particles are performed by applying a magnetic field of a few mT and observing that the particles behave very differently in comparison to clusters made of chemically processed particles. In a glow discharge plasma experiment, where dust particles are present and a magnetic field of a few mT is externally applied transverse to the electric field,
![]() $E$
(Yang et al.
Reference Yang, Nakajima, Maemura, Matsuda and Fujiyama1996; Maemura, Yang & Fujiyama Reference Maemura, Yang and Fujiyama1998) the motion of dust is observed into the negative
$E$
(Yang et al.
Reference Yang, Nakajima, Maemura, Matsuda and Fujiyama1996; Maemura, Yang & Fujiyama Reference Maemura, Yang and Fujiyama1998) the motion of dust is observed into the negative
![]() $E\times B$
-direction and an ambipolar electric field develops in between the electrons (magnetized) and the ions (unmagnetized). In recent years, fusion devices such as tokamaks have made significant progress in plasma fusion studies (Thomas, Merlino & Rosenberg Reference Thomas, Merlino and Rosenberg2012). However, there have been many new variants of magnetized low-temperature plasma sources such as magnetic filter devices, magnetrons, Hall thrusters etc. where the application of a magnetic field results in enhancement of some desirable features (Sternberg, Godyak & Hoffman Reference Sternberg, Godyak and Hoffman2006).
$E\times B$
-direction and an ambipolar electric field develops in between the electrons (magnetized) and the ions (unmagnetized). In recent years, fusion devices such as tokamaks have made significant progress in plasma fusion studies (Thomas, Merlino & Rosenberg Reference Thomas, Merlino and Rosenberg2012). However, there have been many new variants of magnetized low-temperature plasma sources such as magnetic filter devices, magnetrons, Hall thrusters etc. where the application of a magnetic field results in enhancement of some desirable features (Sternberg, Godyak & Hoffman Reference Sternberg, Godyak and Hoffman2006).
Plasmas, micron-sized dust particles and magnetic fields turn out to be ubiquitous in cosmic plasmas, planetary plasmas as well as in the laboratory experiments, especially those on fusion. These plasmas along with charged particulates under magnetic fields cause a significant impact on the plasma environment. Additionally, the presence of the magnetic field can indirectly modify the plasma properties by changing the movements of ions and electrons in the plasma and, possibly, by redistributing the low and high energy electron populations (Thomas et al. Reference Thomas, Merlino and Rosenberg2012; Kalita et al. Reference Kalita, Kakati, Saikia, Bandyopadhyay and Kausik2015). The plasma parameters such as plasma density, electron energy distribution function (EEDF) or electron energy probability function (EEPF) in a dust-containing weakly ionized plasma play a very important role in different plasma-based applications (Samukawa Reference Samukawa1994), which has been reported in different experimental works about the optimization of those plasma parameters at various configurations (Li et al. Reference Li, Zhang, Xu, Lin, Li and Zhu2009; Ding, Zhang & Wang Reference Ding, Zhang and Wang2011). The profile of the EEDF or EEPF affects various plasma parameters viz. the electron temperature, electron and ion densities as well as the dust charge and the ion and/or electron fluxes on a processing surface (Lieberman & Lichtenberg Reference Lieberman and Lichtenberg2005; Nam & Verboncoeur Reference Nam and Verboncoeur2009; Denysenko, Kersten & Azarenkov Reference Denysenko, Kersten and Azarenkov2015). Therefore, evaluation of the EEDF or EEPF profile at different operating conditions is an important parameter to optimize the discharge conditions. Until now, measurement of EEPFs in dusty plasmas was limited mostly to computer simulations (Boeuf Reference Boeuf1992; Wang & Dong Reference Wang and Dong1997; Denysenko et al. Reference Denysenko, Yu, Ostrikov, Azarenkov and Stenflo2004a ,Reference Denysenko, Yu, Ostrikov and Smolyakov b , Reference Denysenko, Ostrikov, Yu and Azarenkov2006; Goedheer, Akdim & Chutov Reference Goedheer, Akdim and Chutov2004; Ostrikov et al. Reference Ostrikov, Denysenko, Yu and Xu2005), except for a very small number of experimental results. In some works (Denysenko et al. Reference Denysenko, Yu, Ostrikov, Azarenkov and Stenflo2004a ), it was studied theoretically and was found that dust particles have severe impacts on plasma parameters. Dust particles were found to mainly change the distributions of charged particles, EEDF, electron temperature along with the production and loss of plasma particles. The observed Druyvesteyn-like electron distribution in pristine argon plasmas showed Maxwellian behaviour at very high dust density. An experiment (Bilik et al. Reference Bilik, Anthony, Merritt, Aydil and Kortshagen2015) was carried out to evaluate the EEPF in a low pressure argon–silane dusty plasma using a Langmuir probe. In the experiment, it was observed that there is a reduction in lower energetic electron population and a slight increase in the high energy tail region, with a consistently rising electron temperature. The existence of dust in the plasma causes a continuous depletion of the low energy range of EEPFs, whereas the high energy tails of the EEPF remains almost unchanged all throughout the experiment. Similar observations were obtained in our earlier experiment for dust containing unmagnetized hydrogen plasma (Kakati et al. Reference Kakati, Kalita, Kausik, Bandyopadhyay and Saikia2014a ). In another work (Kalita et al. Reference Kalita, Kakati, Kausik, Saikia and Bandyopadhyay2018), we have studied the EEPF for hydrogen plasma under external magnetic field for a constant dust density.
In this work, we mainly emphasize the effects of external magnetic fields on the EEPF. The existence of a magnetic field can change the basic properties of the plasma like the charge density distribution, ion and electron movements, plasma instabilities etc. Thus, here we have studied the effect on plasma oscillation in the presence of external magnetic fields for different dust densities. The magnetic field’s effects on plasma parameters for a pristine hydrogen plasma are not reported in the present manuscript. The electron density, the cold and high energetic electron density at different dust densities are only described for different magnetic fields. Descriptions of the experimental hardware and diagnostics used for this investigation are mentioned in § 2. This will be followed by an analysis of the experimental results in § 3 with conclusion at § 4.
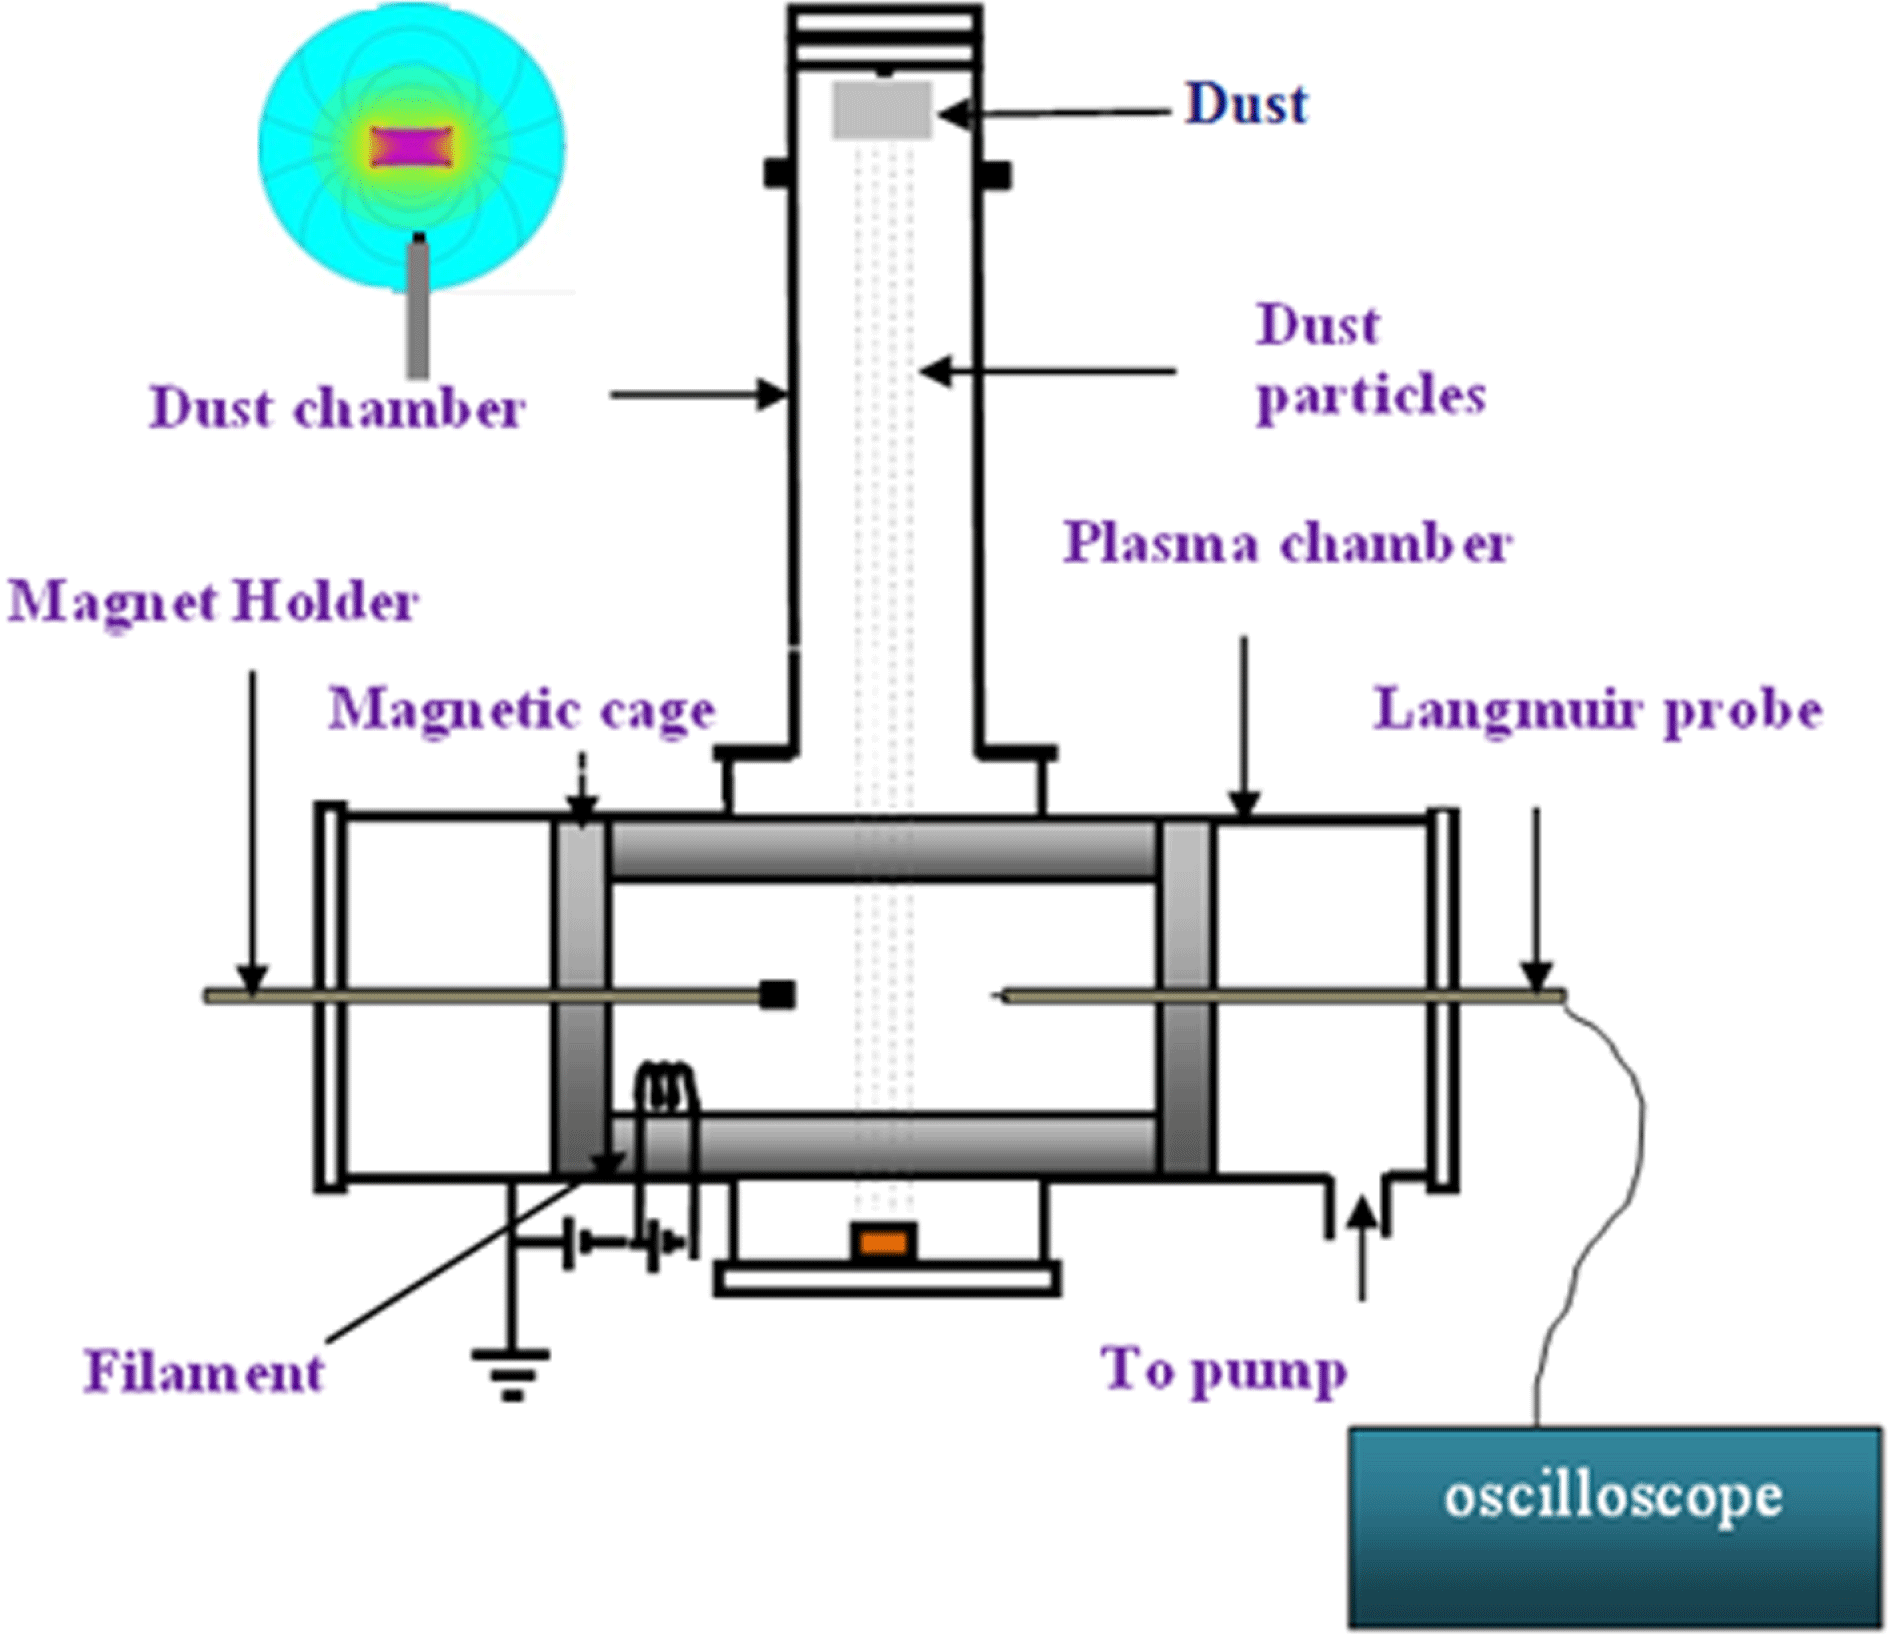
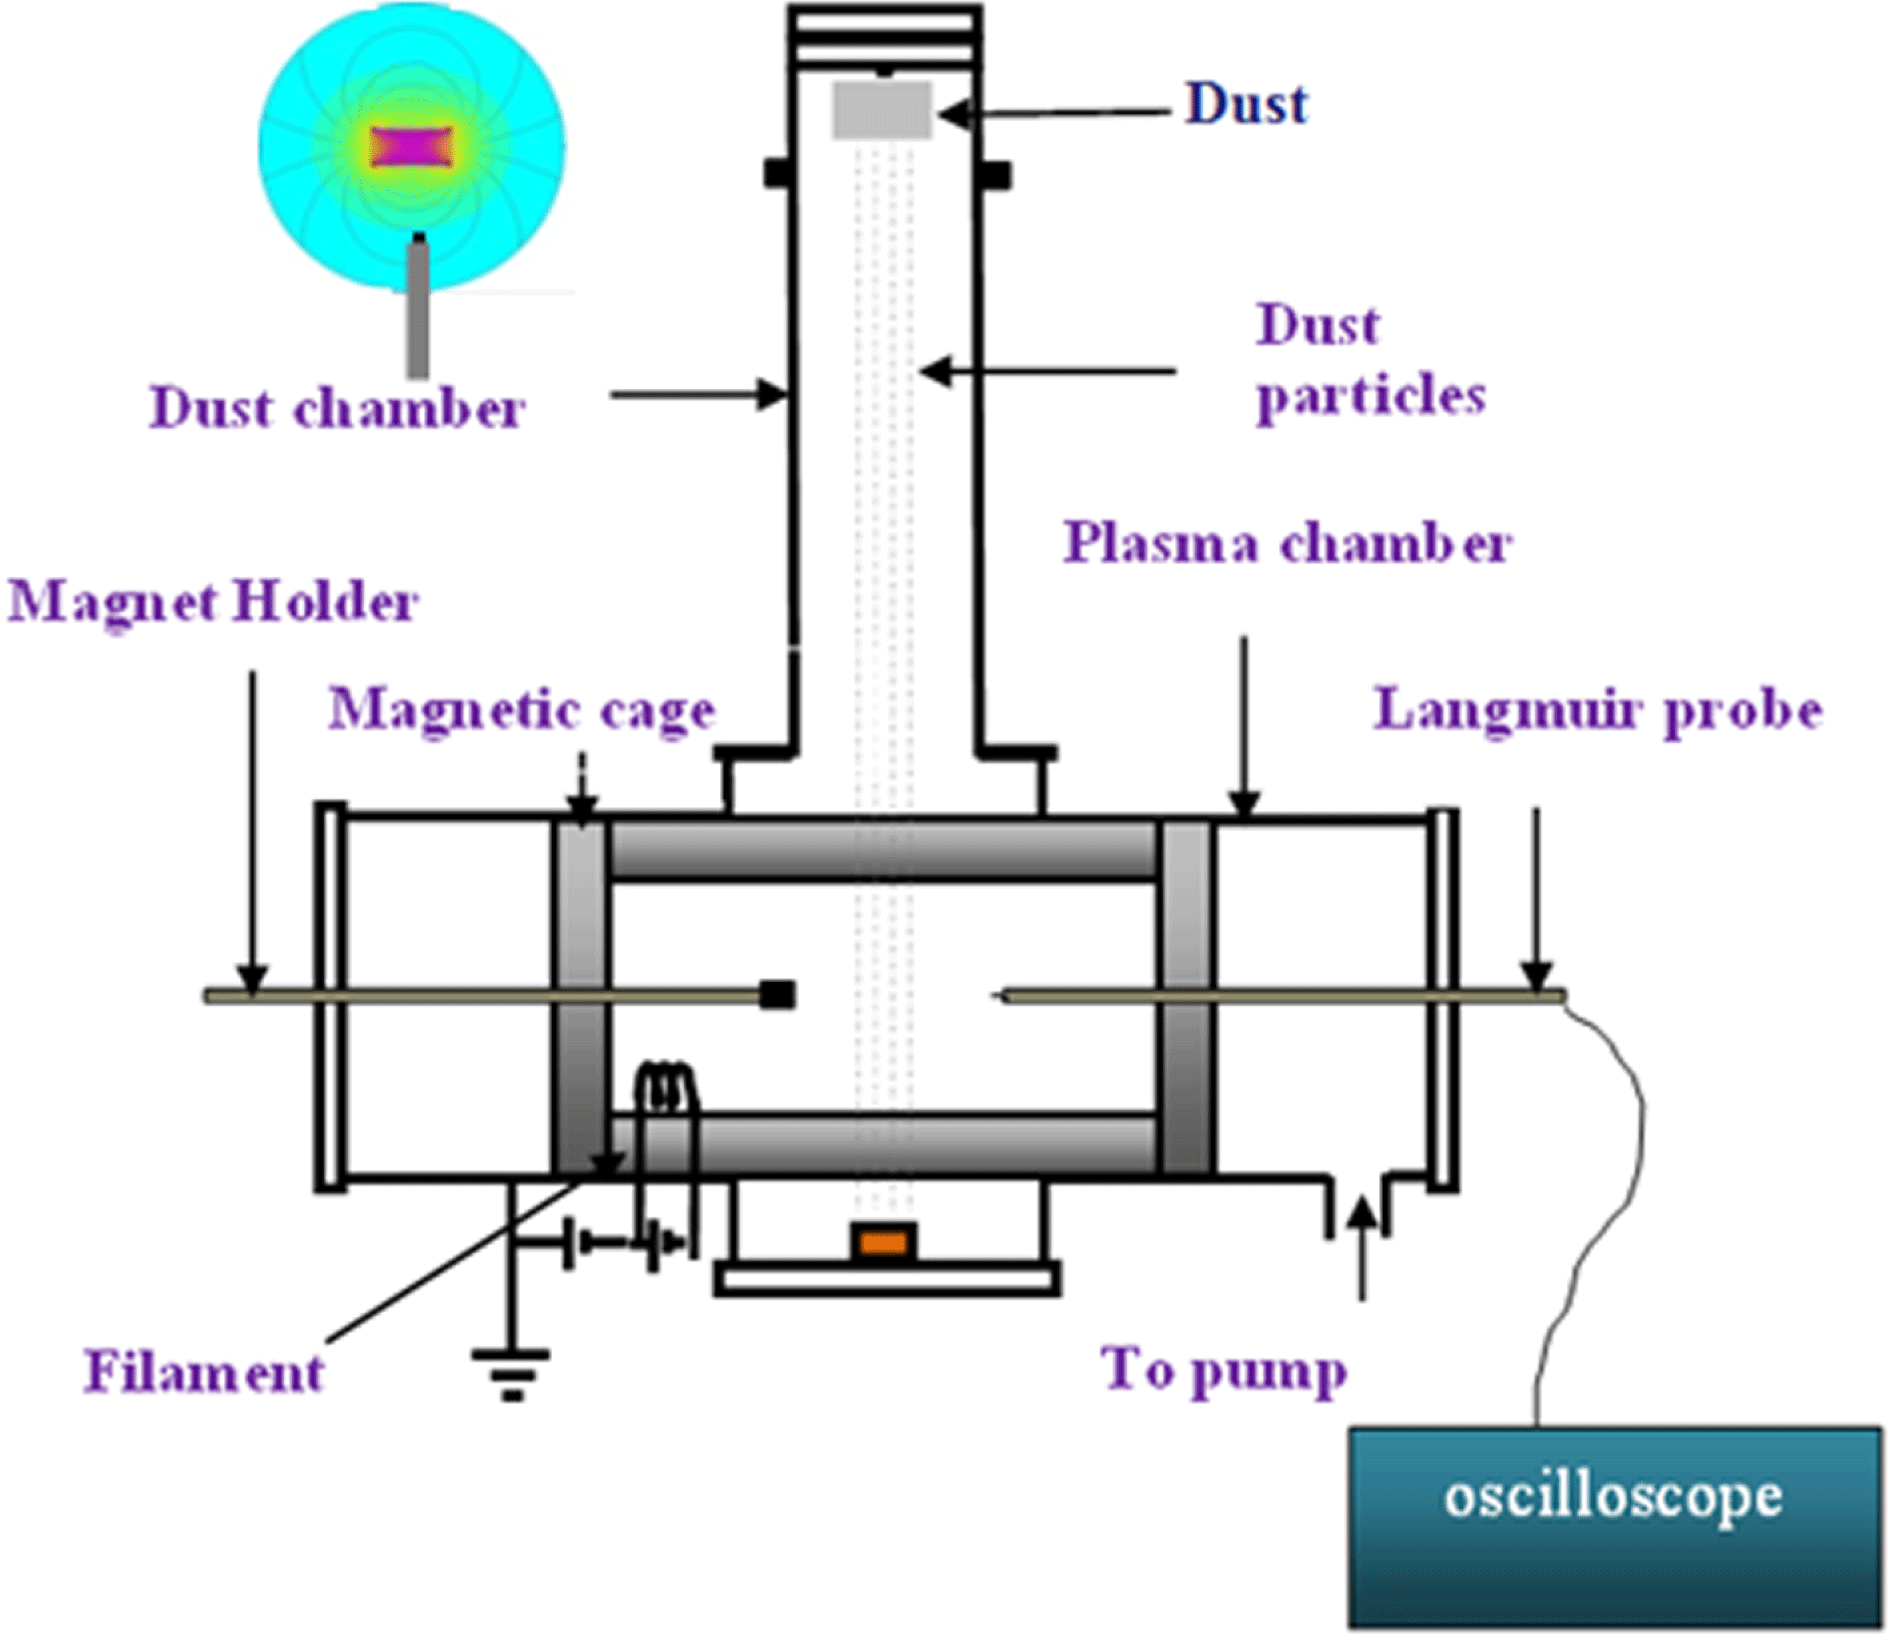
Figure 1. A schematic of the plasma production set-up with the diagnostic tools.
2 Experimental set-up
Figure 1 represents the schematic of the high vacuum multi-dipole dusty plasma generation set-up, used to perform the experiment (Kakati et al. Reference Kakati, Kausik, Saikia and Bandyopadhyay2011, Reference Kakati, Kausik, Saikia, Bandyopadhyay and Saxena2014b ). The device has twin stainless steel chambers placed one upon the other. The horizontal chamber is the plasma production chamber which is cylindrical, 100.0 cm in length by 30.0 cm in diameter, and is made of stainless steel (SS) (Kalita et al. Reference Kalita, Kakati, Kausik, Saikia and Bandyopadhyay2018). The vertical cylindrical chamber is actually the dust chamber of height 72.0 cm and diameter 15.0 cm. Inside the dust chamber, a dust dropper is fitted at the top flange to drip dust particles into the plasma volume.
A base pressure of
![]() ${\sim}10^{-4}$
Pa is created using a combination of a diffusion pump
${\sim}10^{-4}$
Pa is created using a combination of a diffusion pump
![]() $(1000~\text{l}~\text{s}^{-1})$
and a rotary pump
$(1000~\text{l}~\text{s}^{-1})$
and a rotary pump
![]() $(600~\text{l}~\text{min}^{-1})$
. To create the hydrogen plasma, ultra-pure hydrogen gas is fed into the plasma chamber using a digital flow controller. The operating pressure is kept at
$(600~\text{l}~\text{min}^{-1})$
. To create the hydrogen plasma, ultra-pure hydrogen gas is fed into the plasma chamber using a digital flow controller. The operating pressure is kept at
![]() $4\times 10^{-2}$
Pa during the experimental observation. Hydrogen plasma is generated by the hot cathode filament discharge method. For the emission of necessary primary electrons, we have applied currents of magnitude
$4\times 10^{-2}$
Pa during the experimental observation. Hydrogen plasma is generated by the hot cathode filament discharge method. For the emission of necessary primary electrons, we have applied currents of magnitude
![]() ${\sim}12$
A through two thoriated tungsten filaments of diameter 0.25 mm. The discharge is produced inside the chamber by striking the incandescent tungsten filaments (cathode) and the grounded magnetic cage (anode). To confine the hydrogen plasma, we have used a full line cusped cylindrical shaped magnetic cage with a length of 40.0 cm and diameter of 30.0 cm. The cage is made of SS channels filled with cuboidal strontium ferrite magnets having a surface field strength of approximately 120 milliTesla (mT) each (Kakati et al.
Reference Kakati, Kausik, Saikia and Bandyopadhyay2011). An identical magnet is placed on a magnetic holder as shown in figure 1. The pole orientation of that magnet is shown in an inset of figure 1. A permanent magnet whose field strength
${\sim}12$
A through two thoriated tungsten filaments of diameter 0.25 mm. The discharge is produced inside the chamber by striking the incandescent tungsten filaments (cathode) and the grounded magnetic cage (anode). To confine the hydrogen plasma, we have used a full line cusped cylindrical shaped magnetic cage with a length of 40.0 cm and diameter of 30.0 cm. The cage is made of SS channels filled with cuboidal strontium ferrite magnets having a surface field strength of approximately 120 milliTesla (mT) each (Kakati et al.
Reference Kakati, Kausik, Saikia and Bandyopadhyay2011). An identical magnet is placed on a magnetic holder as shown in figure 1. The pole orientation of that magnet is shown in an inset of figure 1. A permanent magnet whose field strength
![]() ${\sim}120$
mT is fixed at only one end of a SS rod of diameter 5.0 mm. It is positioned in close vicinity to the Langmuir probe in such a way that the field lines are perpendicular to the collecting (Langmuir) probe (shown in figure 1).
${\sim}120$
mT is fixed at only one end of a SS rod of diameter 5.0 mm. It is positioned in close vicinity to the Langmuir probe in such a way that the field lines are perpendicular to the collecting (Langmuir) probe (shown in figure 1).
A Hiden Analytical Langmuir probe system is used as a diagnostic tool for the characterization of the electron/ion densities of the plasma as well as to record the plasma oscillation. The Langmuir probe tip (diameter
![]() ${\sim}0.15$
mm) is oriented in such a way that the tip is transverse to the direction of the magnetic field lines. The magnetic field strength varies for different distances with respect to the magnet and it is measured with a gauss meter based on the Hall probe method. The plasma parameters and oscillations are measured at different axial locations of the chamber away from the magnet. For different distances i.e. for 1.0–6.0 cm, the magnetic field strengths vary from 59.4 to 3.2 mT. The variation of the magnetic field strength at various positions of the magnet can be found in our earlier publication (Kalita et al.
Reference Kalita, Kakati, Saikia, Bandyopadhyay and Kausik2015).
${\sim}0.15$
mm) is oriented in such a way that the tip is transverse to the direction of the magnetic field lines. The magnetic field strength varies for different distances with respect to the magnet and it is measured with a gauss meter based on the Hall probe method. The plasma parameters and oscillations are measured at different axial locations of the chamber away from the magnet. For different distances i.e. for 1.0–6.0 cm, the magnetic field strengths vary from 59.4 to 3.2 mT. The variation of the magnetic field strength at various positions of the magnet can be found in our earlier publication (Kalita et al.
Reference Kalita, Kakati, Saikia, Bandyopadhyay and Kausik2015).
A digitizing storage oscilloscope (make: Tektronix, model: MDO3054) is used to measure the plasma oscillation which is connected with the Langmuir probe system through a co-axial cable. The data obtained are then transferred to a personal computer for further analysis. A fast Fourier transformation (FFT) of the recorded data is carried out to evaluate the dominant frequency coupled with the plasma oscillation. The dominant peak associated with the plasma oscillation is measured for different dust densities.
In the present work, tungsten dust of diameter
![]() ${\sim}$
(3–6)
${\sim}$
(3–6)
![]() $\unicode[STIX]{x03BC}\text{m}$
is used for the experiment. These dust particles are dropped into the plasma chamber right from the top of the vertical chamber as shown in figure 1. The dust particles are put into a cylindrical container with a mesh made of stainless steel at the lowest part. The container is mechanically coupled with a direct current (DC) motor to vibrate it and allow dropping of the dust particles. The input voltage applied to the DC motor is varied and the vibration frequency of the dust dropper can be controlled, which in turn changes the dust dropping rate. The dust density for different working conditions is measured using a common technique i.e. the laser scattering method (Nakamura Reference Nakamura2002). In this work, the variation of dust density is from
$\unicode[STIX]{x03BC}\text{m}$
is used for the experiment. These dust particles are dropped into the plasma chamber right from the top of the vertical chamber as shown in figure 1. The dust particles are put into a cylindrical container with a mesh made of stainless steel at the lowest part. The container is mechanically coupled with a direct current (DC) motor to vibrate it and allow dropping of the dust particles. The input voltage applied to the DC motor is varied and the vibration frequency of the dust dropper can be controlled, which in turn changes the dust dropping rate. The dust density for different working conditions is measured using a common technique i.e. the laser scattering method (Nakamura Reference Nakamura2002). In this work, the variation of dust density is from
![]() $1\times 10^{11}~\text{m}^{-3}$
to
$1\times 10^{11}~\text{m}^{-3}$
to
![]() $7\times 10^{11}~\text{m}^{-3}$
. The dust density is continuously checked to confirm the constant dust falling rate all through measurement.
$7\times 10^{11}~\text{m}^{-3}$
. The dust density is continuously checked to confirm the constant dust falling rate all through measurement.
3 Experimental results
The Langmuir probe measurements are carried out near the magnet placed by the magnetic holder. As the electrons are highly influenced by the magnetic field, the accurate measurement of charged particle density, such as electron density, from the Langmuir probe’s electron saturation current in a weakly magnetized plasma is very difficult. The present experiment is conducted for study of the variation of electron density at different magnetic field strengths (for different positions from the magnet) for different dust densities.
The electron density,
![]() $n_{e}$
is estimated from the electron saturation current,
$n_{e}$
is estimated from the electron saturation current,
![]() $I_{is}$
obtained from the
$I_{is}$
obtained from the
![]() $I$
–
$I$
–
![]() $V$
curves of the Langmuir probe using the following formula (Kagan & Perel Reference Kagan and Perel1964).
$V$
curves of the Langmuir probe using the following formula (Kagan & Perel Reference Kagan and Perel1964).
where
![]() $A_{p}$
is the area of the Langmuir probe,
$A_{p}$
is the area of the Langmuir probe,
![]() $e$
is the electron charge and
$e$
is the electron charge and
![]() $m_{e}$
is the electron mass,
$m_{e}$
is the electron mass,
![]() $T_{e}$
is electron temperature,
$T_{e}$
is electron temperature,
![]() $I(V_{p})$
is the electron saturation current at plasma potential.
$I(V_{p})$
is the electron saturation current at plasma potential.
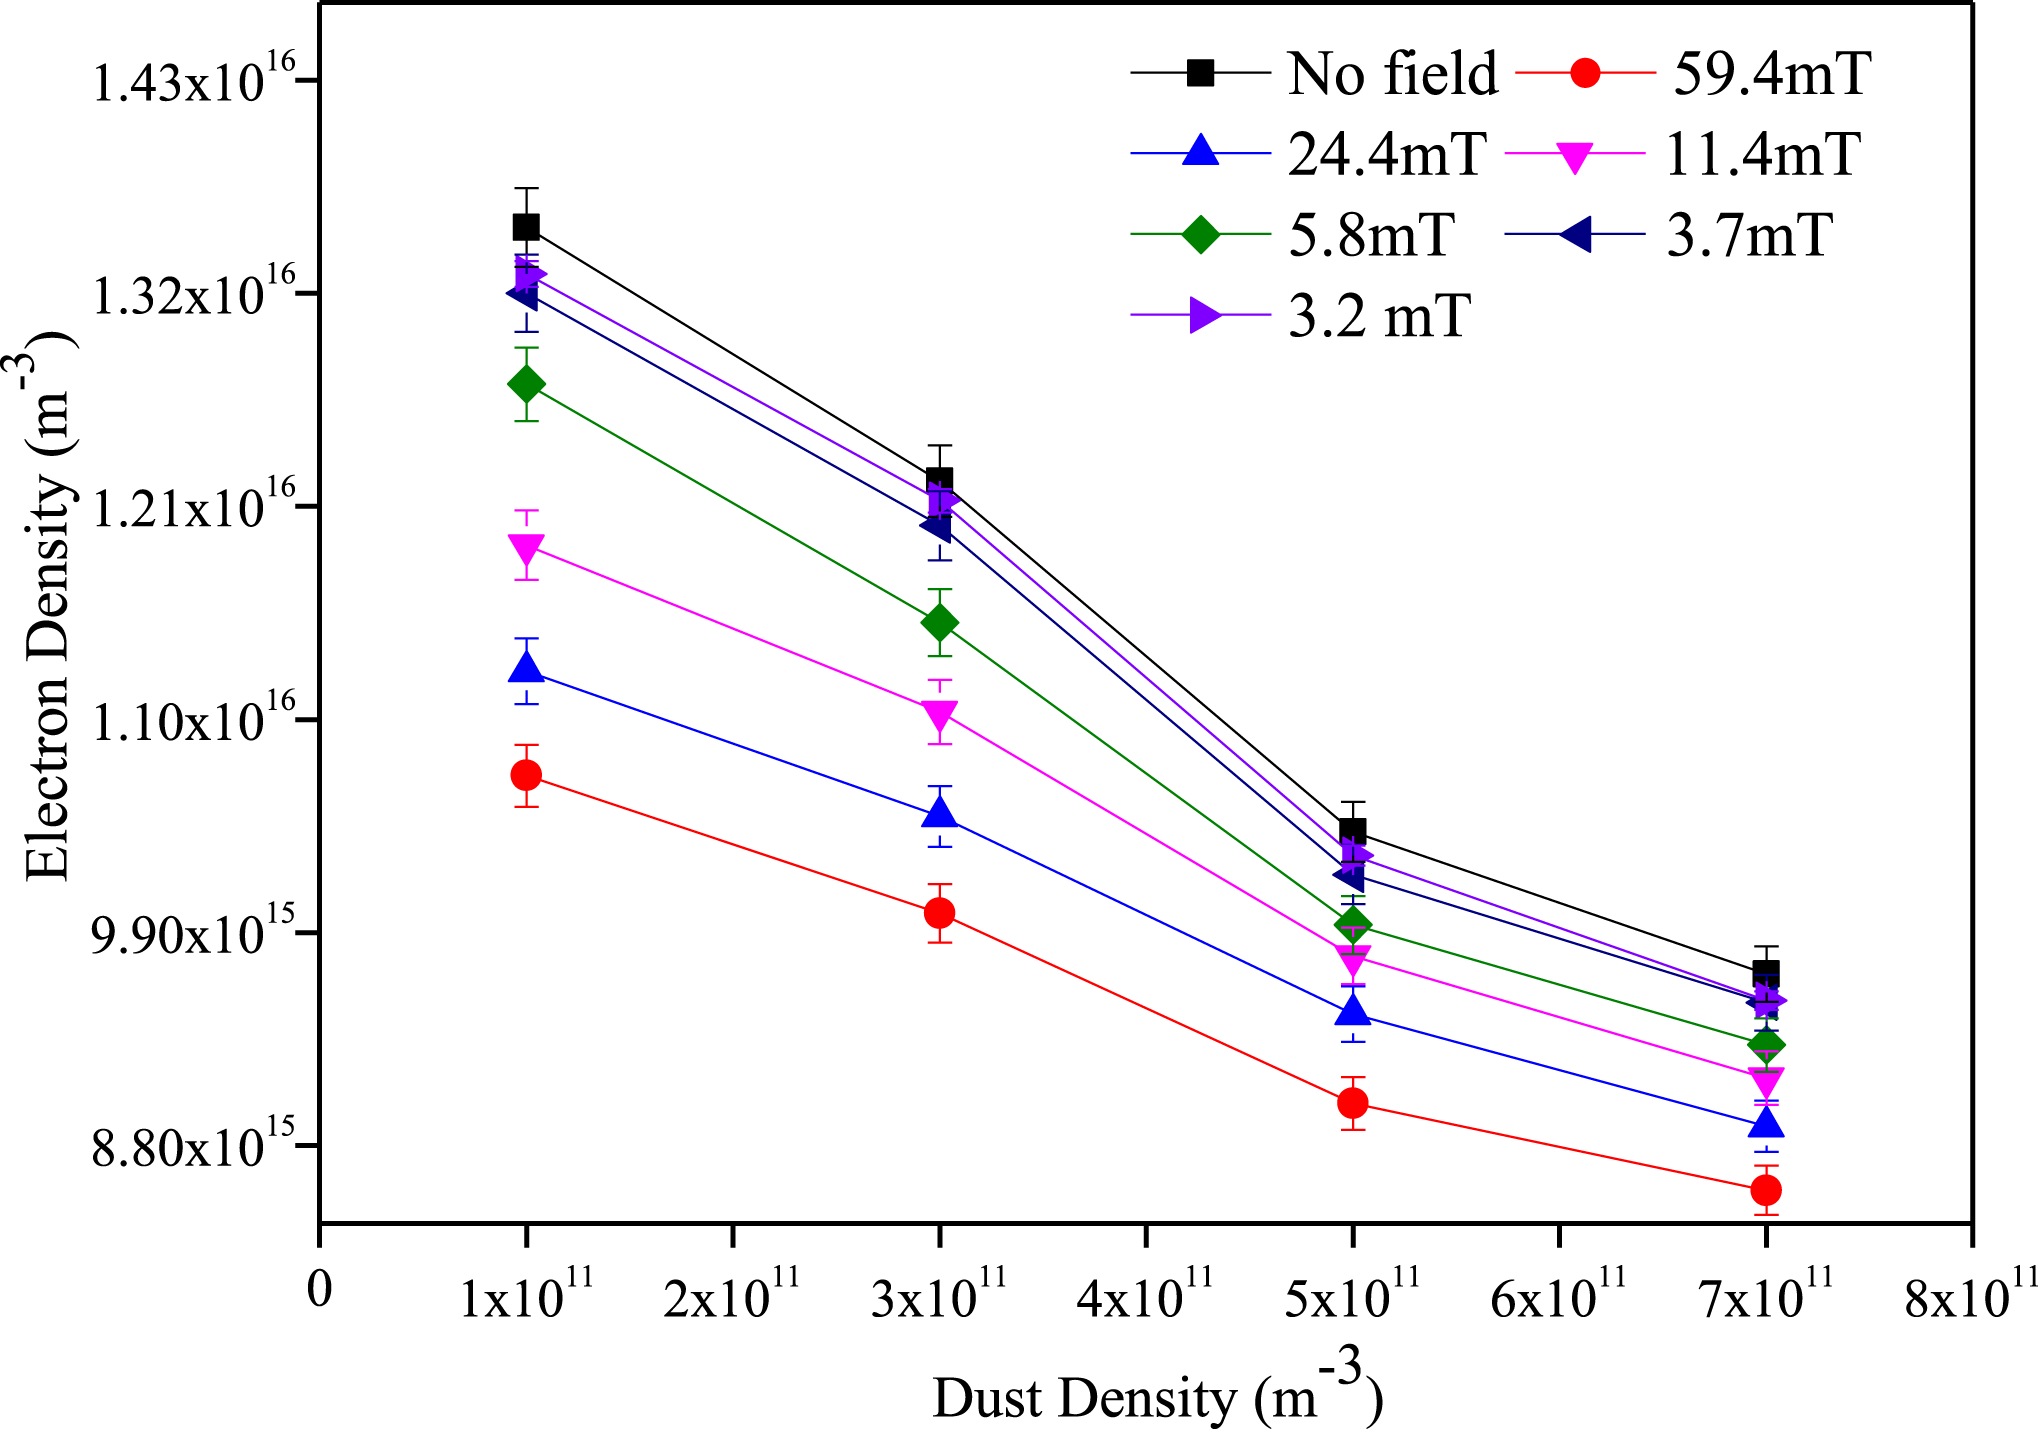
Figure 2. Electron density versus dust density for different magnetic field strengths.
The detailed procedure for the measurement of electron density from the
![]() $I$
–
$I$
–
![]() $V$
curve is explained in our earlier publication (Kalita et al.
Reference Kalita, Kakati, Saikia, Bandyopadhyay and Kausik2015). As the plasma density in the present work is of the order of
$V$
curve is explained in our earlier publication (Kalita et al.
Reference Kalita, Kakati, Saikia, Bandyopadhyay and Kausik2015). As the plasma density in the present work is of the order of
![]() $10^{16}~\text{m}^{-3}$
and the working pressure is
$10^{16}~\text{m}^{-3}$
and the working pressure is
![]() $4\times 10^{-2}$
Pa, the sheath around the biased probe is so thin that the area of the sheath edge is essentially the same as the area of the probe tip itself. Thus, the difficulties of charge collection by the probe due to sheath thickness do not arise in our case. Figure 2 shows the electron density profile at different dust densities and magnetic field strengths for constant discharge voltage of 80 V. It is seen that for strong magnetic fields (
$4\times 10^{-2}$
Pa, the sheath around the biased probe is so thin that the area of the sheath edge is essentially the same as the area of the probe tip itself. Thus, the difficulties of charge collection by the probe due to sheath thickness do not arise in our case. Figure 2 shows the electron density profile at different dust densities and magnetic field strengths for constant discharge voltage of 80 V. It is seen that for strong magnetic fields (
![]() $B=59.4$
mT), the electron density measured by the Langmuir probe is very low as compared to that without any magnetic field for the entire dust density range. The measured electron density shows almost identical results at very low magnetic field strength (i.e.
$B=59.4$
mT), the electron density measured by the Langmuir probe is very low as compared to that without any magnetic field for the entire dust density range. The measured electron density shows almost identical results at very low magnetic field strength (i.e.
![]() $B<5.8$
mT) with the results of the electron density for a hydrogen plasma without a magnetic field for the entire dust density range. Due to the presence of a magnetic field, the collection of charged particles by the Langmuir probe is inadequate because of the orbital effect. This decrease of the collected electrons/ions is signified by a factor
$B<5.8$
mT) with the results of the electron density for a hydrogen plasma without a magnetic field for the entire dust density range. Due to the presence of a magnetic field, the collection of charged particles by the Langmuir probe is inadequate because of the orbital effect. This decrease of the collected electrons/ions is signified by a factor
![]() $\unicode[STIX]{x1D6FD}$
which is defined as the ratio of the radius of the probe (
$\unicode[STIX]{x1D6FD}$
which is defined as the ratio of the radius of the probe (
![]() $r_{p}$
) to the mean Larmor gyroradius (
$r_{p}$
) to the mean Larmor gyroradius (
![]() $r_{L}$
) of the charged particle.
$r_{L}$
) of the charged particle.
The impact of magnetic fields on the measurement of plasma parameters using a Langmuir probe depends on field strength (
![]() $B$
) and on
$B$
) and on
![]() $r_{p}$
. Due to the gyration of electrons in a magnetic field, the electron saturation current becomes (Stangeby Reference Stangeby1982)
$r_{p}$
. Due to the gyration of electrons in a magnetic field, the electron saturation current becomes (Stangeby Reference Stangeby1982)
Here
![]() $I_{0}=-\frac{1}{4}n_{e0}\boldsymbol{v}_{e}eA_{p}$
is the current for electrons and
$I_{0}=-\frac{1}{4}n_{e0}\boldsymbol{v}_{e}eA_{p}$
is the current for electrons and
![]() $n_{e0}$
is the electron density for no magnetic field case,
$n_{e0}$
is the electron density for no magnetic field case,
![]() $\bar{v}_{e}$
is the mean velocity of electrons. The parameter,
$\bar{v}_{e}$
is the mean velocity of electrons. The parameter,
![]() $\unicode[STIX]{x1D6FF}$
is the reduction factor due to the application of a magnetic field. Due to the higher reduction factor at high field strength, the measured electron density is found to be very low as compared to the results for the no magnetic field case. A detailed explanation on the effect of electron density at different magnetic fields is described in our earlier publication (Kalita et al.
Reference Kalita, Kakati, Saikia, Bandyopadhyay and Kausik2015).
$\unicode[STIX]{x1D6FF}$
is the reduction factor due to the application of a magnetic field. Due to the higher reduction factor at high field strength, the measured electron density is found to be very low as compared to the results for the no magnetic field case. A detailed explanation on the effect of electron density at different magnetic fields is described in our earlier publication (Kalita et al.
Reference Kalita, Kakati, Saikia, Bandyopadhyay and Kausik2015).
On the other hand, figure 2 shows that the electron density decreases with increasing dust density for the entire magnetic field range. The decrease in electron density is associated with the dust charging. With the increase in dust density, the loss of bulk plasma density i.e. electron and ion density, also increases as dust particles are good attractors of electrons and ions.
Here, the EEPF is studied for different dust densities at different magnetic fields. The EEPF,
![]() $f_{p}(\unicode[STIX]{x1D700})$
, is obtained from the second-order differentiation of the probe’s current–voltage characteristic using the relation
$f_{p}(\unicode[STIX]{x1D700})$
, is obtained from the second-order differentiation of the probe’s current–voltage characteristic using the relation
where,
![]() $I_{p}$
is the electron probe current,
$I_{p}$
is the electron probe current,
![]() $V$
is the probe potential with respect to the plasma potential and
$V$
is the probe potential with respect to the plasma potential and
![]() $\unicode[STIX]{x1D700}$
is the kinetic energy of the electrons.
$\unicode[STIX]{x1D700}$
is the kinetic energy of the electrons.
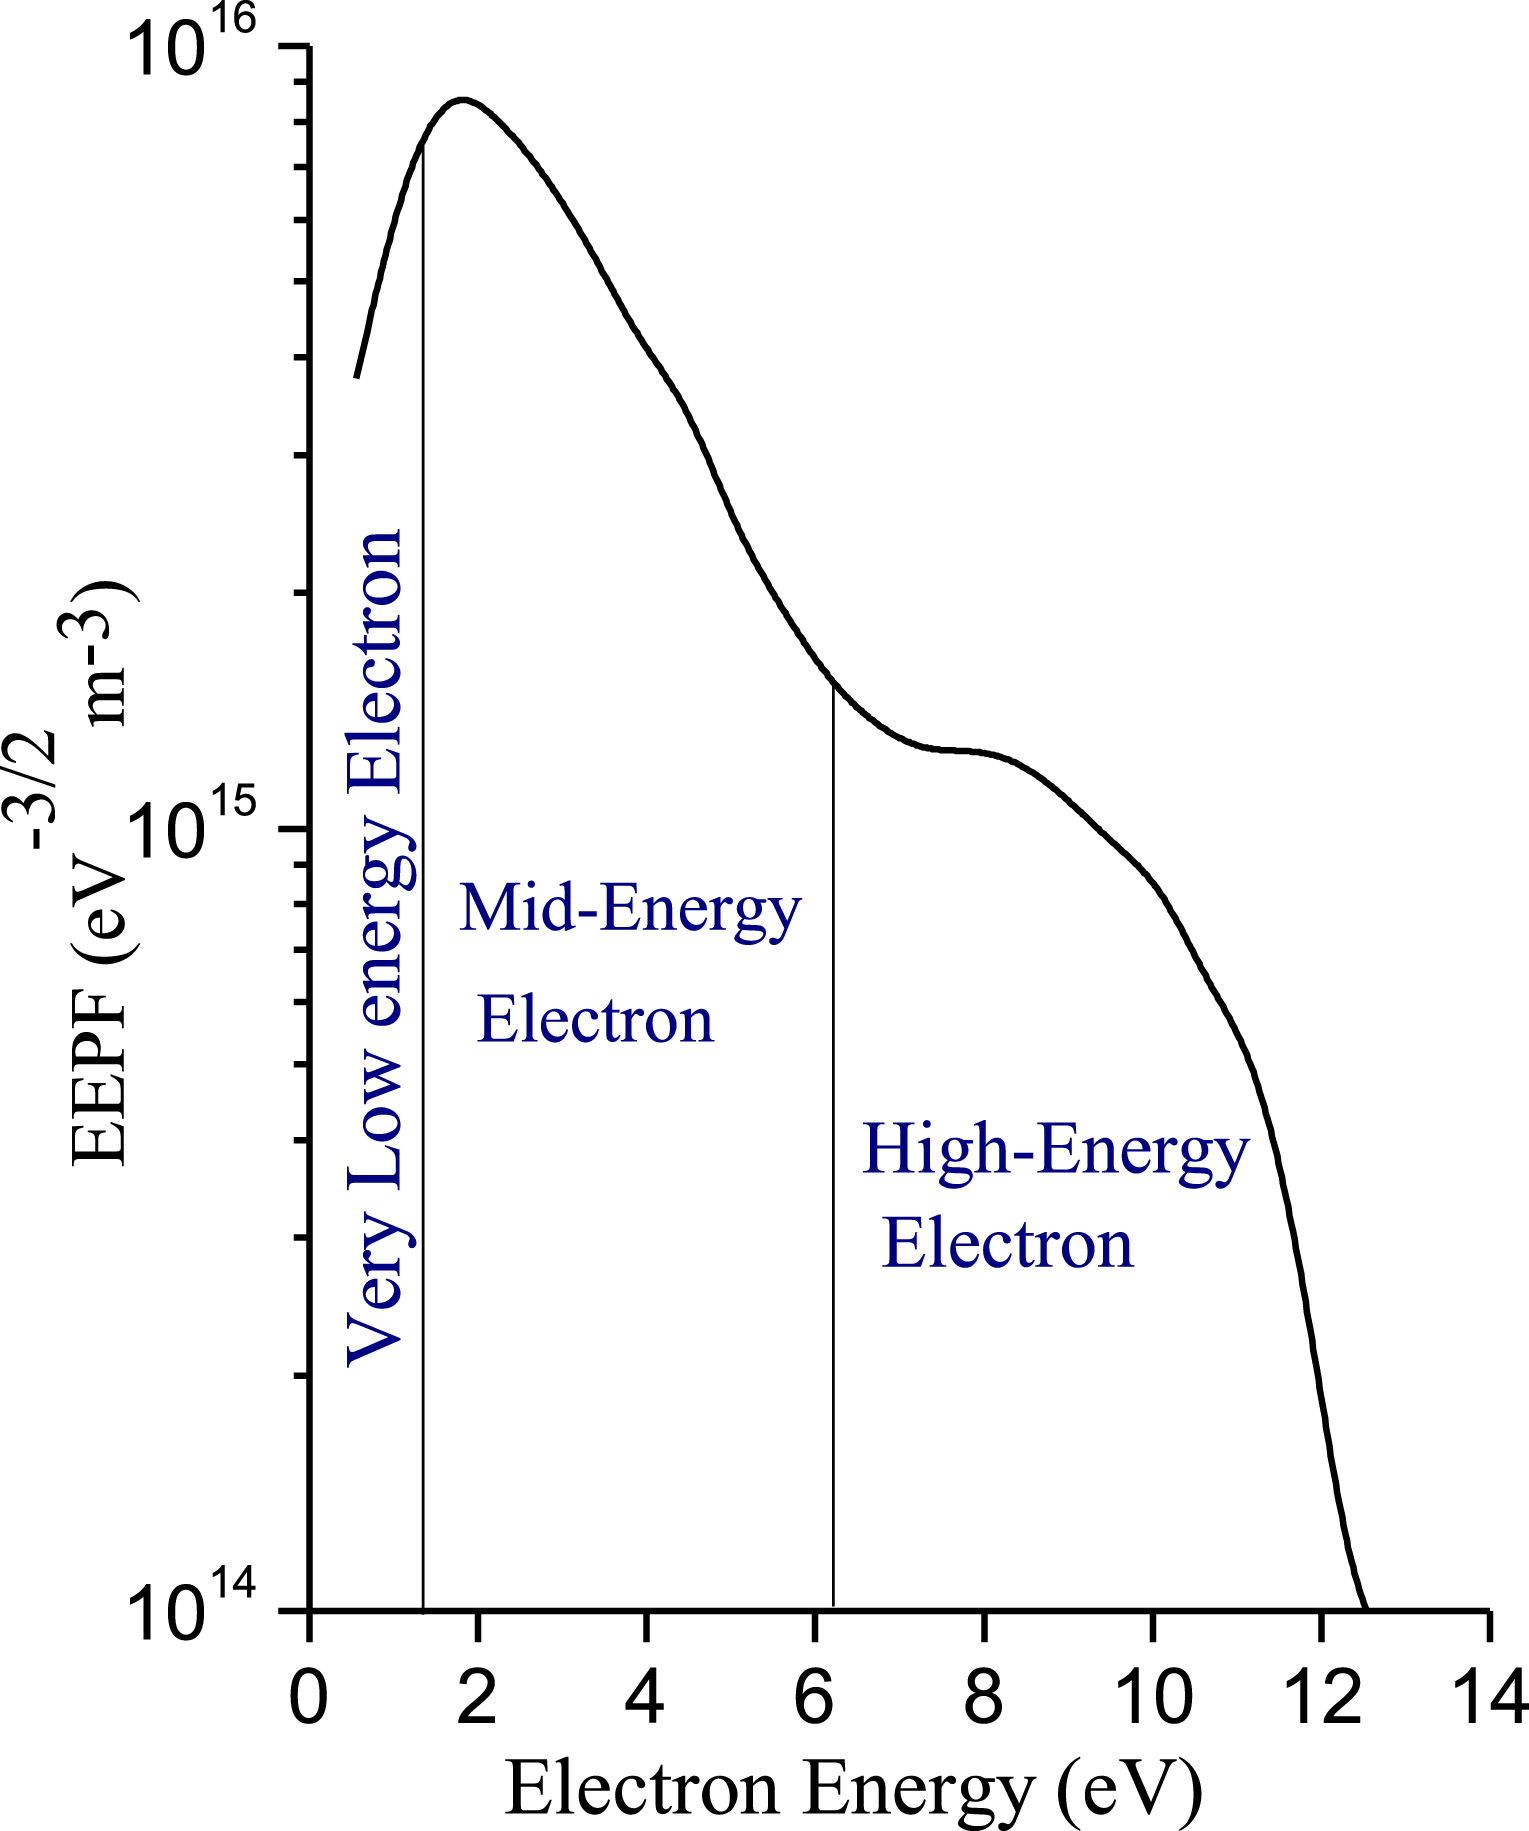
In case of a bi-Maxwellian EEPF, normally two distinct electron populations, low and high energy electron populations, are observed. The different electron populations that can be visualized in the case of a bi-Maxwellian distribution are shown in figure 3.
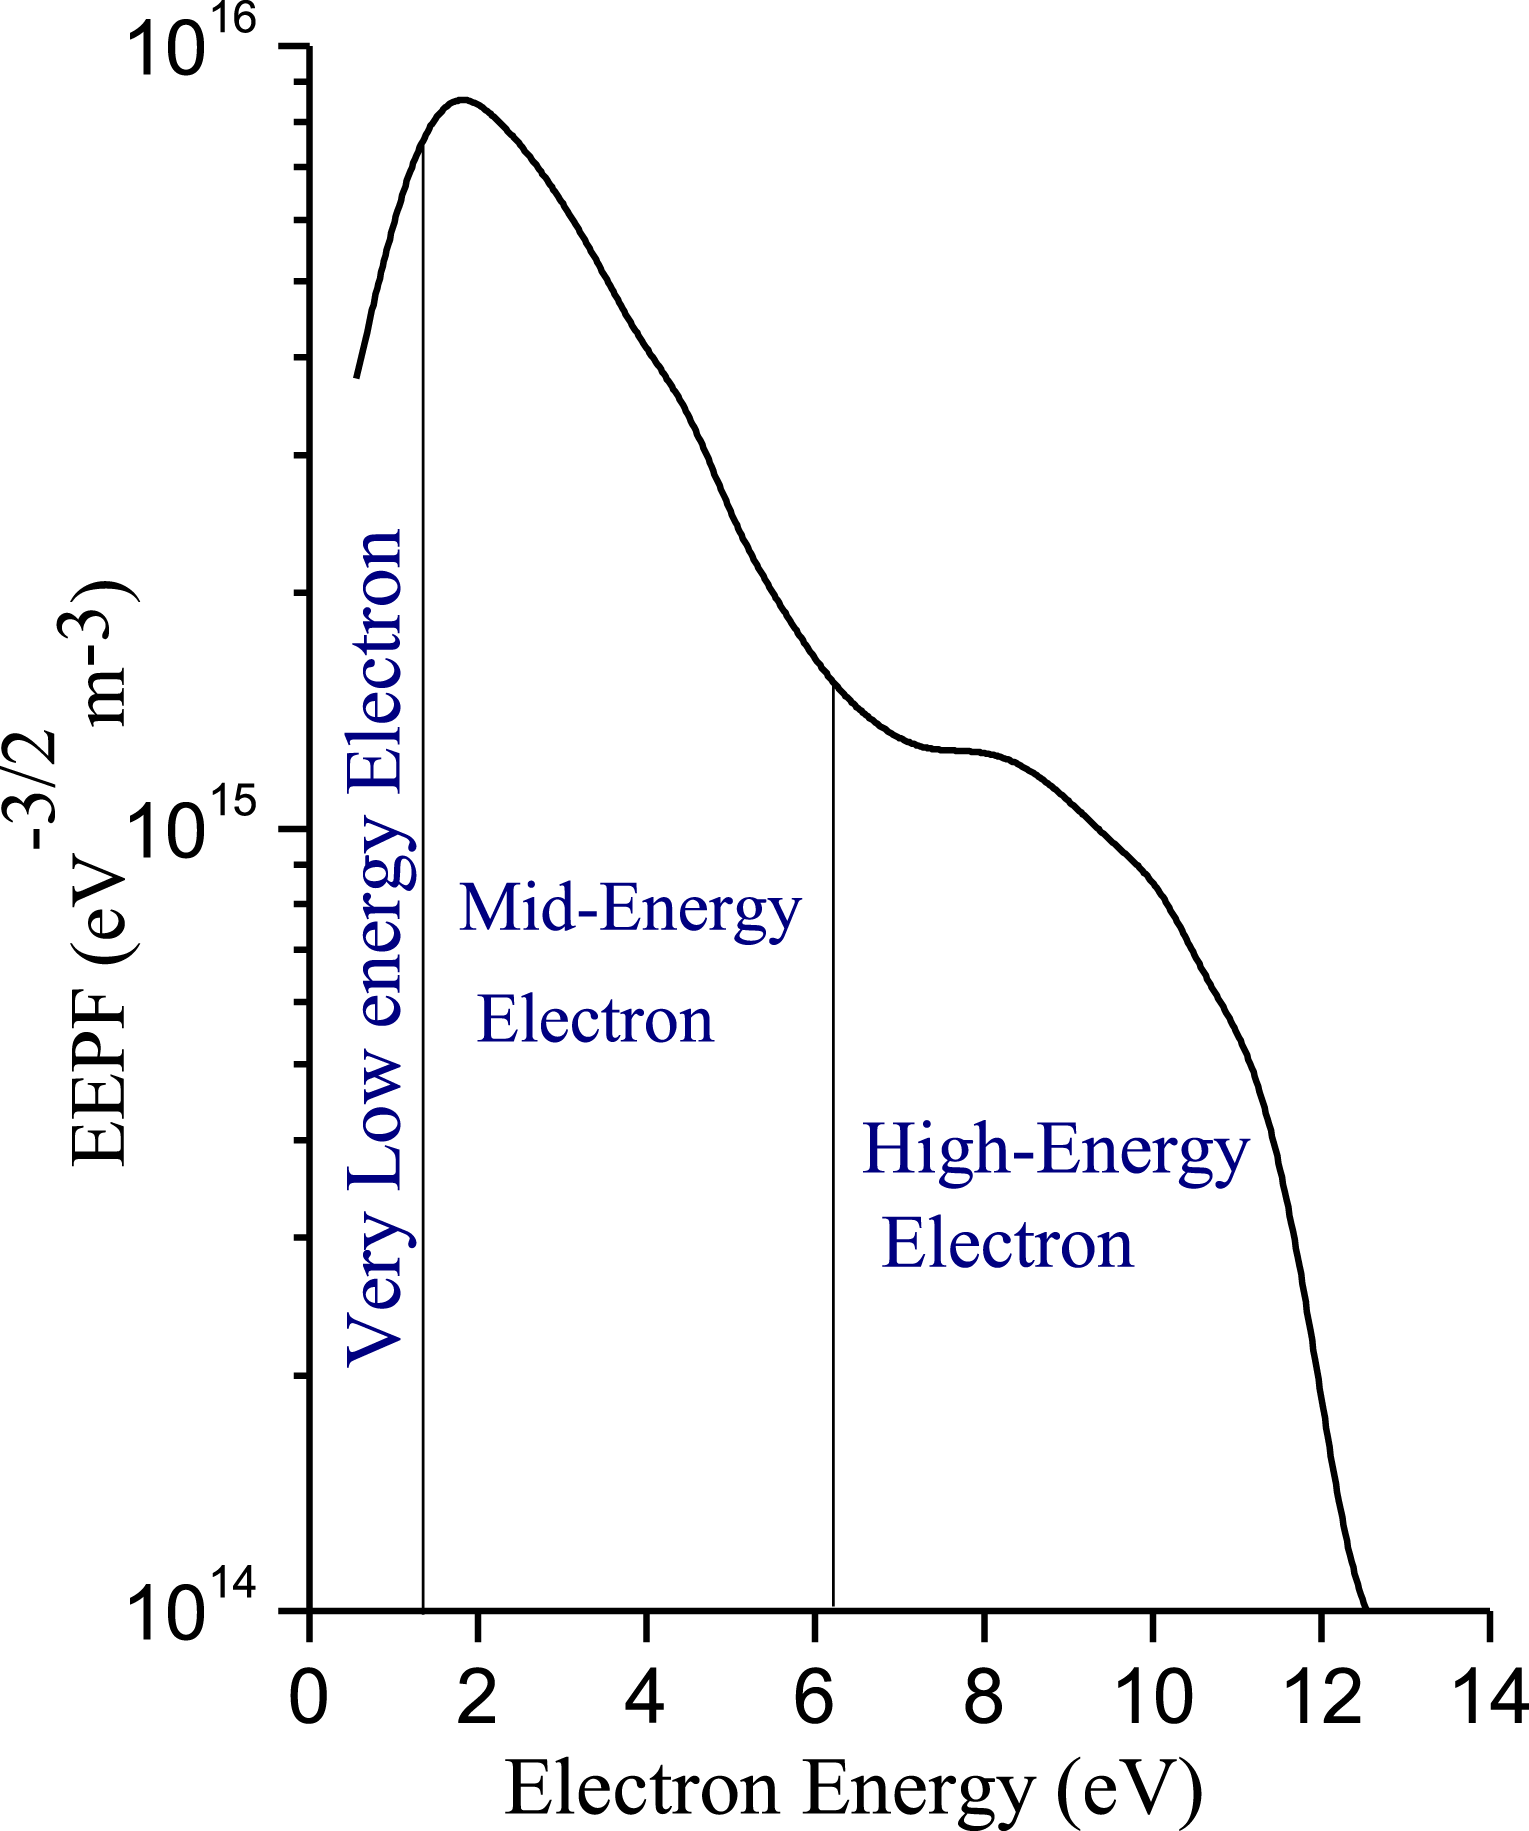
Figure 3. A bi-Maxwellian EEPF representing different regions of energy levels.
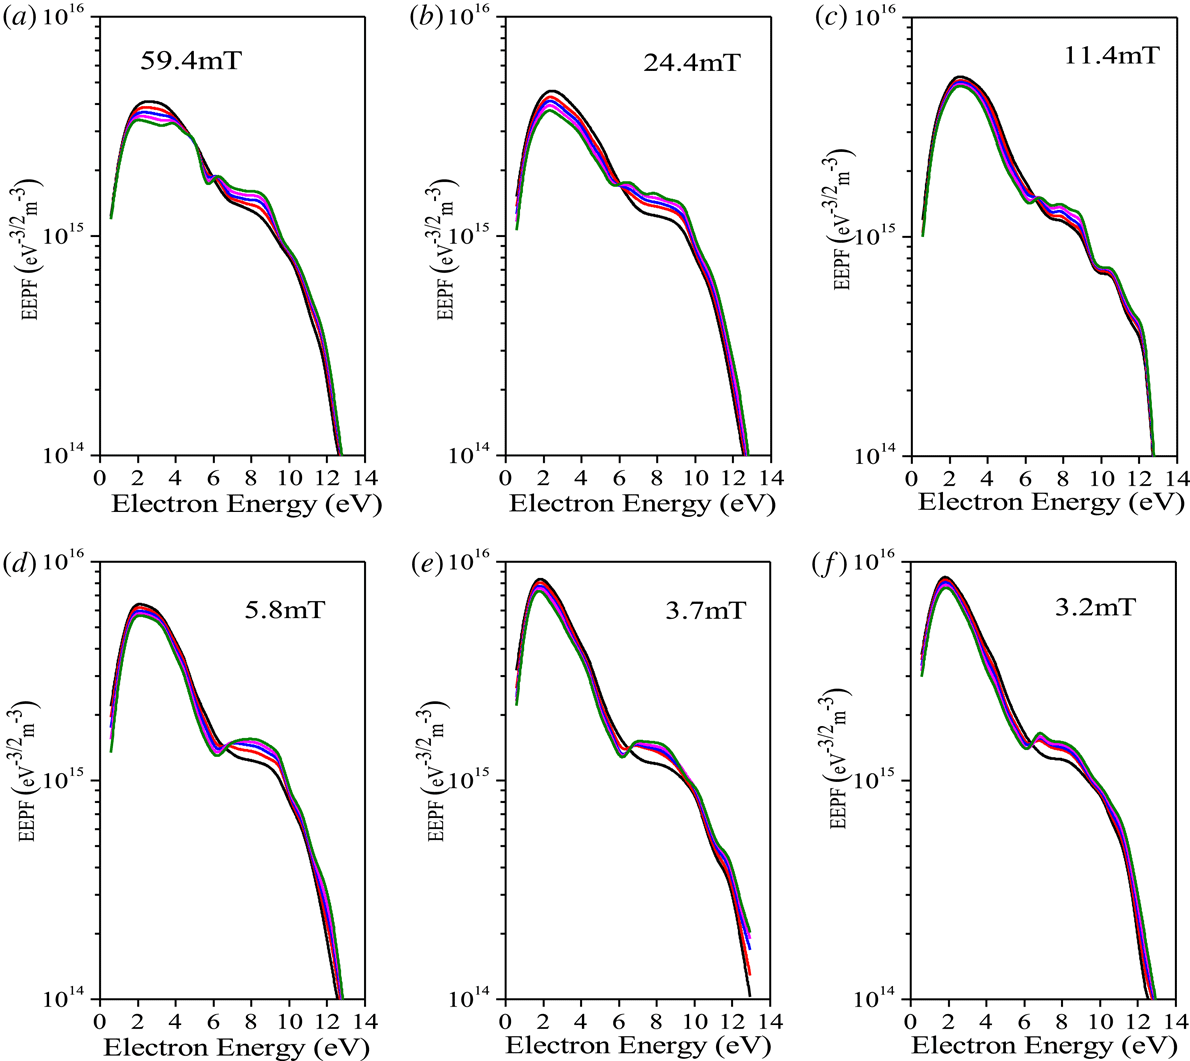
Figure 4 shows the measured EEPFs for both a pristine and dust-containing hydrogen plasma at different magnetic fields. Bi-Maxwellian EEPFs are obtained for both cases at different magnetic field strengths. It has been found that as the magnetic field increases, the number of electrons in the lower range decreases. The lower energy electron represents both very low and mid energy electrons. The depletion of the lower energy electron population at high magnetic field strength is associated with the higher reduction factor due to the lower Larmor radius of electrons as compared to the probe radius. The population of low energy electrons shows almost the same results at
![]() $B\leqslant 3.7$
mT. But, the electron population in the tail region of the EEPF shows nearly the same results up to a magnetic field strength of 5.8 mT. At different dust densities, the EEPF shows an almost bi-Maxwellian structure for the whole magnetic field range. We found that the number of mid energy electrons slightly decreases with a slight increase of high energy electrons for a dusty plasma as compared with the non-dusty plasma. The very low energy electron population is found to have no effect for the dust density. As the dust density increases the mid energy electron population further decreases whilst there occurs a mere increase in the high energy electron population for different magnetic fields. But, we found negligible variations in very low energy electrons for dust in the plasma. The decrease of bulk electron peak i.e. mid energy electron peak in the presence of dust particles is believed to be mainly triggered by the dust particles’ capability to collect electrons. At higher dust densities, the mid energy range of the EEPFs is decreased due to significant losses of electrons in the plasma. This reflects that the mid energy electrons are mainly responsible for dust charging. As the dust particle is charged negatively in the plasma, the low energy electrons cannot reach the dust surface due to the electrostatic repulsion. It is to be noted that very few electrons with sufficient energy can overcome the electrostatic repulsion (dust surface potential) to reach the dust particles, i.e. electrons with
$B\leqslant 3.7$
mT. But, the electron population in the tail region of the EEPF shows nearly the same results up to a magnetic field strength of 5.8 mT. At different dust densities, the EEPF shows an almost bi-Maxwellian structure for the whole magnetic field range. We found that the number of mid energy electrons slightly decreases with a slight increase of high energy electrons for a dusty plasma as compared with the non-dusty plasma. The very low energy electron population is found to have no effect for the dust density. As the dust density increases the mid energy electron population further decreases whilst there occurs a mere increase in the high energy electron population for different magnetic fields. But, we found negligible variations in very low energy electrons for dust in the plasma. The decrease of bulk electron peak i.e. mid energy electron peak in the presence of dust particles is believed to be mainly triggered by the dust particles’ capability to collect electrons. At higher dust densities, the mid energy range of the EEPFs is decreased due to significant losses of electrons in the plasma. This reflects that the mid energy electrons are mainly responsible for dust charging. As the dust particle is charged negatively in the plasma, the low energy electrons cannot reach the dust surface due to the electrostatic repulsion. It is to be noted that very few electrons with sufficient energy can overcome the electrostatic repulsion (dust surface potential) to reach the dust particles, i.e. electrons with
![]() $(m_{e}v_{e}^{2}/2)>(m_{e}v_{\min }^{2}/2)=-e\unicode[STIX]{x1D719}_{p}$
are able to hit the dust particle where
$(m_{e}v_{e}^{2}/2)>(m_{e}v_{\min }^{2}/2)=-e\unicode[STIX]{x1D719}_{p}$
are able to hit the dust particle where
![]() $v_{\min }=\sqrt{-2e\unicode[STIX]{x1D719}_{p}/m_{e}}$
. Here
$v_{\min }=\sqrt{-2e\unicode[STIX]{x1D719}_{p}/m_{e}}$
. Here
![]() $v_{e}$
and
$v_{e}$
and
![]() $\unicode[STIX]{x1D719}_{p}$
are velocity of the electron, and dust grain surface potential, respectively. From the theoretical estimation, it is found that the dust surface potential for our present experimental condition is
$\unicode[STIX]{x1D719}_{p}$
are velocity of the electron, and dust grain surface potential, respectively. From the theoretical estimation, it is found that the dust surface potential for our present experimental condition is
![]() ${\leqslant}-2$
volt (Kalita et al.
Reference Kalita, Kakati, Kausik, Saikia and Bandyopadhyay2018). So, the electrons with energy
${\leqslant}-2$
volt (Kalita et al.
Reference Kalita, Kakati, Kausik, Saikia and Bandyopadhyay2018). So, the electrons with energy
![]() ${\leqslant}$
2 eV are repelled by the charged dust particles. This causes hardly any change in the low energy electron population with dust particles for the entire dust density range.
${\leqslant}$
2 eV are repelled by the charged dust particles. This causes hardly any change in the low energy electron population with dust particles for the entire dust density range.

Figure 4. EEPFs for different magnetic field strengths with different dust densities (black line
![]() $=$
no dust; red
$=$
no dust; red
![]() $\text{line}=1\times 10^{11}~\text{m}^{-3}$
; blue
$\text{line}=1\times 10^{11}~\text{m}^{-3}$
; blue
![]() $\text{line}=3\times 10^{11}~\text{m}^{-3}$
, pink
$\text{line}=3\times 10^{11}~\text{m}^{-3}$
, pink
![]() $\text{line}=5\times 10^{11}~\text{m}^{-3}$
; green
$\text{line}=5\times 10^{11}~\text{m}^{-3}$
; green
![]() $\text{line}=7\times 10^{11}~\text{m}^{-3}$
).
$\text{line}=7\times 10^{11}~\text{m}^{-3}$
).
The increase of the tail electrons (high energy electrons in the EEPF) under dust infusion is associated with a rise of the electric field (
![]() $E_{p}$
) sustaining the plasma. Fluid simulation has revealed that the electric field is stronger in a dusty plasma compared to a pristine plasma (Ostrikov et al.
Reference Ostrikov, Denysenko, Yu and Xu2005). This can be associated with the collection of bulk electrons (i.e. mid energy range) by the dust on their grain surfaces. In the complex plasma, there is a higher number of bulk electrons lost for sufficiently increasing dust densities as compared to the pristine region due to inelastic electron-d-ust collisions, the total loss of bulk electrons collected by the dust particles increases. To compensate for the additional loss of electrons within the plasma system, the high energy electron population increases with the increase of dust density. This increase of electrons is accompanied by an increase of electric field. Thus, with an increase in dust density, the high energy electron population in the EEPF increases.
$E_{p}$
) sustaining the plasma. Fluid simulation has revealed that the electric field is stronger in a dusty plasma compared to a pristine plasma (Ostrikov et al.
Reference Ostrikov, Denysenko, Yu and Xu2005). This can be associated with the collection of bulk electrons (i.e. mid energy range) by the dust on their grain surfaces. In the complex plasma, there is a higher number of bulk electrons lost for sufficiently increasing dust densities as compared to the pristine region due to inelastic electron-d-ust collisions, the total loss of bulk electrons collected by the dust particles increases. To compensate for the additional loss of electrons within the plasma system, the high energy electron population increases with the increase of dust density. This increase of electrons is accompanied by an increase of electric field. Thus, with an increase in dust density, the high energy electron population in the EEPF increases.
The bi-Maxwellian EEPFs can be characterized by a lower energy electron density and high energy electron density. For simplicity, the very low energy and mid energy electron densities are considered as a lower energy electron density. The local electron density,
![]() $n_{e}$
can be calculated from
$n_{e}$
can be calculated from
![]() $f_{p}$
, using (Godyak & Demidov Reference Godyak and Demidov2011).
$f_{p}$
, using (Godyak & Demidov Reference Godyak and Demidov2011).
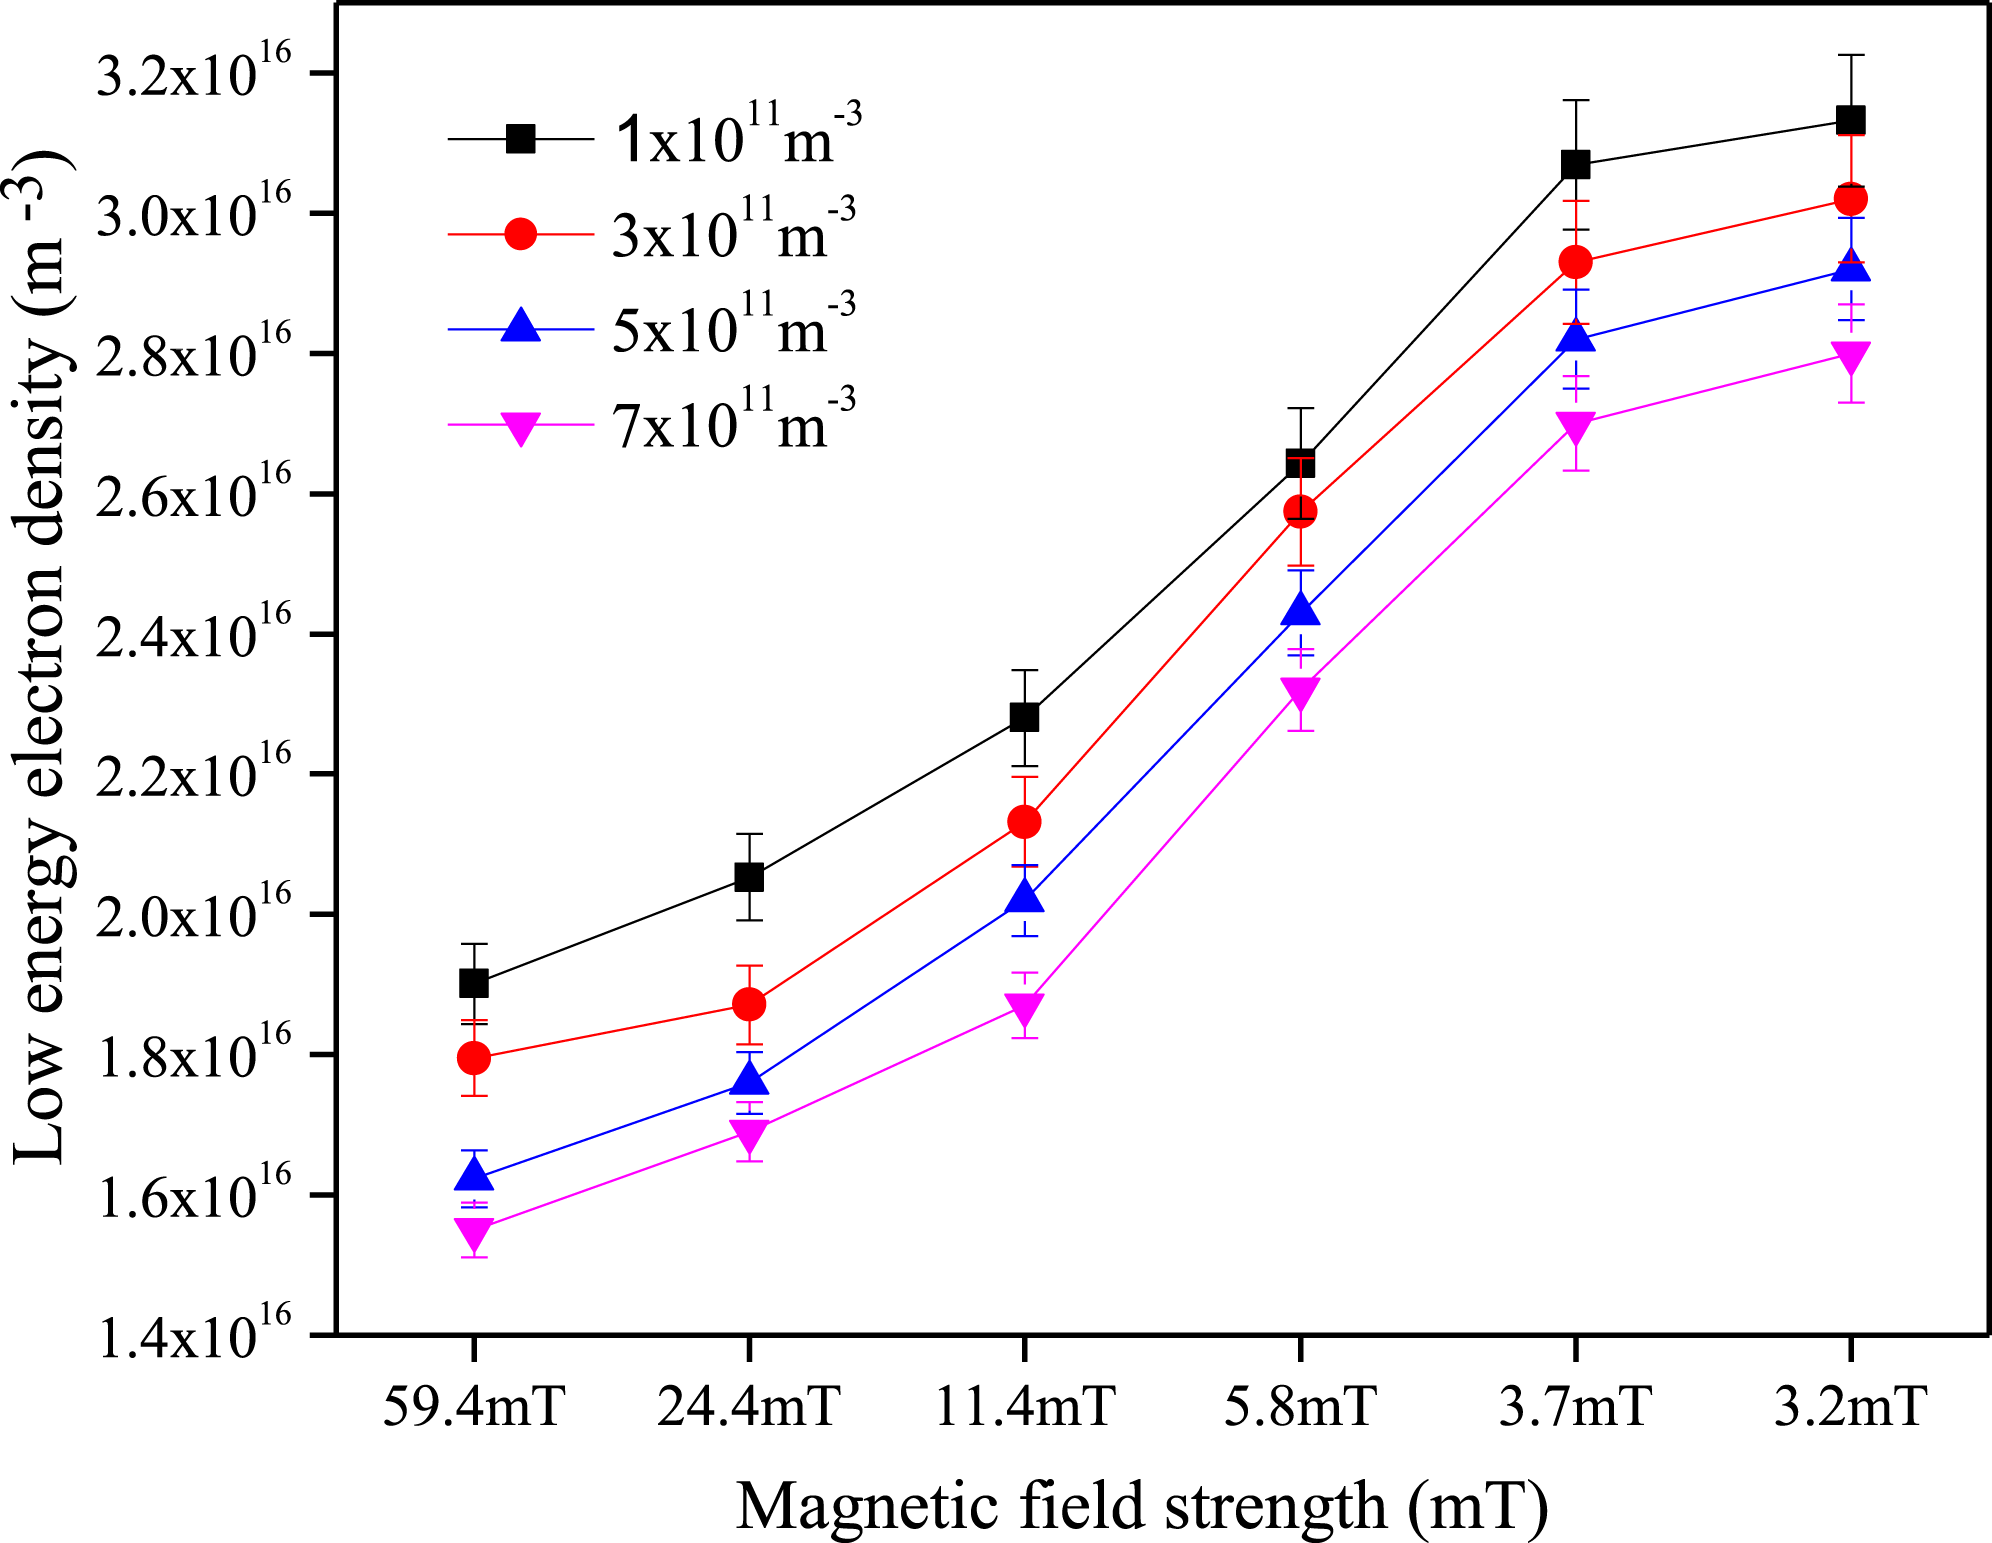
The lower and higher energetic electron densities are derived from the area under the curve of the EEPF. From the measured EEPFs, the lower energetic electron density is evaluated for different dust densities within the magnetic field range of 59.4–3.2 mT which is shown in figure 5. The lower energetic electron density from the EEPF decreases with the increase of dust density. The decrease in density is because of the collection of electrons by the dust grains.
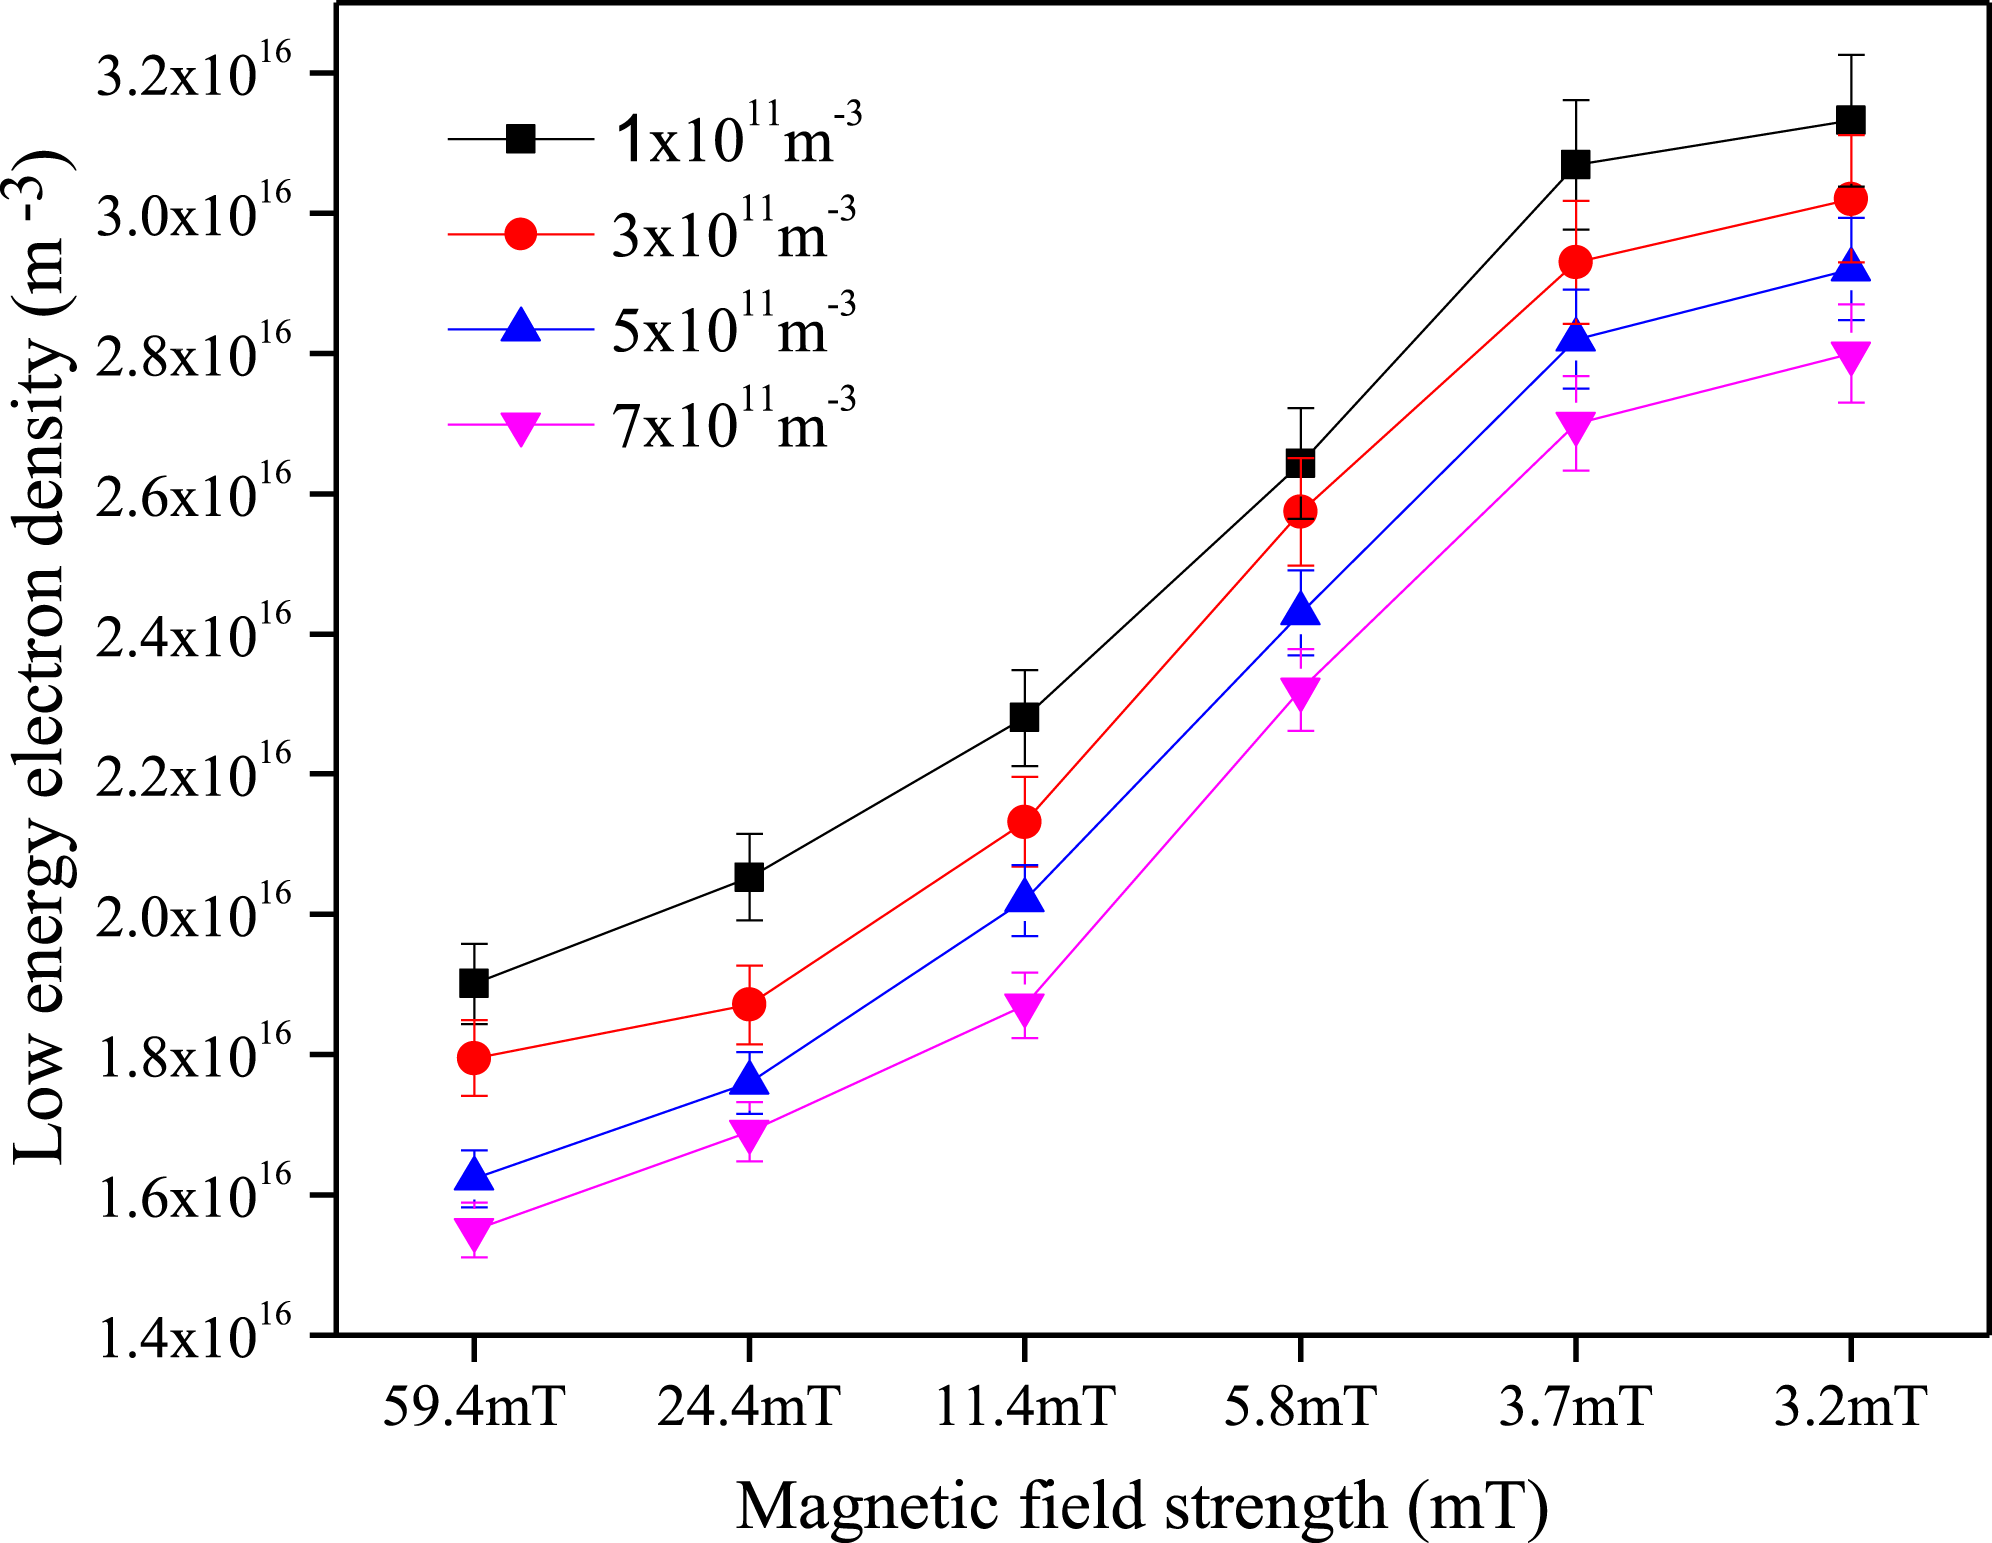
Figure 5. Low energy electron density versus magnetic field strengths for different dust densities.
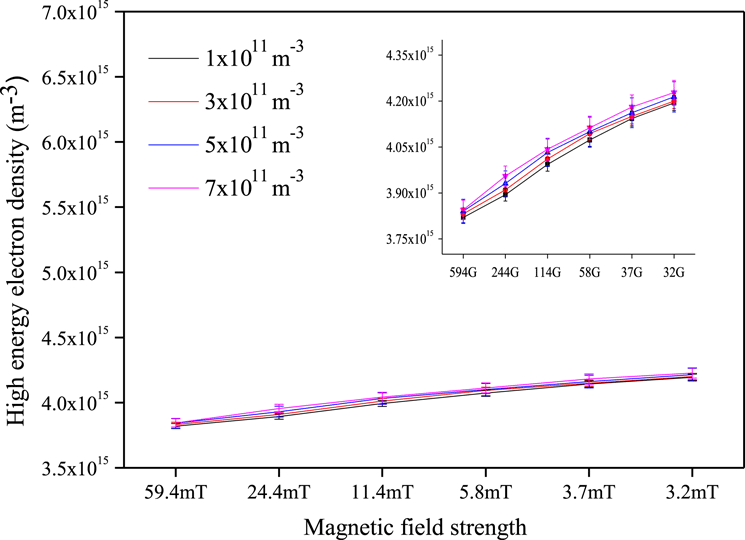
Figure 6 shows the evaluation of high energy electron density from the tail region of the bi-Maxwellian curve for different dust densities. From the figure, the variation of highly energetic electron density increases slightly with changes in dust density. There is very little increase in the high energy electron density with a decrease of the magnetic field strength.
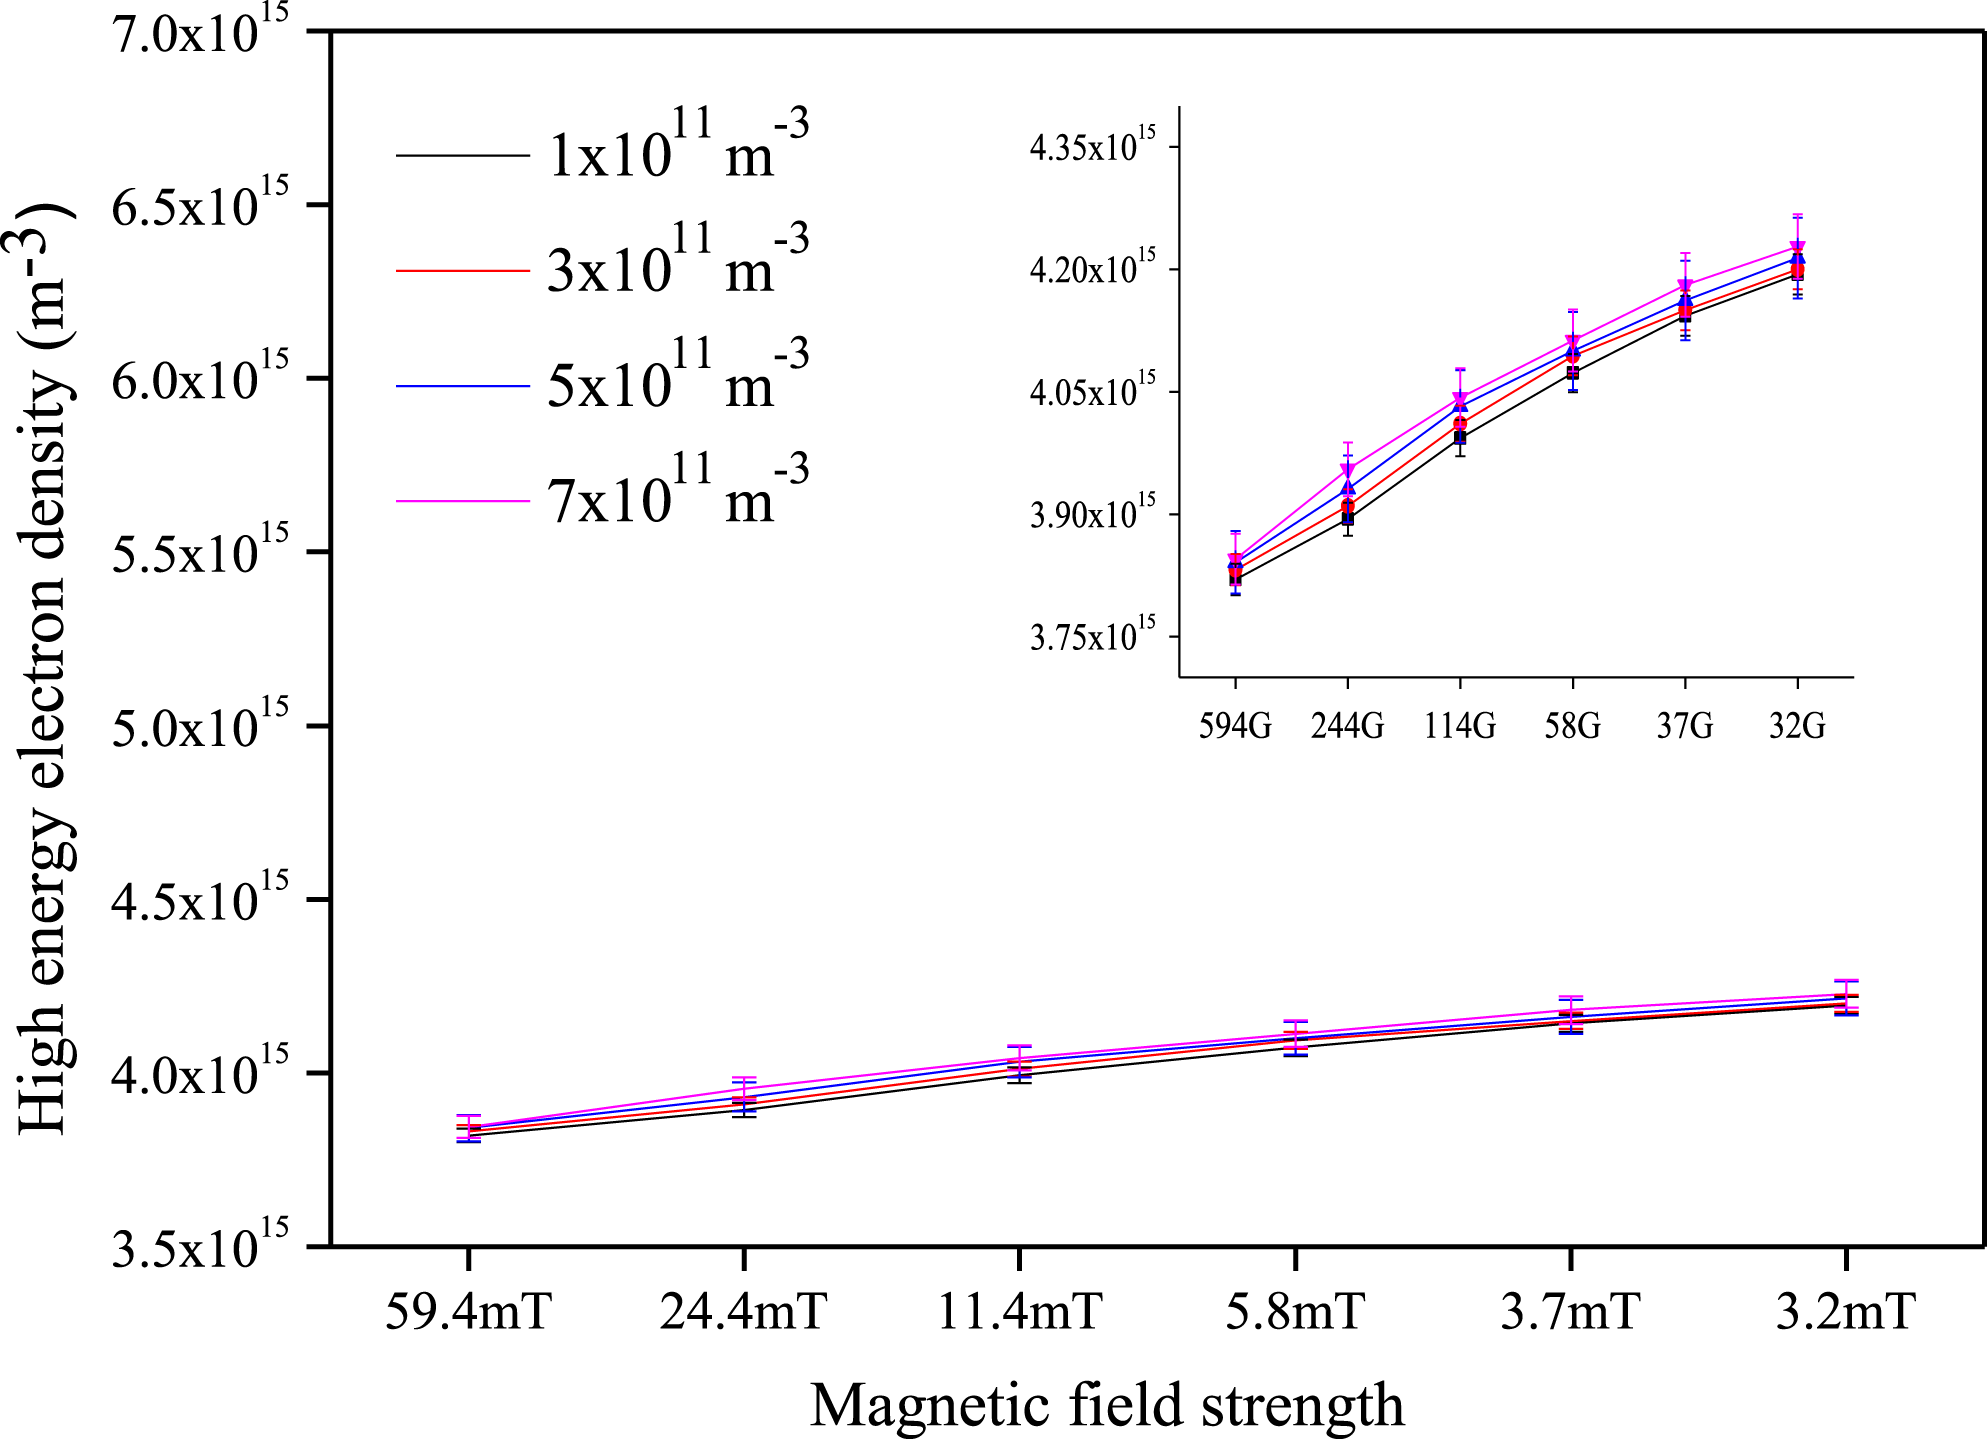
Figure 6. High energy electron density versus magnetic field strength for different dust densities. (Enlarged view is given in the inset.)
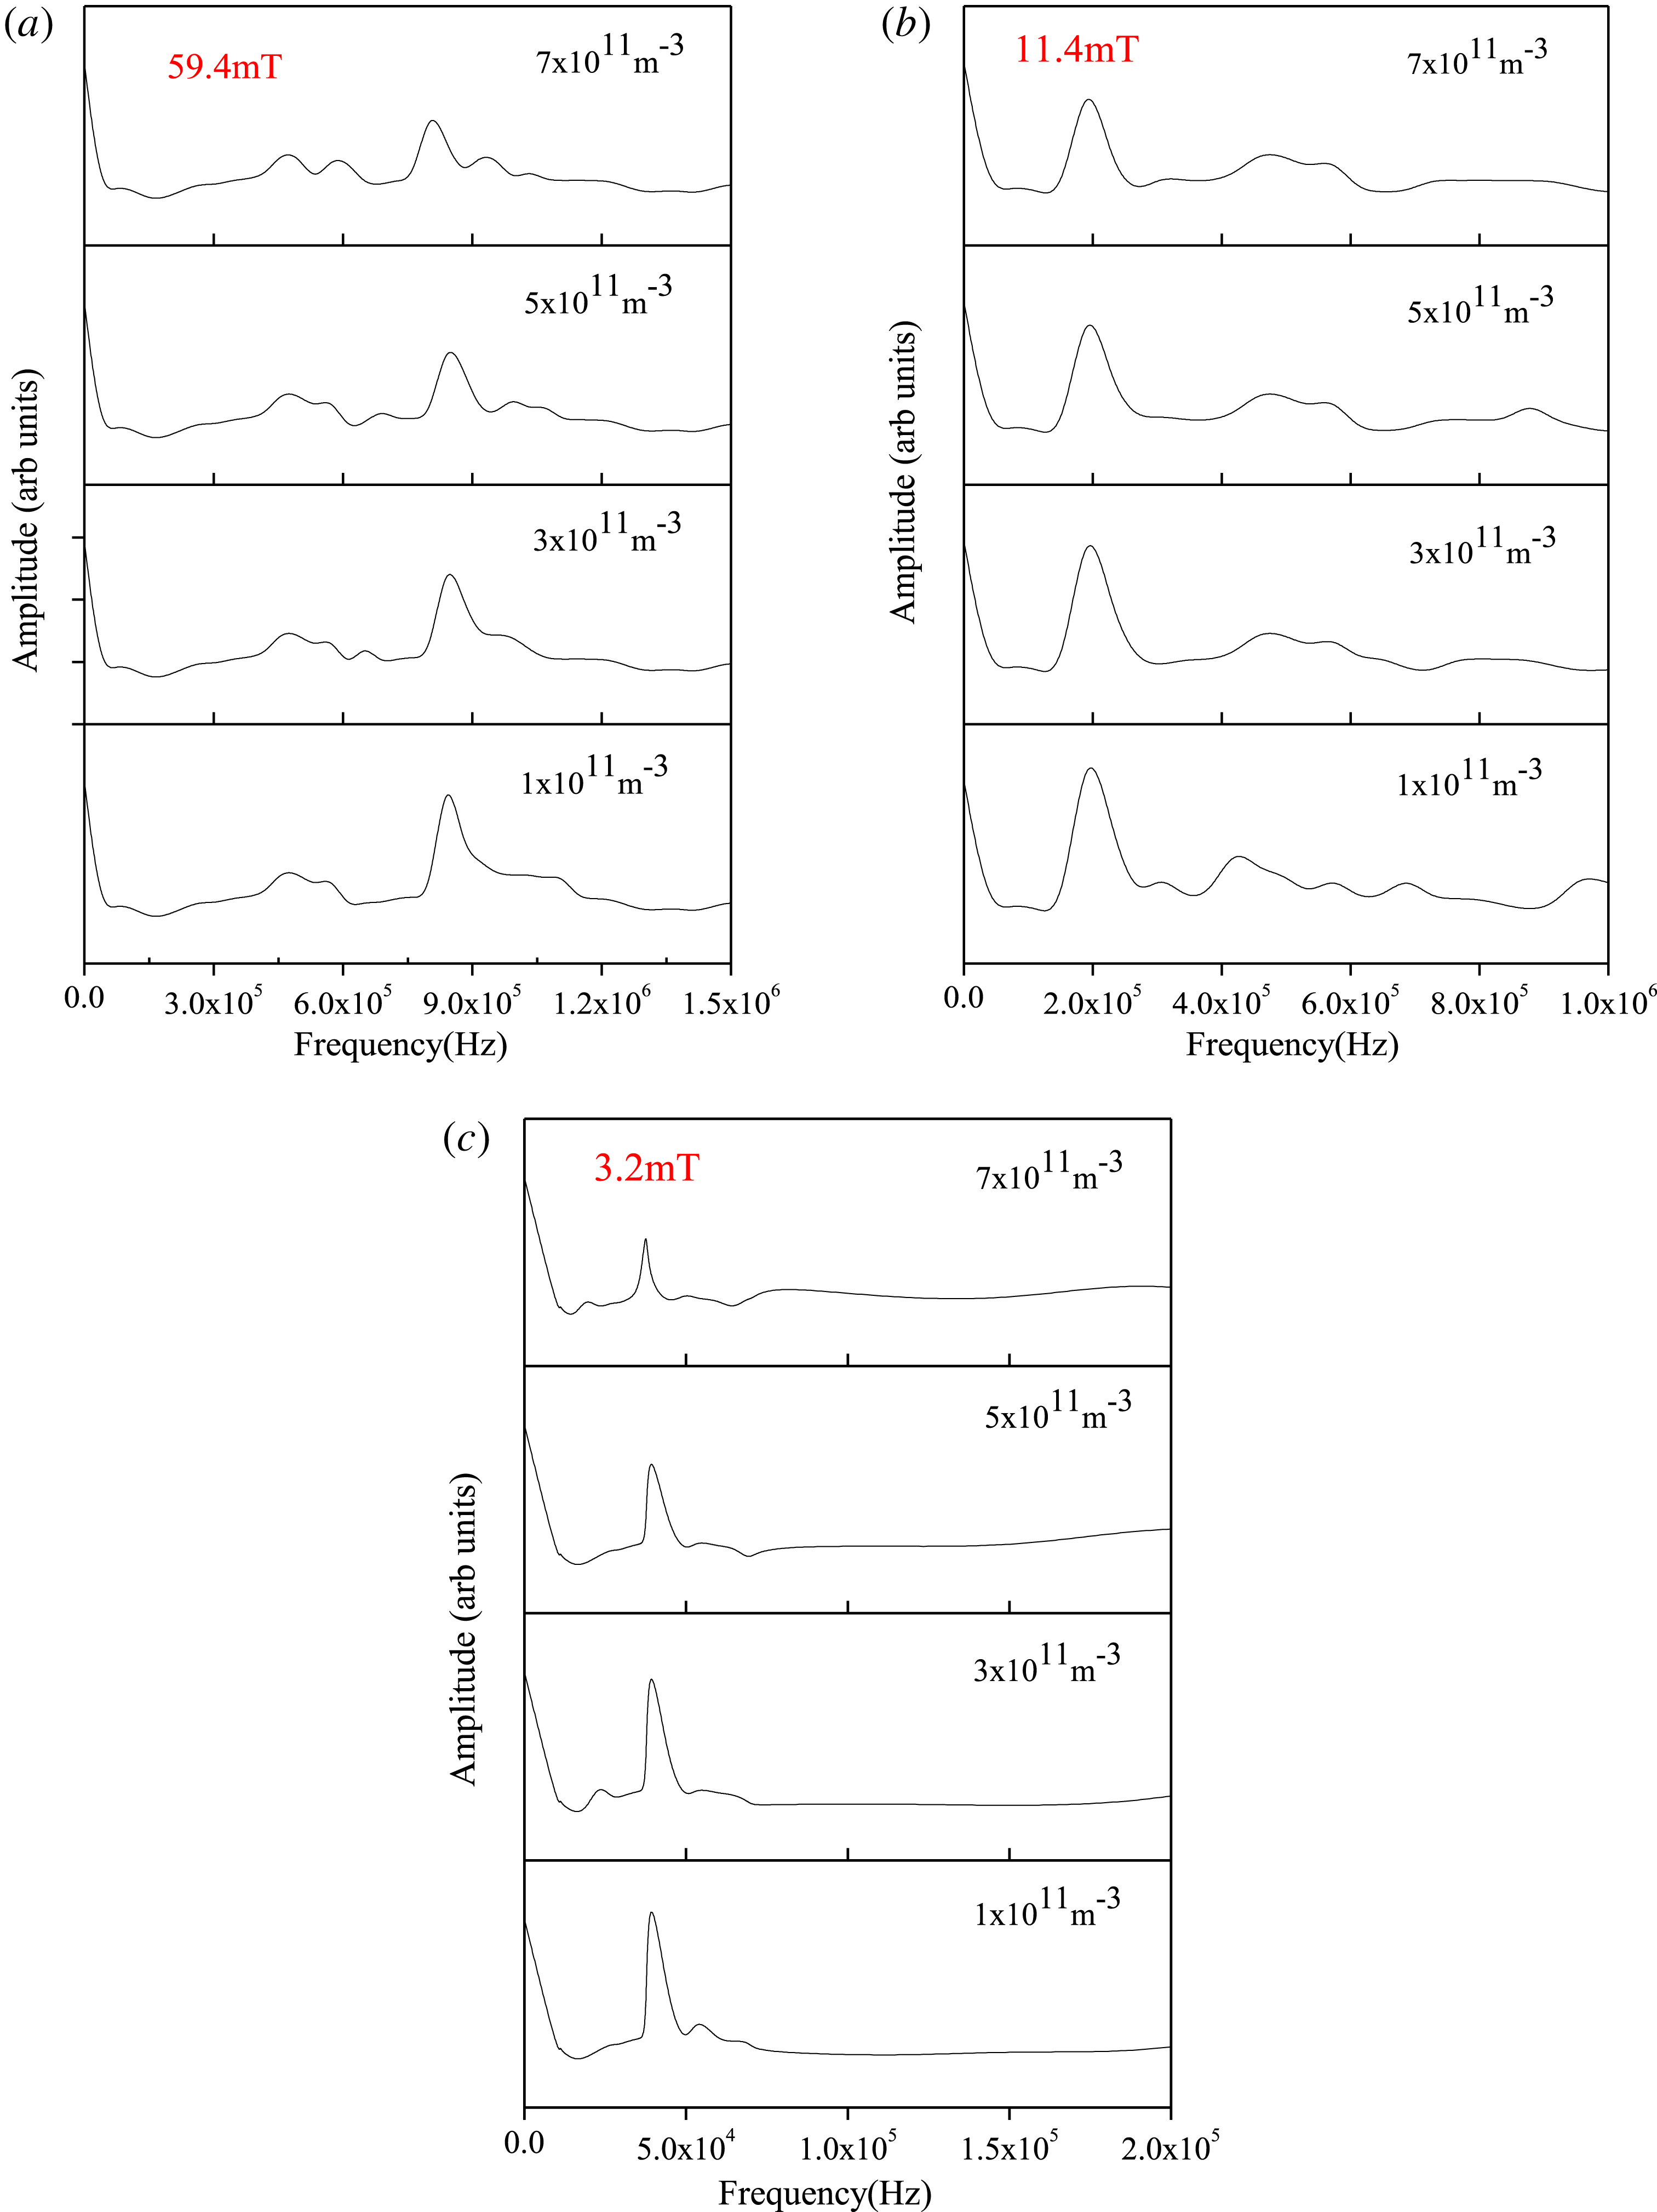
Figure 7 shows the plasma oscillation at different magnetic field strengths for different dust densities. To detect the plasma oscillation, the Langmuir probe is kept at floating potential. The experimentally measured data are recorded with the help of a digital oscilloscope. The dominant frequency associated with the plasma oscillation for each magnetic field is then identified from the FFT of the signals. In the present experiment, the plasma oscillations are observed at different magnetic field strengths and different dust densities.
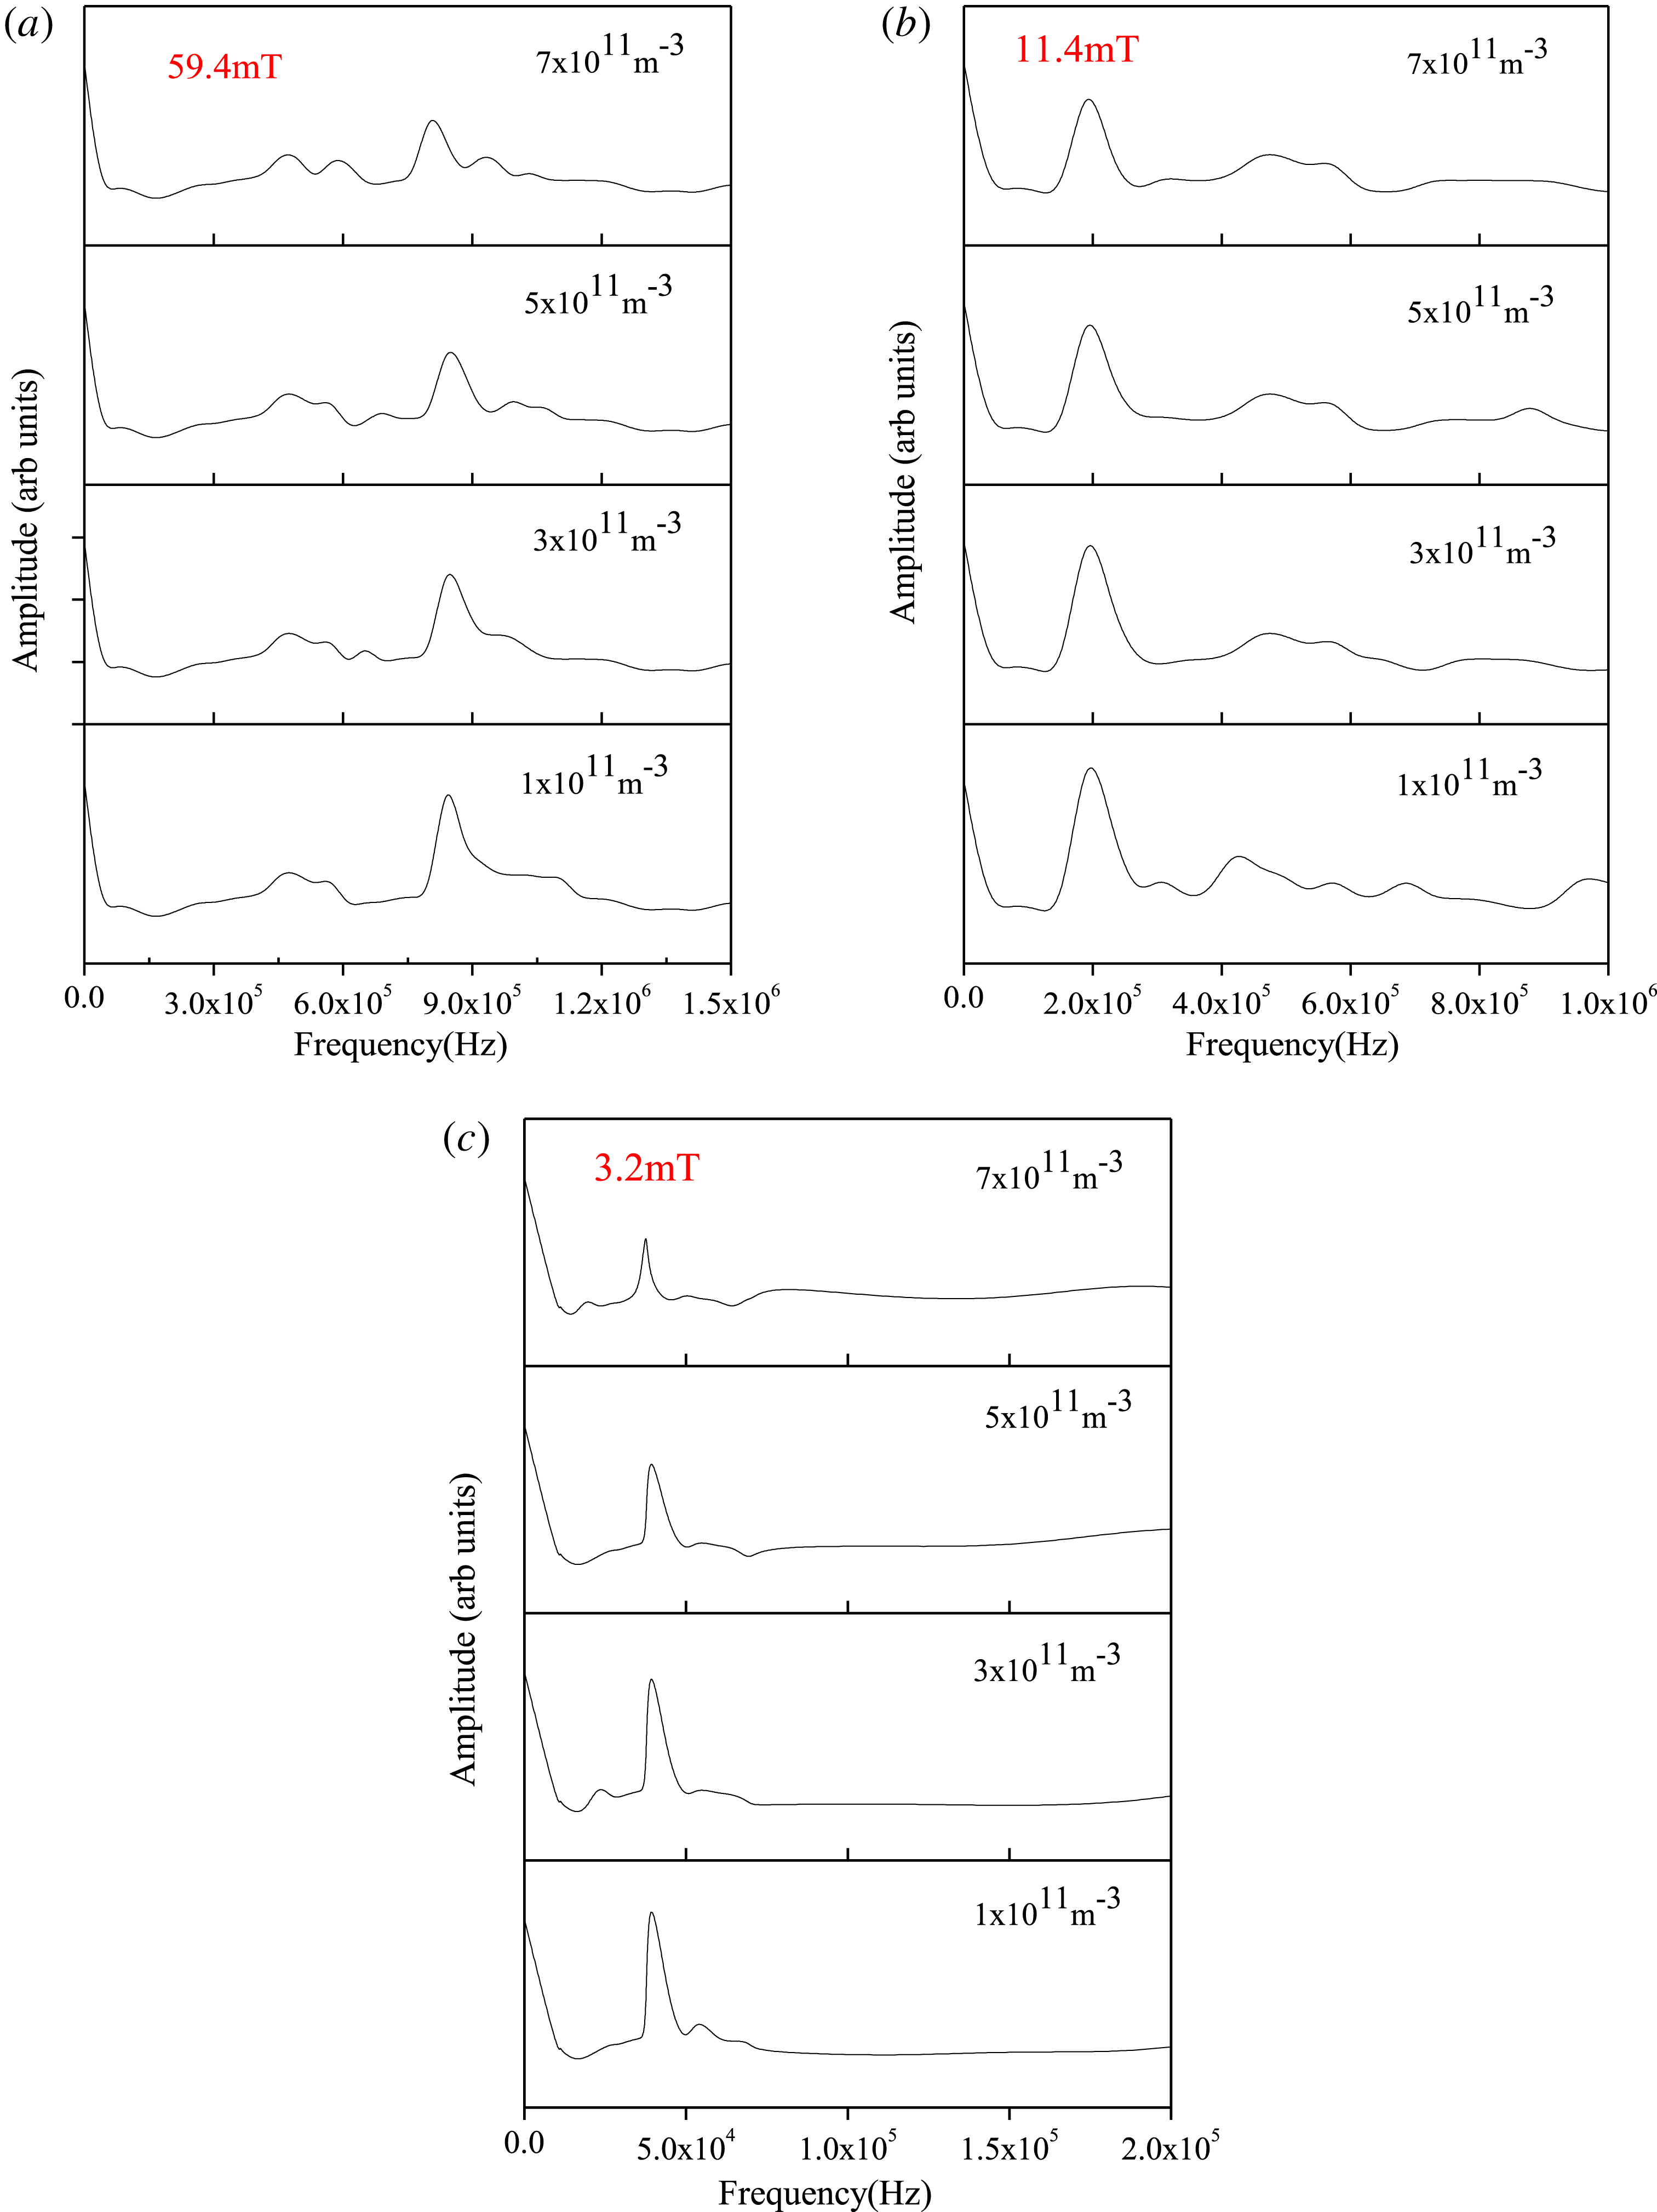
Figure 7. (a–c) Plasma oscillations for different magnetic field strengths at various dust densities.
In the case of a weakly magnetized plasma, the electrons show a cycloidal motion with gyro-frequency,
The observed frequency at
![]() $B=59.4$
mT for different dust densities is shown in figure 6(a). The dominant frequency associated with the plasma oscillation is observed at
$B=59.4$
mT for different dust densities is shown in figure 6(a). The dominant frequency associated with the plasma oscillation is observed at
![]() ${\sim}8.44\times 10^{5}$
Hz. The frequency decreases to
${\sim}8.44\times 10^{5}$
Hz. The frequency decreases to
![]() ${\sim}4.51\times 10^{4}$
Hz as the probe is placed at 6.0 cm away from the magnet, corresponding to the field strength,
${\sim}4.51\times 10^{4}$
Hz as the probe is placed at 6.0 cm away from the magnet, corresponding to the field strength,
![]() $B=3.2$
mT shown in figure 7(c). The frequency of the oscillation decreases with the decrease of magnetic field strength. This is due to the dependence of frequency on the magnetic field as shown in (3.1). The frequency of the oscillation obtained from the FFT spectra is then compared with the theoretically estimated frequency.
$B=3.2$
mT shown in figure 7(c). The frequency of the oscillation decreases with the decrease of magnetic field strength. This is due to the dependence of frequency on the magnetic field as shown in (3.1). The frequency of the oscillation obtained from the FFT spectra is then compared with the theoretically estimated frequency.
From the theoretical estimation, it is found that the experimentally observed frequency (shown in figure 7) matches the ion cyclotron frequency. The experimentally measured frequencies with theoretically estimated ion cyclotron frequencies at different dust densities are shown in figure 8. The results are compared for both a pristine (dust free) and a dust-containing hydrogen plasma for various magnetic field strengths.
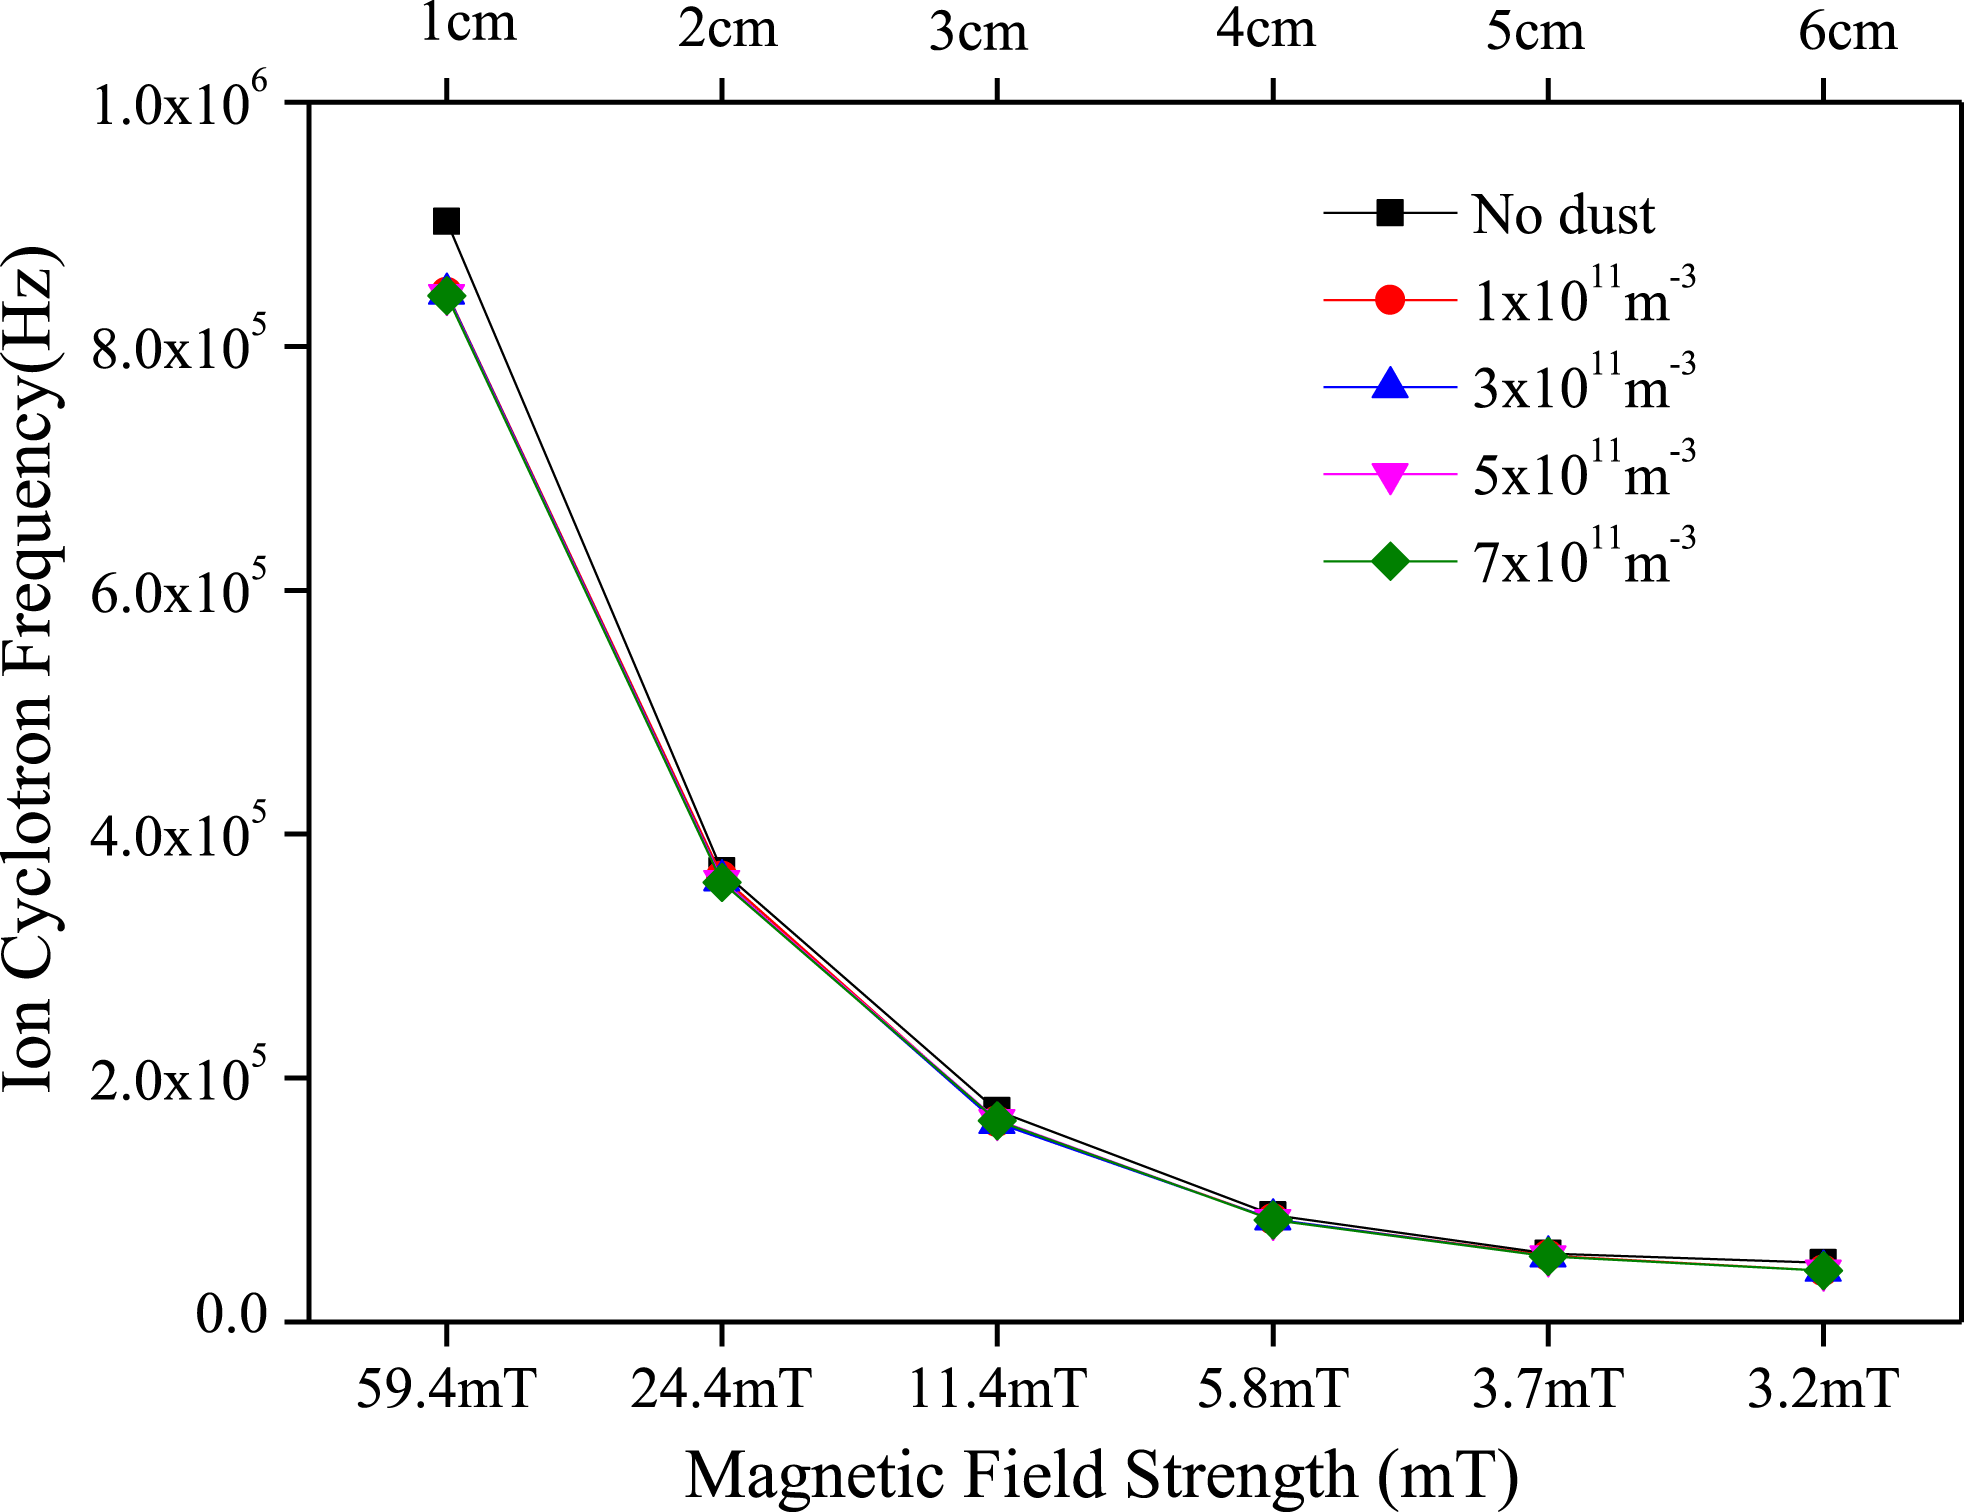
Figure 8. Ion cyclotron frequency versus magnetic field strength in absence/presence of dust.
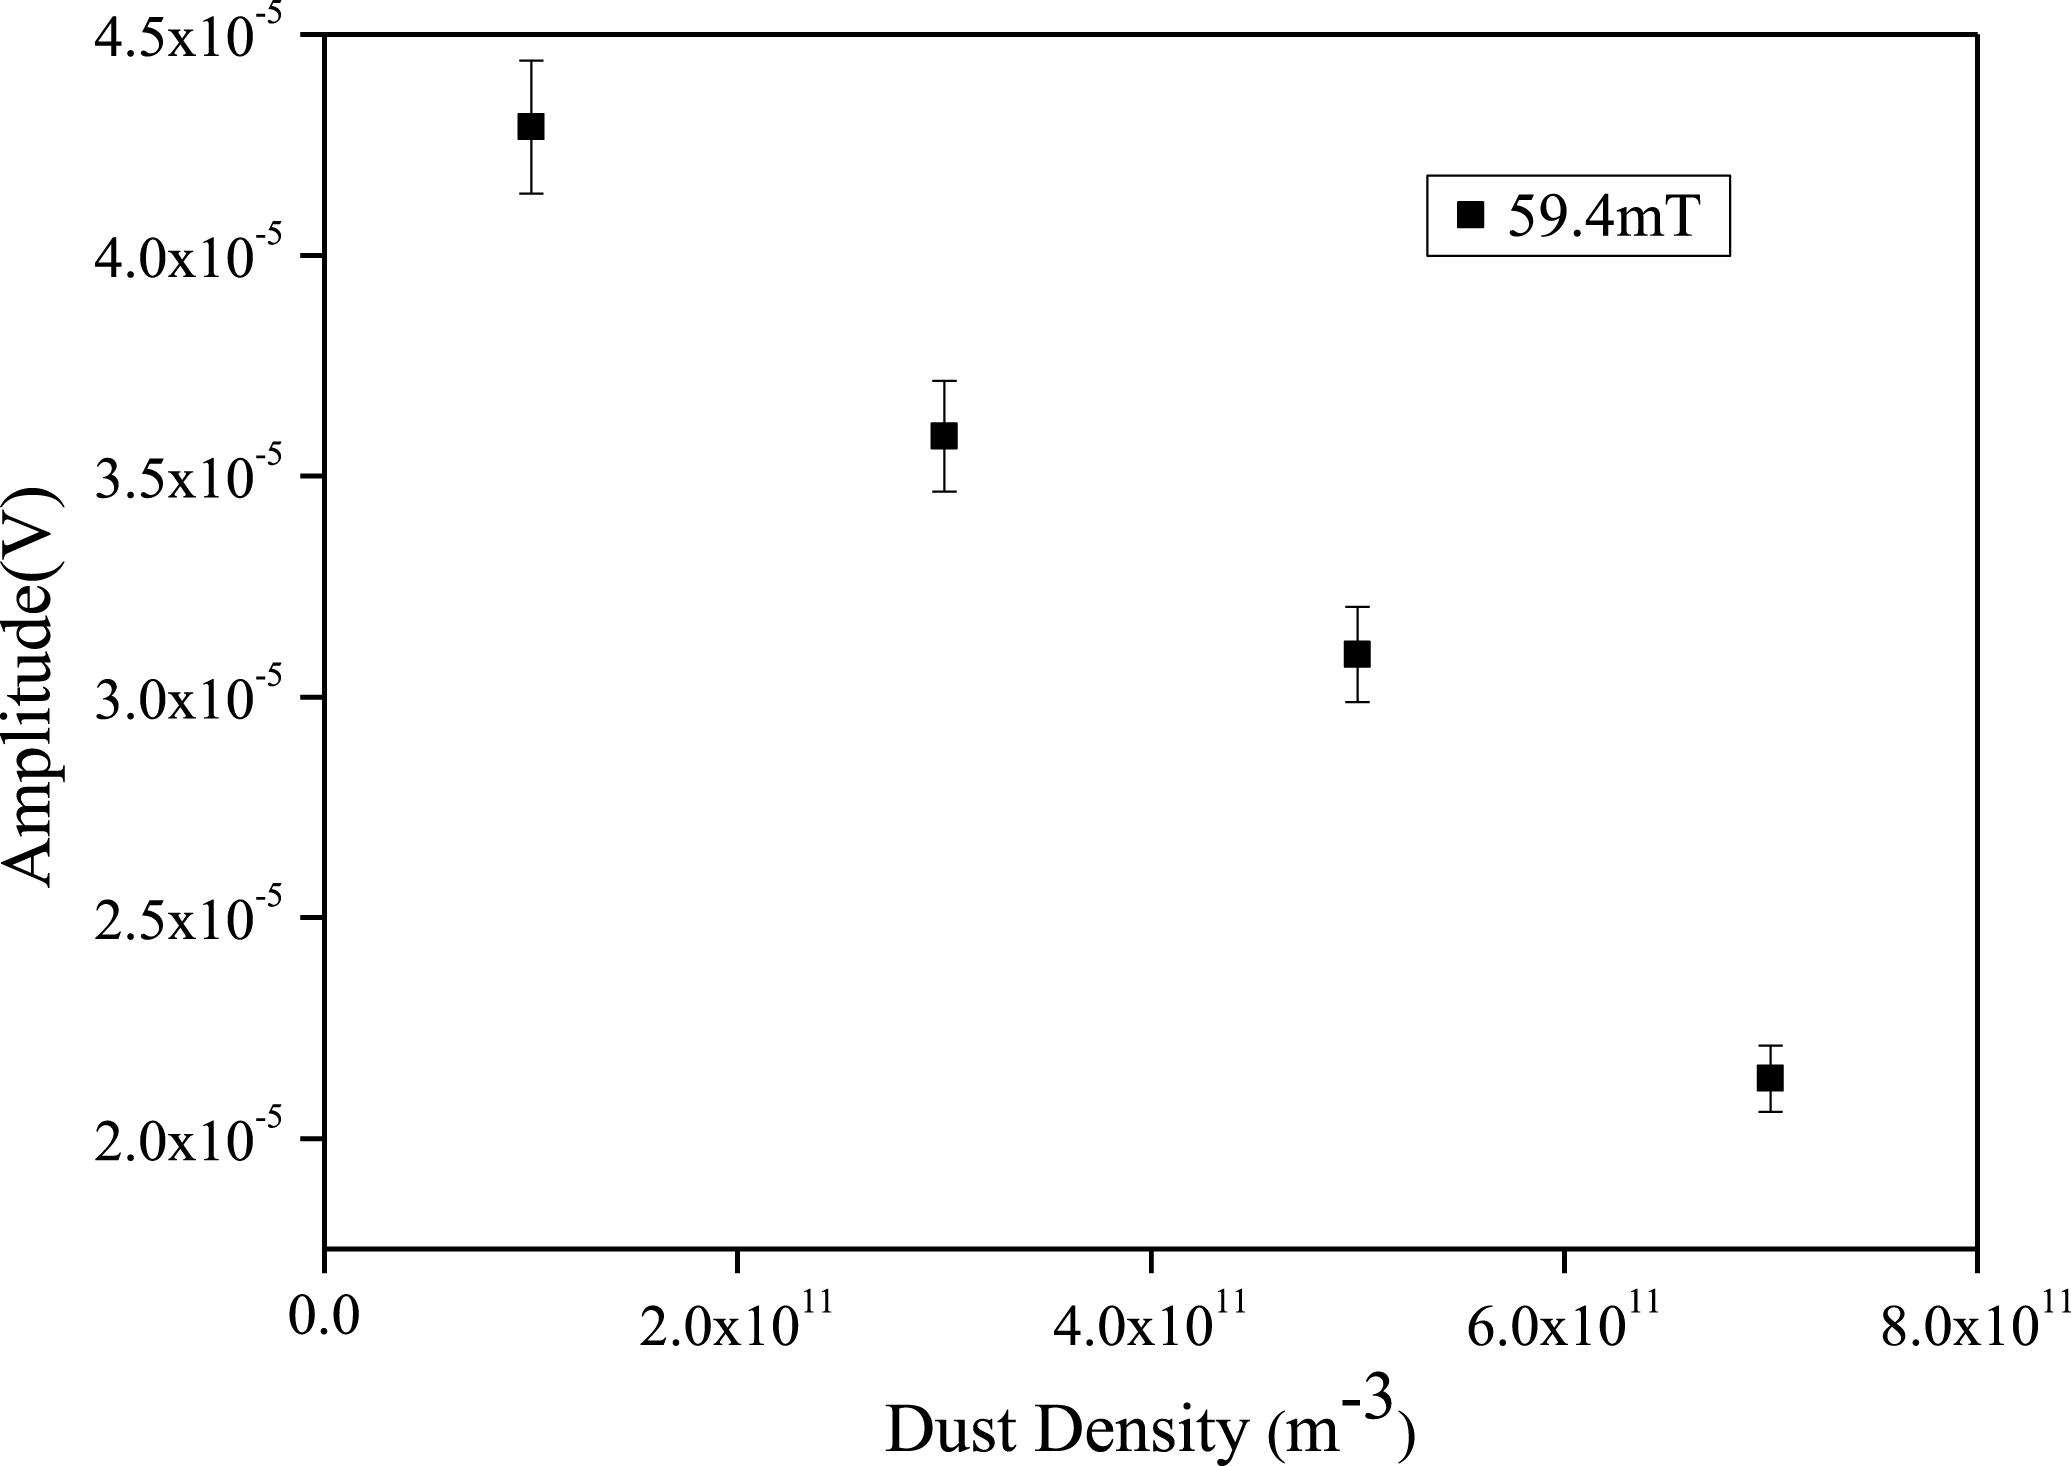
The amplitude of the ion cyclotron frequency for different dust densities at a magnetic field strength of
![]() $B=59.4$
mT is shown in figure 9. The amplitude is evaluated from the height of the dominant peak in the plasma oscillation spectra. It is found that the amplitude of the ion cyclotron frequency decreases with the increase of dust density. This may be due to the decrease of plasma density in the presence of dust particles which leads to a decrease in the amplitude of the peak.
$B=59.4$
mT is shown in figure 9. The amplitude is evaluated from the height of the dominant peak in the plasma oscillation spectra. It is found that the amplitude of the ion cyclotron frequency decreases with the increase of dust density. This may be due to the decrease of plasma density in the presence of dust particles which leads to a decrease in the amplitude of the peak.
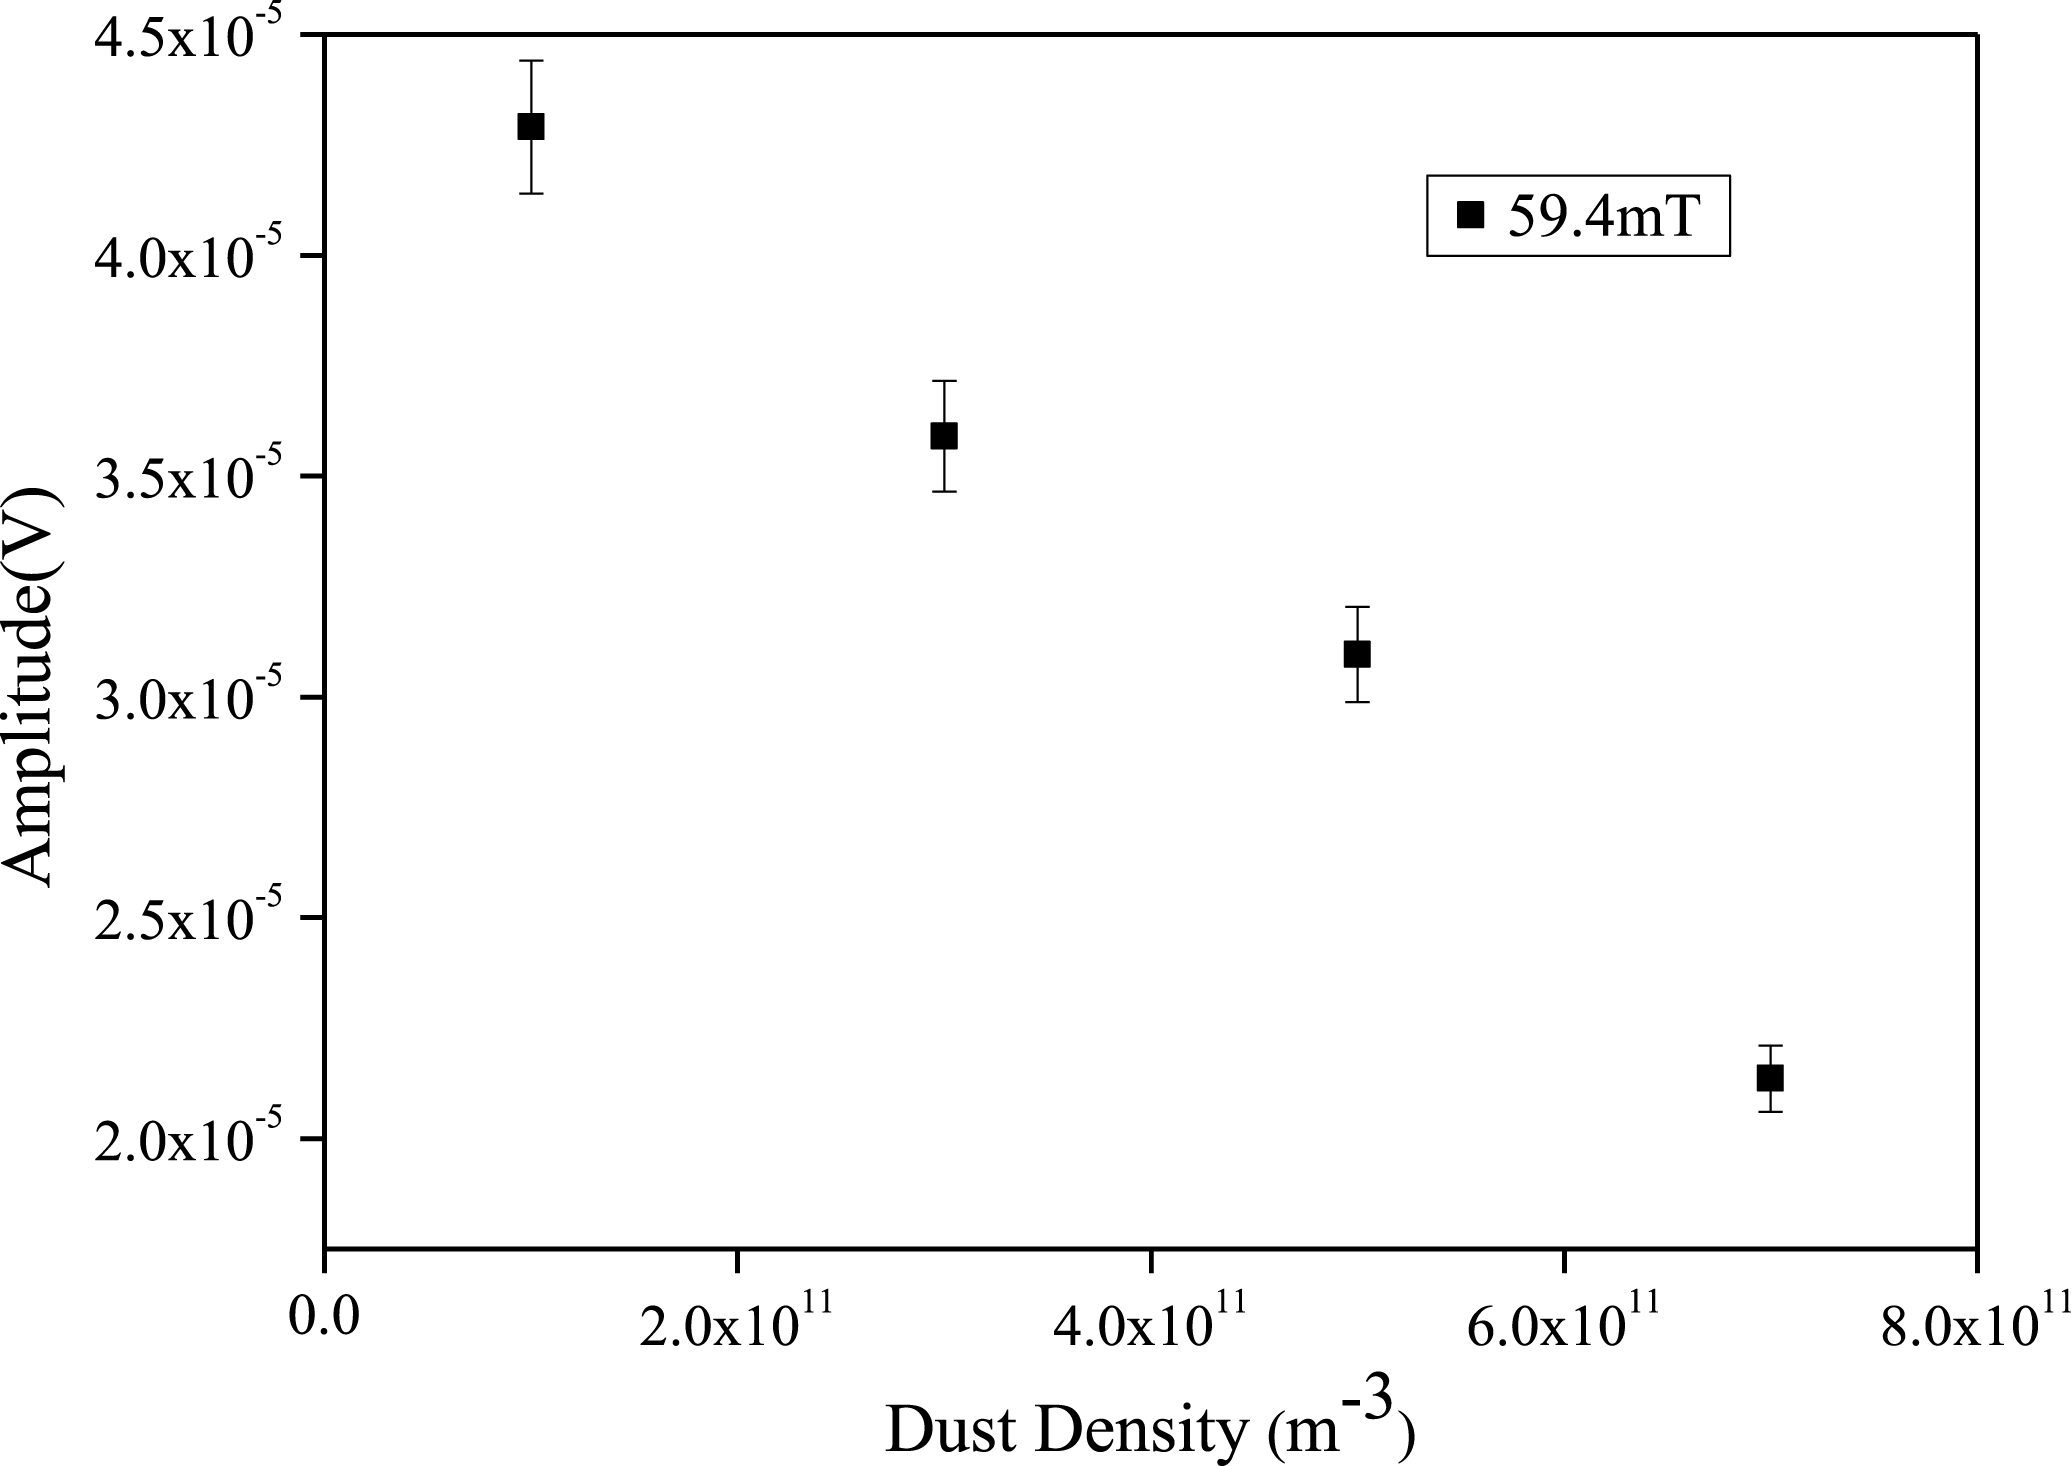
Figure 9. Amplitude for different dust densities at
![]() $B=59.4$
mT.
$B=59.4$
mT.
4 Conclusion
In our recent experiment, we found that the electron density decreases with increasing dust density for different magnetic fields. The decrease in electron density in the presence of dust grains is related to dust charging. As the dust density increases, the loss of bulk plasma density, i.e. electron and ion densities, increases due to the collection of electrons/ions by dust particles. The observation shows that even for low magnetic field strength where electrons are magnetized but ions are not, the different properties of the whole plasma are greatly influenced due to the presence of the magnetic field.
The EEPFs are studied for both a pristine (non-dusty) and dust-containing hydrogen plasma at different dust densities. We have observed a bi-Maxwellian EEPF curve in both situations for a varied magnetic field strength. We found that as the magnetic field increases, the lower energy electron population decreases. This drop in lower energy electron population for sufficiently high magnetic field strength is associated with the higher reduction factor which is due to the lower Larmor radius of electrons as compared to the probe radius. The lower electron population remains almost unchanged at
![]() $B\leqslant 3.7$
mT whereas the high energy electron population shows nearly the same results at
$B\leqslant 3.7$
mT whereas the high energy electron population shows nearly the same results at
![]() $B\leqslant 5.8$
mT for different dust densities. As compared to a pristine hydrogen plasma, the mid energy electron population for the dusty plasma slightly decreases while the high energy electron population slightly increases. But, the very low energy electron population (
$B\leqslant 5.8$
mT for different dust densities. As compared to a pristine hydrogen plasma, the mid energy electron population for the dusty plasma slightly decreases while the high energy electron population slightly increases. But, the very low energy electron population (
![]() ${\leqslant}$
2 eV) of the EEPFs has no such significant change with the dust density in our present work.
${\leqslant}$
2 eV) of the EEPFs has no such significant change with the dust density in our present work.
From the study of plasma oscillation, it is observed that the dominant frequency associated with the plasma oscillation is observed at
![]() ${\sim}8.44\times 10^{5}$
Hz for
${\sim}8.44\times 10^{5}$
Hz for
![]() $B=59.4$
mT. The frequency decreases to
$B=59.4$
mT. The frequency decreases to
![]() ${\sim}4.51\times 10^{4}$
Hz at field strength
${\sim}4.51\times 10^{4}$
Hz at field strength
![]() $B=3.2$
mT. From theoretical estimation, it is confirmed that the dominant frequency associated with plasma oscillation matches the ion cyclotron frequency. The amplitude of the ion cyclotron frequency decreases with the increase of dust density which might be due to the decrease of plasma density.
$B=3.2$
mT. From theoretical estimation, it is confirmed that the dominant frequency associated with plasma oscillation matches the ion cyclotron frequency. The amplitude of the ion cyclotron frequency decreases with the increase of dust density which might be due to the decrease of plasma density.
Acknowledgements
The authors are grateful to Mr G. D. Sharma for his technical support during the work. The Department of Atomic Energy, Govt. of India has financially support this present work. The second author contributed to the work during his stay at Centre of Plasma Physics-IPR.


