


I. INTRODUCTION
The NiTi shape-memory alloys are known from their application in medicine and veterinary as a material for implant design as well as medical devices. In general, they reveal relatively good corrosion resistance and biocompatibility. Thus, they found numerous practical applications, especially, as a short-term implant (Yoneyama and Miyazaki, Reference Yoneyama and Miyazaki2009). However, extending their staying in an environment of a human body may leads to nickel ion release. In consequence of that, a problem with hypersensitivity to presence of nickel may be an obstacle to their use as a long-term implant (Es-Souni et al., Reference Es-Souni, Es-Souni and Fischer-Brandies2005). One of the ways for improving their properties as well as increasing their functionality can be a surface modification. It can be achieved by formation of a protective coatings or layers on the NiTi surface composed from titanium oxides, nitrides, polymers, bioglasses, calcium phosphates (CaPs) coatings, or multi-phase composites (Sun et al., Reference Sun, Sask, Brash and Zhitomirsky2008; Dong et al., Reference Dong, Yuan, Hao, Xia, Da and Wang2009; Grandfield et al., Reference Grandfield, Sun, FitzPatrick, Cheong and Zhitomirsky2009; Morawiec et al., Reference Morawiec, Goryczka, Lelątko, Lekston, Winiarski, Rówiński and Stergioudis2010; Dudek et al., Reference Dudek, Szaraniec, Lelątko and Goryczka2013).
Calcium phosphates have found important applications as biomaterials, particularly for hard-tissue regeneration. Interest of these materials is clear from their great biocompatibility resulting from chemical similarity to inorganic component of bones, tendons, or teeth of mammals (Dorozhkin, Reference Dorozhkin2009, Reference Dorozhkin2015). Calcium phosphates are known because of its bioactive and conduct bone apposition by direct bone bonding (Johan et al., Reference Johan, Vehof, Spauwen and Jansen2000; Malysheva and Beletskii, Reference Malysheva and Beletskii2001). Among the various forms of CaPs ceramics, the most attention is focused on non-resorbable hydroxyapatite (HAp), resorbable β-tricalcium phosphate (β-TCP) and on the mixing of these two compounds with variety of HAp/TCP ratio – biphasic calcium phosphates (LeGeros et al., Reference LeGeros, Lin, Rohanizadeh, Mijares and LeGeros2003; Horowitz et al., Reference Horowitz, Mazor, Foitzik, Prasad, Rohrer and Palti2009; Lobo and Arinzeh, Reference Lobo and Arinzeh2010). In order to enhance biocompatibility of metallic implants, the calcium phosphate ceramics are used for surface modification (Malysheva and Beletskii, Reference Malysheva and Beletskii2001; Dorozhkin, Reference Dorozhkin2012).
Surface modifications methods have to be repeatable, inexpensive, and ensure rapidity of the process. One of the most common methods of surface modification is electrophoretic deposition (EPD). This technique enables controlling the coating thickness, its uniformity and deposition rate. Also, the EPD is recommended for the formation of coatings on substrates with complicated shapes and/or morphology. It is worth to note, that important advantage of this technique is the possibility of carrying out the deposition at ambient temperature (Zhitomirsky, Reference Zhitomirsky2002; Boccaccini et al., Reference Boccaccini, Keim, Ma, Li and Zhitomirsky2010). High-temperature processes may lead to decomposition of the β phase (NiTi) to equilibrium ones, limiting the unique shape memory effect. However, a sintering process is necessary to increase the electrophoretically deposited ceramic coatings’ density and their bonding to the metallic substrate. Application of the heat-treatment may results in structural changes of initial materials.
In the present work, an impact on development of the NiTi alloys, as a biomaterial, was received by deposition of multi-layers formed from titanium di-oxide and mixture of HAp and β-TCP. Structural changes of the NiTi matrix, resulting from deposition process, were found to be responsible for modification of the course of the martensitic transformation.
II. EXPERIMENTAL
A. Substrate preparation and coatings deposition
The NiTi alloy with chemical composition: 50.6 at.% Ni and 49.4 at.% Ti (Memry GmbH) in β-phase (B2) was used as a substrate for composite coatings deposition. First, the sample was quenched from 900 °C (after holding for 20 min) into ice–water. Then surface was polished with SiC papers down to 2000 grit following by diamond suspensions down to 1 µm. Final polishing was done with 0.1 µm colloidal silica suspension. Before deposition, the substrate was passivated in an autoclave at 134 °C for 30 min. In result of that, a thin amorphous titanium oxide layer on the NiTi surface was formed.
The powders of HAp Ca5(PO4)3(OH) (Sigma Aldrich) and β-TCP Ca3(PO4)2 were used for a suspension preparing in 0.1% wt. concentration in ratio of 1:1, in 99.8% ethanol (Avantor). In order to obtain well-dispersed suspension, it was mixed in a magnetic stirrer and in an ultrasonic bath.
The HAp/TCP coating was deposited by electrophoresis technique (EPD). The NiTi matrix was used as a cathode and platinum as a counter electrode. Cataphoresis was carried out at constant voltage of 60 V for 120 s at ambient temperature. After deposition, the green form coatings were dried at room temperature for 24 h. Then, the samples were vacuum-sintered at 800 °C for 2 h followed by slow cooling to room temperature.
B. Methods for structure characterization
Structure of the substrate and coatings was determined basing on the X-ray diffraction patterns measured with use of X'Pert PRO diffractometer (PANalytical B.V. Almelo, The Netherlands). The generator was operating at 40 kV and 30 mA and CuKα radiation was applied. Two techniques were used: a classical Bragg–Brentano (BB) and grazing incidence beam (GIXD). For the passivated NiTi matrix the reflectivity curve was measured in the 2θ range from 0.2° to 2.5°. Calculations were done with use of WinGixa computer program (Philips Analytical Xray B.V. – Almelo, The Netherlands).
The BB diffraction patterns were collected in a step-scan mode (0.05°2θ), in the 2θ range from 10° to 140°, whereas the GIXD ones were measured in the 2θ range from 10° to 100°. The GIXD patterns were measured at constant incidence angle of 0.2°, 0.3°, 0.5°, and 1°. Owing to the application of the 1/32 anti-scatter slit, on a primary beam, the time per step was extended from 10 s even to 200 s, dependently on the incidence angle.
Measured diffraction patterns were fitted using the Rietveld method (Young, Reference Young and Young1993) implemented in LHPM computer program version 4.2 (Hunter and Howard, Reference Hunter and Howard1998). However, before calculation all the measured diffraction patterns were identified using PDF-2 database (065-0917 for NiTi-B2, 072-0442 for Ti2Ni, 09-0169 for TCP, and 73-0293 for HAp). Example of phase identification, done for coated sample before and after sintering, was shown in Figure 1. It can be seen, from the distribution of diffraction lines, that their positions were well separated. Also, PDF database was a source of the starting parameters for refinement of crystal structure. Fitting was done using the pseudo-Voight function for description of the peak profile shape with asymmetry limit up to 20°. Background was fitted with fifth-order polynomial. For correction of the preferred orientation the March model was used. Crystallographic directions, perpendicular to the strongest diffraction lines were applied for calculations. Refinement was terminated when difference in variables reached 0.1. The values of the lattice parameters were supported by the uncertainties of calculation and marked as a numbers in the parentheses. Quality of the measured data were proved from Rietveld refinement, where values of the R exp factor were lower than 4%, whereas the quality of the pattern refinement was confirmed by relatively low reliability factors (R wp, R p). Their values did not exceed 9% (R wp) or 7% (R p). Also, quality of the refinement was evaluated from the Rietveld plots.

Figure 1. Results of the phase identification, done for GIXD patterns measured at 0.3° for the NiTi matrix after deposition of HAp/TCP layer and sintered at 800 °C for 2 h.
Microstructure of substrates and coatings was observed with use of a transmission electron microscope JEOL JEM 3010 (TEM) as well as scanning electron microscope JEOL JSM 6480 (SEM). Microscopes were operating at 300 and 20 kV for TEM and SEM, respectively.
Transformation behavior of the NiTi matrix was studied basing on the thermograms measured with use of a Mettler DSC-1 differential scanning calorimeter (DSC) with cooling/heating rate of 10° min−1.
III. RESULTS AND DISCUSSION
A. Structure of NiTi matrix
In order to go into details of matrix structure as well as coating, first an effective depth of the X-ray beam penetration was recognized. The effective depth for the CuKα radiation, in the BB geometry, can be estimated from equation (Cullity, Reference Cullity1956):
 $$x = \displaystyle{{{\rm ln(}1/1 - G_x )} \over {2\mu}} \sin \theta, $$
where: x is the effective depth of penetration; μ the linear absorption coefficient; G x the fraction of the total diffracted intensity, which is contributed by surface with the thickness of x; and θ the Bragg angle.
Dependently on the 2θ angle, it varies from 4 to 44 µm for the HAp/TCP layer and from 2 to 20 µm for the NiTi matrix. However, the effective depth of penetration for the GIXD patterns, in some range of the 2θ is almost constant and can be calculated as follows (Skrzypek, Reference Skrzypek2002):
 $$x = \displaystyle{{ - {\rm ln(}1/1 - G_x )} \over {\mu [1/\sin \alpha + 1/\sin (2\theta - \alpha )]}},$$
where α is the the angle of incidence of the primary beam.
Figure 2 shows the effective depth of penetration, calculated for the NiTi matrix as well as HAp/TCP coatings, versus 2θ angle for incidence angle 0.3° and 1.0°. It can be found that the CuKα radiation may penetrate HAp/TCP layer down to approximately 12 µm (for incidence angle 1.0°), whereas for angle 0.3° penetration depth does not exceed 4.2 µm. Density of the NiTi matrix is almost two times higher than HAp or TCP, that is, penetration depth is 5.4 and 1.7 µm for incidence angle 1.0° and 0.3°, respectively. Keeping this on a mind and the fact, that the average thickness of the deposited HAp/TCP layer was about 3.5 ± 0.7 µm, it can be estimated that (for 1° incidence angle) the X-ray beam penetrated HAp/TCP coating and rest of the beam interacted with the NiTi matrix. It means that the GIXD pattern at 1° contains peaks belonging to the HAp, TCP, and the NiTi matrix. In case of the lower incidence angle (0.3°), penetration of the X-ray beam inside of the NiTi matrix was limited. In consequence of that, higher intensity of the diffraction lines, belonging to HAp/TCP coatings, was detected.

Figure 2. Effective depth of penetration calculated for the CuKα radiation for the NiTi matrix and HAp/TCP layer, for the incidence angle of primary beam 0.3° and 1.0°.
The crystal lattice of the β-phase, in NiTi shape-memory alloy with chemical composition close to equiatomic, undergoes the reversible martensitic transformation between the parent phase (the B2 type of structure) and monoclinic martensite (the B19′ type o structure). Dependently on a chemical composition and/or thermo-mechanical treatment the transformation may occur as a two-step transition. In the first step, the parent phase transforms to the R-phase and in the second, the R-phase transforms to the monoclinic martensitic. The BB X-ray diffraction pattern, measured for initial state of the NiTi alloy, revealed that majority of diffraction lines belonged to the B2 parent phase. Apart from that, additional diffraction lines were identified. They were characterized by very low intensities and belonged to the equilibrium phase – Ti2Ni. The region with the strongest lines of the Ti2Ni phase was shown in magnified window in Figure 3. For the avoidance of doubts and in order to be sure that phase identification was correct, SEM observation supported by analysis of chemical composition was carried out. The observations were done on the selectively etched NiTi samples. Obtained results proved that the equilibrium Ti2Ni phase appeared as primary precipitates mainly distributed along the grain boundaries of the B2 phase (Figure 4). Crystallographic structure of both phases was refined with the Rietveld method. Results of the refinement were summarized in Table I and shown in Figure 3. In general, the lattice parameter of the B2 phase depends on the chemical composition of the β-phase (in a binary NiTi alloy) and varies with titanium/nickel ratio from 3.01 to 3.02 Å (Funakubo, Reference Funakubo1987). For studied alloy, in the as-quenched state, its value was 3.0133 Å. The lattice parameter determined at penetration depth of 1.5 or 4 µm (for NiTi matrix) for passivated/deposited HAp/TCP coatings, was comparable with one calculated for the as-quenched state (Figure 5 and Table I). It means that the passivation as well as EPD did not affect structure of the matrix.

Figure 3. The Rietveld plot received after the refinement of the measured BB diffraction pattern for the NiTi matrix before layer deposition. The black dots denote the measured data points, the red line represents calculated pattern, green line shows difference plot, and stick bars refer to peak position in accordance to the fitted phase.

Figure 4. SEM image of the Ti2Ni precipitates observed after selective etching of the as-quenched NiTi alloy.

Figure 5. The Rietveld plot received after the refinement of GIXD pattern (α = 0.3°) for the NiTi composite after HAp/TCP layer deposition. The black dots denote the measured data points, the red line represents calculated pattern, green line shows difference plot and stick bars refer to peak position in accordance to the fitted phase.
Table I. Crystal data for the parent phase after sequential steps of coatings deposition.

Basing on the GIXD patterns measured for the sample sintered at 800 °C the structure of identified phases were fitted with the Rietveld (Figure 6). After sintering, the lattice parameter of the B2 phase varied dependently on the penetration depth. The lattice parameter increased to 3.0149 Å in sublayer of the NiTi matrix formed directly under the HAp/TCP coating. In deeper regions, its value decreased to 3.0112 Å (Table I). Such tendency can be clarified as follows. At the interface between the NiTi matrix and HAp/TCP layer, after passivation the titanium oxide layer was formed. It rose from titanium, which came from the NiTi matrix. Morawiec et al. (Reference Morawiec, Goryczka, Lelątko, Lekston, Winiarski, Rówiński and Stergioudis2010) showed that titanium content increases, in the NiTi matrix, as it approached to the passivated layer. In consequence of that, content of nickel decreased at region close to the passivated layer. It means that the B2 phase was enriched in titanium. Radius of titanium atom is higher than nickel. In consequence of these facts, the increase of the B2 phase lattice parameter was stated.

Figure 6. The Rietveld plot received after refinement of GIXD pattern (α = 0.3°) for the NiTi composite after sintering at 800 °C for 2 h. The black dots denote the measured data points, the red line represents calculated pattern, green line shows difference plot and stick bars refer to peak position in accordance to fitted phase.
Opposite situation took place at penetration depth of about 4 µm (NiTi matrix). For chemical composition of studied alloy, below 650 °C the B2 phase may decompose to equilibrium phases such as the Ti2Ni as well as Ni3Ti or non-equilibrium phases such as Ni4Ti3 and/or Ti2Ni3, etc. From the measured diffraction pattern no presence of the Ni3Ti phase was stated. Only, previously discussed, the Ti2Ni phase was identified. In consequence of that, in this region the B2 phase was enriched in nickel and lower value of the lattice parameters was received: 3.0111(8) Å. Obtained results were comparable to that calculated by Funakubo (Reference Funakubo1987) and Philip and Beck (Reference Philip and Beck1957).
Detailed observation done with TEM confirmed that internal part of the NiTi matrix still contained particles of the Ti2Ni phase. Moreover, in some region non-equilibrium particle of the Ni4Ti3 phase was identified (Figure 7). It may be the consequence of matrix enrichment in nickel atom and/or chemical composition inhomogeneity resulting from the sintering process. Such changes, in structure of the NiTi matrix, took an effect on the course of the reversible martensitic transformation. Figure 8 shows comparison of the DSC cooling/heating curves measured for the NiTi matrix after HAp/TCP electrophoretical deposition and its sintering. Before sintering, martensitic transformation occurred as a one-step transformation (B2–B19′) during cooling and heating, whereas after sintering it proceeded in two steps (B2–R–B19′) during cooling and as one step during heating. The occurrence of the Ni4Ti3 precipitates can be the source of the multi-step martensitic transformation (Morawiec et al., Reference Morawiec, Stróż, Goryczka and Chrobak1996; Khalil-Allafi et al., Reference Khalil-Allafi, Eggeler, Dlouhy, Schmahl and Somsen2004; Goryczka, Reference Goryczka2008).

Figure 7. TEM image of microstructure observed for the NiTi matrix after layer sintering.

Figure 8. DSC cooling/heating curves measured for the NiTi matrix before and after sintering.
B. Structure of deposited layers
First step in layers formation, on the NiTi matrix, was passivation of the polished surface. The process was done using the same chemical composition of the NiTi matrix as well as passivation conditions, which were reported by Morawiec et al. (Reference Morawiec, Goryczka, Lelątko, Lekston, Winiarski, Rówiński and Stergioudis2010). It was proved that on surface of the NiTi matrix a thin amorphous layer of the TiO2 layer was formed with thickness of about 3.5 nm. Following that, for the passivated NiTi matrix the reflectivity curve was measured and fitted using the TiO2 layer model. Refinement was finished when the χ 2 reached 0.05. It was found that thickness of the passivated layer is 31 Å, 3.98 g cm−3 dense and 6.1 Å rough. The density of the NiTi matrix was 6.19 g cm−3 with the roughness 7.1 Å at the interface. The results well corresponded to that obtained by Morawiec et al. (Reference Morawiec, Goryczka, Lelątko, Lekston, Winiarski, Rówiński and Stergioudis2010).
In order to find an influence of the EPD as well as sintering process on the structure of HAp and TCP, the lattice parameters were determined from the Rietveld refinement. First, calculations were done for BB diffraction patterns measured for separate HAp and TCP powder. Then, lattice parameters were calculated, from GIXD patterns, for sample after HAp/TCP deposition as well as its sintering. Examples of the refinement are shown in Figures 5 and 6. Also, results were presented in Table II. From the comparison, it can be seen that the differences in lattice parameters did not exceed 0.004 and 0.005 Å for HAp and TCP, respectively.
Table II. Lattice parameters of the phosphates determined before and after their deposition as well as sintering.
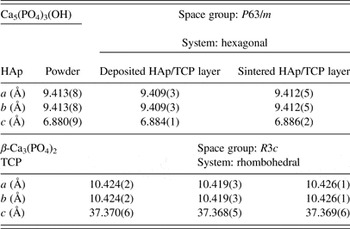
Received results proved that the applied conditions for layers deposition and their sintering did not affect their structures. Both HAp and TCP did not undergo any reactions leading to their degradation. Moreover, determined ratio of the weight fractions for both phosphates was comparable with nominal one (Table III).
Table III. Weight fraction of identified phases calculated from the GIXD patterns refined with the Rietveld method.

a Estimated value of the effective depth of penetration refers to the NiTi matrix.
The sintering conditions (temperature and time) may affect the consolidation of ceramic. In result of that some preferential growth of grains may be expected. For the deposited layer, distribution of the grains orientation was involved into the Rietveld refinement. From correction of the preferred orientation it can be found that for the HAp and TCP preferred orientation factors were relatively low and equal 0.94 and 0.95, respectively. However, stronger texture was stated for the matrix – for the B2 parent phase. Owing to its rolling done for forming of the shape of the shits, grains were textured and preferred orientation factor was about 0.71. Such value was received from calculation done for the sample before and after sintering. Also, it can be summarized, that sintering did not influence on grains orientation in B2 phase. Moreover, ceramic consolidation was not affected by any preferential grains growth.
IV. CONCLUSION
-
(1) The multi-layer, composed from the titanium oxide and mixture of the HAp and the β-TCP), was produced on surface of the NiTi matrix using passivation, electrophoresis and sintering processes.
-
(2) The as-quenched NiTi matrix is composed of the B2 phase and small amount of the Ti2Ni precipitates.
-
(3) The NiTi surface was passivated by the formation of 31 Å thin titanium di-oxide layer.
-
(4) Parameters of passivation as well as electrophoresis did not influence the structure of the NiTi matrix and martensitic transformation which occurred as a one-step transition.
-
(5) In sintered composite, under the TiO2–HAp/TCP layer, two sub-layers of the parent phase (B2) were found inside of the NiTi matrix. Owing to a local change of chemical composition, resulting in appearance of precipitates, the sub-layers differed in values of the lattice parameters of the B2 phase.
-
(6) Changes in the structure of the NiTi matrix, done after composite sintering, leads to two-steps martensitic transformation during cooling. During heating the transformation remains still as a one-step.


