


Introduction
One of the cardinal symptoms of depression is an impaired response to rewarding stimuli, i.e. anhedonia. Behavioral activation (BA) therapy is a form of cognitive behavioral therapy (CBT) that is designed to shift maladaptive behaviors to increase opportunities for positive reinforcement for the client. The therapist and client work together to develop BA assignments, i.e. to enhance engagement in key aspects of life that are pleasurable or meaningful (Dimidjian, Barrera, Martell, Munoz, & Lewinsohn, Reference Dimidjian, Barrera, Martell, Munoz and Lewinsohn2011; Martell, Dimidjian, & Herman-Dunn, Reference Martell, Dimidjian and Herman-Dunn2010). BA has been shown to be associated with significant reductions in depressive symptoms, and there is evidence that in the case of severe depression, it may be superior to other forms of therapy (e.g. cognitive therapy) and equivalent to antidepressant medication in efficacy (Butler, Chapman, Forman, & Beck, Reference Butler, Chapman, Forman and Beck2006; Dimidjian et al., Reference Dimidjian, Hollon, Dobson, Schmaling, Kohlenberg, Addis and Jacobson2006). Nevertheless, as in the case of other treatments for depression, 40–50% of patients (Dimidjian et al., Reference Dimidjian, Hollon, Dobson, Schmaling, Kohlenberg, Addis and Jacobson2006) do not respond to BA. Data from the National Health Interview Survey show that approximately 9 million Americans receive psychotherapy each year for mental illness (predominantly for depression) at an estimated cost of 7–10 billion dollars (Olfson & Marcus, Reference Olfson and Marcus2010), and two-thirds do not achieve remission after a full course of treatment (DeRubeis et al., Reference DeRubeis, Hollon, Amsterdam, Shelton, Young, Salomon and Gallop2005; Driessen et al., Reference Driessen, Van, Don, Peen, Kool, Westra and Dekker2013). Currently, evaluation of who is most/least likely to do well with treatment is based on clinical judgement. Furthermore, the evaluation of treatment efficacy is determined primarily by patient self-report. It would be useful to identify predictive or monitoring/therapeutic biomarkers, i.e. biomarkers predictive of treatment outcome or those that change with successful treatment. Such biomarkers could inform personalized medicine approaches as well as future treatment targets, thus potentially helping to reduce healthcare costs and human suffering.
Analytes that quantify an individual's inflammatory state are natural biomarker candidates for BA because of the tight link between motivational aspects of anhedonia and inflammation. Animal work has demonstrated that experimentally induced immune system activation produces an altered motivational response that includes anhedonia-like behavior such as reduced sucrose preference (Dantzer, O'Connor, Freund, Johnson, & Kelley, Reference Dantzer, O'Connor, Freund, Johnson and Kelley2008). In humans and non-human primates, administration of cytokines or lipopolysaccharide is associated with decreased striatal dopamine release, disrupted cortico-striatal functional connectivity, blunted striatal responsivity to reward, and symptoms of anhedonia (Capuron et al., Reference Capuron, Pagnoni, Demetrashvili, Lawson, Fornwalt, Woolwine and Miller2007; Capuron et al., Reference Capuron, Pagnoni, Drake, Woolwine, Spivey, Crowe and Miller2012; Eisenberger et al., Reference Eisenberger, Berkman, Inagaki, Rameson, Mashal and Irwin2010; Felger & Treadway, Reference Felger and Treadway2017).
Several studies have reported that CBT or cognitive therapy decreases C-reactive protein (CRP) and/or interleukin 6 (IL-6) in depressed patients with medical illnesses or elderly subjects with insomnia (Doering, Cross, Vredevoe, Martinez-Maza, & Cowan, Reference Doering, Cross, Vredevoe, Martinez-Maza and Cowan2007; Irwin et al., Reference Irwin, Olmstead, Carrillo, Sadeghi, Breen, Witarama and Nicassio2014; Irwin et al., Reference Irwin, Olmstead, Breen, Witarama, Carrillo, Sadeghi and Cole2015; Sharpe & Schrieber, Reference Sharpe and Schrieber2012; Zabihiyeganeh et al., Reference Zabihiyeganeh, Vafaee Afshar, Amini Kadijani, Jafari, Bagherifard, Janbozorgi and Mirzaei2019; Zautra et al., Reference Zautra, Davis, Reich, Nicassario, Tennen, Finan and Irwin2008), however, this was not observed in a trial of CBT for depressed patients at increased risk of cardiovascular disease (Taylor et al., Reference Taylor, Conrad, Wilhelm, Strachowski, Khaylis, Neri and Spiegel2009). Three studies found that CBT reduced IL-6 along with depressive symptoms in patients with primary depression (Gazal et al., Reference Gazal, Souza, Fucolo, Wiener, Silva, Pinheiro and Kaster2013; Moore et al., Reference Moore, Chattillion, Ceglowski, Ho, von Kanel, Mills and Mausbach2013; Moreira et al., Reference Moreira, Cardoso Tde, Mondin, Souza, Silva, Jansen and Wiener2015) while two other studies reported no change in IL-6 and CRP but decreased expression of inflammatory transcripts such NF-κB and TLR-4 (Keri, Szabo, & Kelemen, Reference Keri, Szabo and Kelemen2014) and increased IL-10 (Euteneuer et al., Reference Euteneuer, Dannehl, Del Rey, Engler, Schedlowski and Rief2017) post-treatment. Consistent with the hypothesis that inflammatory markers decrease post-CBT, a course of internet-based CBT for depression was found to decrease the plasma concentrations of several different chemokines although IL-6 and CRP were not measured (Romero-Sanchiz et al., Reference Romero-Sanchiz, Nogueira-Arjona, Araos, Serrano, Barrios, Argente and Fonseca2020). Partially consistent with these studies, a recent meta-analysis of eight different psycho-social interventions across a range of different diseases concluded that on an average these interventions decrease markers of inflammation and that the evidence is most reliable for CBT or multiple-component interventions (Shields, Spahr, & Slavich, Reference Shields, Spahr and Slavich2020). In contrast, minimal attention has been paid to treatment response biomarkers (i.e. biomarkers that predict symptom reduction).
An under-appreciated consequence of inflammatory processes observed in depression is the immune-mediated activation of the kynurenine pathway (KP) (Savitz, Reference Savitz2020). Several inflammatory mediators increase the conversion of tryptophan to kynurenine (KYN/TRP), which is then further metabolized down two principal pathways producing several neuroactive metabolites (online Supplementary Fig. S1). In one branch, KYN is converted to the NMDA receptor antagonist, kynurenic acid (KynA). In the other principal branch, KYN is ultimately metabolized into the neurotoxic NMDA receptor agonist, quinolinic acid (QA), and the energy source, nicotinamide adenine dinucleotide (NAD+). Because activated immune cells require energy, KYN is preferentially converted into QA and NAD+ under inflammatory conditions (O'Connor et al., Reference O'Connor, Lawson, Andre, Moreau, Lestage, Castanon and Dantzer2009; Zunszain et al., Reference Zunszain, Anacker, Cattaneo, Choudhury, Musaelyan, Myint and Pariante2012). Nevertheless, because of their neuromodulatory properties activation of the KP is not simply a surrogate marker of inflammation. It also has additional mechanistic effects, modulating a range of physiological processes, including glutamatergic and dopaminergic neurotransmission (Savitz, Reference Savitz2020). The literature generally shows a decrease in KynA and/or an increase in QA in depressed samples relative to controls (Bay-Richter et al., Reference Bay-Richter, Linderholm, Lim, Samuelsson, Traskman-Bendz, Guillemin and Brundin2015; Doolin et al., Reference Doolin, Allers, Pleiner, Liesener, Farrell, Tozzi and O'Keane2018; Myint et al., Reference Myint, Kim, Verkerk, Scharpe, Steinbusch and Leonard2007; Savitz et al., Reference Savitz, Drevets, Smith, Victor, Wurfel, Bellgowan and Dantzer2015; Savitz et al., Reference Savitz, Drevets, Wurfel, Ford, Bellgowan, Victor and Dantzer2015; Wurfel et al., Reference Wurfel, Drevets, Bliss, McMillin, Suzuki, Ford and Savitz2017) and a lower ratio of KynA to QA is associated with greater symptoms of anhedonia (Savitz et al., Reference Savitz, Drevets, Wurfel, Ford, Bellgowan, Victor and Dantzer2015). These data raise the possibility that excess QA leads to excitotoxicity, dendritic atrophy, and impaired neuroplasticity (Savitz, Reference Savitz2020). Like many other anti-depressant treatments, psychotherapy has been postulated to enhance neuroplasticity thereby altering information processing and learning (Castren, Reference Castren2013; Sharpley, Reference Sharpley2010). Thus, in theory, CBT interventions could exert their therapeutic effects at least in part via modulation of the KP, and the balance between KynA and QA at the baseline could conceivably predict treatment efficacy. However, to our knowledge, this hypothesis has never been tested.
This work, therefore, had two principal aims. The first aim was to determine the effects of BA on serum levels of KP metabolites and their association with an improvement in psychological symptoms. The second main aim was to determine whether KP metabolites predicted treatment response. Based on our prior work in independent samples (Meier et al., Reference Meier, Drevets, Wurfel, Ford, Morris, Victor and Savitz2016; Savitz et al., Reference Savitz, Drevets, Wurfel, Ford, Bellgowan, Victor and Dantzer2015; Young et al., Reference Young, Drevets, Dantzer, Teague, Bodurka and Savitz2016), the primary outcome variable was KynA/QA. Other KP metabolites and inflammatory markers were secondary and exploratory outcomes. The hypotheses and analysis plan were pre-registered in the Open Science Framework on 14 November 2019 under the title, ‘Inflammatory Mechanisms and Predictors of Response to Behavioral Activation Therapy for Depression’ (https://osf.io/nzf6v).
Methods
Informed consent
Written informed consent was obtained from all participants and the study was approved by the Western Institutional Review Board. The authors assert that all procedures contributing to this work comply with the ethical standards of the relevant national and institutional committees on human experimentation and with the Helsinki Declaration of 1975, as revised in 2008. Participants were compensated for their time completing assessments but were not compensated for time spent completing therapy.
Study design
This study combined data collected as part of two larger clinical trials focused on identifying whether neuroimaging and behavioral indices related to approach-avoidance behavior were predictive of treatment response in: (1) a non-randomized, unblinded clinical trial in which all enrolled participants had clinically significant depression and completed BA therapy (ClinicalTrials.gov: no. NCT02602340); and (2) a randomized, unblinded clinical trial in which enrolled participants had clinically significant generalized anxiety disorder (GAD) symptoms and were randomized to complete either BA or exposure-based therapy (Santiago et al., Reference Santiago, Akeman, Kirlic, Clausen, Cosgrove, McDermott and Aupperle2020) (ClinicalTrials.gov: no. NCT02807480). From the latter study, we only included individuals in the present analysis if they reported elevated depression symptoms as per the first study [i.e. Patient Health Questionnaire-9 (PHQ-9) scores > 9] and if they were randomized to complete BA rather than exposure-based therapy. Other than the symptom severity requirements relating to GAD and depression, the inclusion/exclusion criteria were identical across the two studies. For both studies, participants were recruited from outpatient mental health clinics and the general community through electronic and print advertisements. All participants completed baseline clinical, behavioral, and neurobiological assessments before and after completion of 10 weeks of group-based BA therapy, and then repeated clinical, behavioral, and neurobiological assessments.
Participants
Fifty-six individuals aged 18–55 years were included in the two studies. Participants enrolled in the study focused on depression were required to have clinically significant depression symptoms, i.e. a score > 9 on the PHQ-9. While meeting DSM criteria for major depressive disorder (MDD) was not required for inclusion, 93.4% met criteria for lifetime MDD. Diagnostic criteria were assessed using the Mini International Neuropsychiatric Interview (MINI 7.0) (Sheehan et al., Reference Sheehan, Lecrubier, Sheehan, Amorim, Janavs, Weiller and Dunbar1998), administered by trained masters or nurse-level research assistants, and supervised by board-certified psychiatrists and licensed clinical psychologists. Participants enrolled in the study focused on GAD were required to have clinically significant GAD symptoms, i.e. a score > 10 on the GAD-7 (and required to score > 9 on the PHQ-9 to be included in the present analysis). Exclusion criteria for both studies included: (1) suicidal ideation with current intent or plan; (2) history of substance use disorder in the past 6 months; (3) meeting diagnostic criteria for psychotic, bipolar, obsessive-compulsive, or eating disorders; (4) moderate to severe traumatic brain injury or other neurocognitive disorder; (5) severe or unstable medical conditions, including inflammatory and autoimmune disorders (except hypothyroidism); (6) magnetic resonance imaging contraindications, such as metal or metallic devices in the body; (7) non-correctable vision or hearing problems; and (8) current use of antipsychotics or mood stabilizers. Depression or GAD was required to be considered as the primary area of concern, though comorbid disorders (e.g. anxiety disorders, PTSD) were not excluded (see Table 1 for the prevalence of these comorbidities). Participants reporting current use of antidepressants (n = 14) were included as long as the dose had been stable for 6 weeks prior to enrollment. Participants were excluded if they were concurrently engaged in psychosocial treatments specifically targeting depression or related symptoms. Individuals receiving psychosocial treatments for other symptoms, or treatments that were not specifically targeting depressive symptoms (e.g. ongoing support groups, couples’ therapy) were not excluded. Inclusion/exclusion criteria were designed to decrease potential confounders while also supporting the generalizability of results to patient populations in the community.
Table 1. Demographical and clinical characteristics of the participants
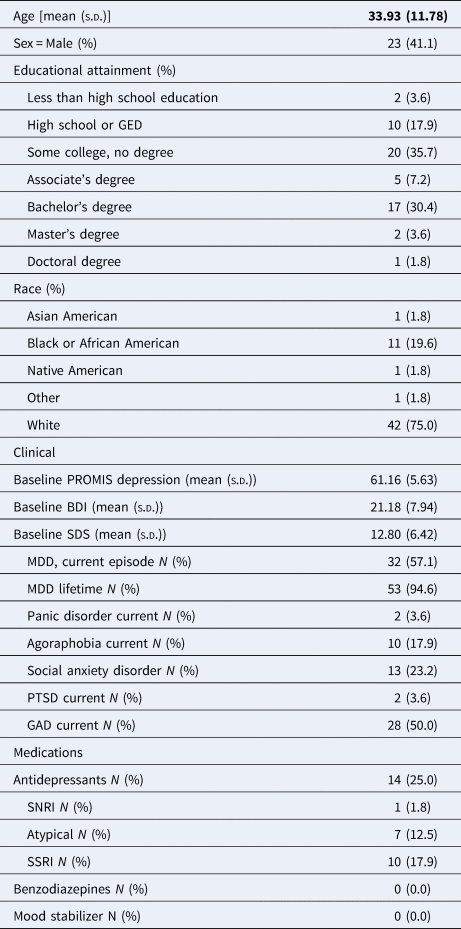
GAD, generalized anxiety disorder; PTSD, post-traumatic stress disorder; BDI, Beck depression inventory; SDS, Sheehan Disability Scale; SNRI, serotonin-norepinephrine reuptake inhibitor; SSRI, selective serotonin reuptake inhibitor.
Intervention
BA consisted of 10 weekly, 90 min sessions delivered in a group format. Participants were included in one of seven different therapy groups, each of which had a total of 6–10 participants. A structured, group-based BA manual was developed by co-authors RLA and CM (with edits and revisions provided by ANC), informed by previously published BA treatment guides (Martell et al., Reference Martell, Dimidjian and Herman-Dunn2010). Each participant was provided BA self-help materials (Addis & Martell, Reference Addis and Martell2004) to accompany the intervention, as well as ‘homework’ worksheets for monitoring of one's activities and associated mood (including during BA exercises) and for helping implement various BA concepts [e.g. monitoring of antecedents, behaviors, and consequences (‘ABC’)]. Brief descriptions of each intervention are provided below. Fidelity was confirmed via an independent rater for randomly selected sessions (24 of the 70 sessions, or 34%). Further details concerning the delivery of the interventions, training of therapists, and fidelity ratings are provided in the Supplementary materials.
Psychometric measures
All participants were asked to complete self-report measures at baseline (within 6 weeks prior to initiating therapy; mean 2.5 weeks), weekly throughout the intervention, and at post-treatment (within 6 weeks after completing session 10; mean 2.6 weeks). Current analyses focused on clinical assessments administered pre- and post-treatment and weekly during the completion of BA and thus are described herein. The National Institute of Health Patient Reported Outcome Information System [PROMIS (Broderick, DeWitt, Rothrock, Crane, & Forrest, Reference Broderick, DeWitt, Rothrock, Crane and Forrest2013; Cella et al., Reference Cella, Riley, Stone, Rothrock, Reeve, Yount and Group2010)] measure of depressive symptoms (PROMIS-D) and the Sheehan Disability Scale [SDS (Sheehan, Harnett-Sheehan, and Raj, Reference Sheehan, Harnett-Sheehan and Raj1996)] were administered at all time points. The SDS measures functional impairment in three major life domains: work, social life/leisure activities, and family life/home responsibilities. The Beck Depression Inventory [BDI-II (Beck, Steer, Ball, & Ranieri, Reference Beck, Steer, Ball and Ranieri1996)], a widely-used 21-item self-report scale was administered at pre- and post-treatment.
Immunophenotyping
A blood sample was obtained from each subject pre- and post-therapy at similar time points as self-report measures. Only individuals who completed BA were asked to provide a post-treatment blood sample. Blood samples were drawn by venipuncture between 7 am and 11 am. Serum samples were collected with BD Vacutainer serum tubes, processed according to the standard BD Vacutainer protocol, and stored at −80 °C.
IL-6, TNF, and IFNγ were quantified blind to visit with a V-PLEX Panel from Meso Scale Diagnostics with the lowest level of quantification (LLOQ) of 0.07, 0.02, and 0.12 pg/mL, respectively. Samples were run in duplicate with intra-assay coefficients of variation (CV) of 7.28, 2.15, and 4.43%, respectively. IL1-RA was measured with a solid-state ELISA (R&D Systems) with an LLOQ of 31.2 pg/mL and a CV of 2.44%. No samples were below the detectable limit. Concentrations of TRP, KYN, KynA, 3-hydroxykynurenine (3HK), and QA were measured blind to visit by Charles River Laboratories. The serum metabolite concentrations were determined by high-performance liquid chromatography with tandem mass spectrometry (MS/MS) detection using their standard protocols. The LLOQ and intra-assay percentage of the coefficient of variation for each of the KP metabolites were as follows: TRP: 3 μm, 1.4%; KYN: 0.225 μm, 1.6%; KynA: 7.5 nm, 6.6%; 3HK: 5 nm, 3.9%, and QA: 50 nm and 8.6%. Five KynA samples were below the detectible limit (<LLOQ). These concentrations were imputed as 90% of LLOQ.
Statistics
For hypotheses that involved repeated measures (hypotheses 1–4), we used linear mixed-effects models with therapy groups and subjects nested within each therapy group as random effects, plus first-order autocorrelation (AR1) correlation structure to capture within-group subject dependency (LMM), and estimated parameters using restricted maximum likelihood estimation (REML) method. With our sample size, REML was shown to have coverage probability at or above 0.95 nominal level (Finch, Reference Finch2017). For analyses with binary outcomes (hypothesis 5), general linear mixed models (GLMMs) were implemented with the post-intervention measure as the outcome and the pre-intervention measure as an independent variable (fixed-effect) and therapy groups as a random effect. For all analyses, age, sex, BMI, and their possible combinations were tested as covariates using Bayesian information criterion (BIC) and the model with the minimum BIC score was chosen.
Hypothesis 1: BA will decrease symptoms of depression and disability.
The primary outcome was the PROMIS-D and the secondary outcomes were the SDS and BDI. Weekly measures of PROMIS-D and SDS scores were analyzed by LMM with time as a fixed-effect of interest (random effects as described above). BDI scores were collected at pre- and post-BA and were analyzed by LMM using the same fixed and random effects with two levels in the time variable. For PROMIS-D, p = 0.05 was considered significant. For SDS and BDI, p = 0.025 was considered significant. No covariates were selected for PROMIS-D and SDS models based on BIC. For BDI, sex was included as a covariate.
Hypothesis 2: BA will result in an increase in protective KYN metabolites and/or a reduction in inflammatory metabolites from baseline to post-treatment.
KP metabolites and inflammatory markers pre- and post-BA were analyzed by LMM with two levels in the time variable as a fixed-effect of interest (random effects as described above). For KynA/QA, p = 0.05 was considered significant and no covariates were included based on BIC. For all other markers, the false positive rate (FDR) was controlled at 5% level using Benjamini–Hochberg's procedure.
Hypothesis 3: An improvement in symptoms of depression with BA will be associated with the change in KP metabolites and inflammatory markers.
PROMIS-D, BDI, and SDS scores were used as response variables in LMMs using (a) post-BA v. -pre-BA percent changes in metabolite levels, (b) time, (c) changes in metabolite by time interactions, and (d) where applicable, age, sex, and/or BMI as fixed-effects, and random effects as described above. For KynA/QA, p = 0.05 was considered significant. For all other markers, the FDR was controlled at 5% level using Benjamini–Hochberg's procedure.
Hypothesis 4: Reduced serum concentrations of protective KP metabolites and/or elevated inflammatory metabolites at baseline will predict the efficacy of BA.
PROMIS-D, BDI, and SDS scores were used as response variables in LMMs using (a) pre-BA metabolite levels, (b) time, (c) pre-BA metabolite by time interactions, and (d) where applicable, age, sex, and/or BMI as fixed-effects and random-effects as described above. For KynA/QA, p = 0.05 was considered significant. For all other markers, the FDR was controlled at 5% level using Benjamini–Hochberg's procedure.
Hypothesis 5: Reduced serum concentrations of protective KP metabolites and/or elevated inflammatory metabolites at baseline will predict lack of response to BA for depression. The response was defined as a reliable change index (RCI) from baseline in the PROMIS-D surpassing 1.96 (Zahra & Hedge, Reference Zahra and Hedge2010). The RCI was calculated using the formula $\sqrt {2 \times {\rm (S}{\rm E}_{{\rm PROMIS-D}}^2 {\rm )}}$ , where SEPROMIS-D was defined as (S.D. PROMIS- $\hbox{D}_{{\rm time1}} ) \times \sqrt {1-\hbox{RE}\hbox{L}_{{\rm PROMIS-D}}}$
 . The test–retest reliability of PROMIS-D (RELPROMIS-D = 0.71) was identified by averaging the results of previous studies (Bartlett et al., Reference Bartlett, Orbai, Duncan, DeLeon, Ruffing, Clegg-Smith and Bingham2015; Bernstein et al., Reference Bernstein, Zhang, Lix, Graff, Walker and Fisk2018; Deyo et al., Reference Deyo, Ramsey, Buckley, Michaels, Kobus, Eckstrom and Morris2015; Hitchon et al., Reference Hitchon, Zhang, Peschken, Lix, Graff, Fisk and Marrie2020; Pilkonis et al., Reference Pilkonis, Yu, Dodds, Johnston, Maihoefer and Lawrence2014; Yount et al., Reference Yount, Beaumont, Chen, Kaiser, Wortman, Van Brunt and Cella2016). The test–retest reliability for the BDI-II was based on psychometric data provided in the corresponding manual (Beck, Steer, & Brown, Reference Beck, Steer and Brown1996), i.e. RELBDI = 0.92. Response status based on RCI was used as the binary outcome variable in a GLMM logistic regression, with the normalized baseline KP metabolite or cytokine concentration as the predictor variable and inclusion of covariates determined via BIC as fixed effects, and therapy groups as a random effect. For KynA/QA, p = 0.05 was considered significant. For all other markers, an FDR correction was employed.
Results
As part of the larger clinical study, blood samples were available for 56 individuals prior to beginning BA, and of the 33 individuals that completed the therapy 29 had blood samples collected (Fig. 1). A total of 11 out of 33 subjects (33%) were classified as responders based on the RCI for PROMIS-D and 18/33 (55%) based on the BDI RCI. Inter-correlations between the biomarkers and clinical-rating scales for both pre and post-therapy visits are shown in online Supplementary Fig. S2. As expected, Kyn/TRP a surrogate marker of KP activation was significantly correlated with QA at both the pre- (r = 0.78, p < 0.001) and post-therapy (r = 0.58, p = 0.001) visits. Similarly, QA and 3-HK were significantly correlated at both pre- (r = 0.57, p < 0.001) and post-therapy (r = 0.54, p = 0.002) visits. IL1-RA, but not TNF and IL-6, was significantly correlated with QA at the pre-therapy (r = 0.28, p = 0.040) but not the post-therapy visit (r = 0.29, p = 0.121). SDS scores but not depression scores were inversely associated with KYN/TRP (r = −0.36, p = 0.007) and QA (r = −0.30, p = 0.025) levels at baseline but not post-therapy (KYN/TRP: r = −0.23, p = 0.238; QA: r = −0.26, p = 0.167).

Fig. 1. CONSORT diagram for each sub-study showing participants approached/enrolled as of 2 February 2018, with added information concerning the number who completed the blood draw and reasons for not completing the blood draw.
Hypothesis 1: There was a significant main effect of time with decreases in PROMIS-D (F 11,352 = 4.1, p < 0.001, Cohen's d = 0.62 for pre-post changes), BDI (F 1,33 = 22.1, p < 0.001, d = 1.64), and SDS (F 11,354 = 3.2, p < 0.001, d = 0.52) scores at the post-therapy visit (Fig. 2).

Fig. 2. Mean change in PROMIS-depression (left panel), Sheehan Disability Scale (SDS; middle panel), and Beck depression inventory (BDI, right panel) scores (y-axis) over the 10-week course of BA therapy (x-axis). The error bars represents the standard error of the means. Solid and dashed lines represent all participants (n = 56) and participants who completed at least seven BA therapy sessions (n = 34), respectively.
Hypothesis 2: There was a significant increase in KynA/QA post therapy relative to baseline (F 1,27 = 32.9, p < 0.001, d = 2.2, Fig. 3). Secondary analyses showed that the effect was driven by a decrease in QA post therapy (F 1,27 = 77.6, Benjamini–Hochberg corrected p < 0.001, d = 3.39). A nominal decrease over time was also observed for KYN/TRP (F 1,27 = 4.1, p = 0.054, uncorrected, Benjamini–Hochberg corrected p = 0.322, d = 0.78). There were no significant changes in cytokine concentrations.

Fig. 3. Box and whisker plots showing the distribution of kynurenic acid to quinolinic acid ratios (KynA/QA) (left panel), KynA (top right panel), and QA (bottom right panel) concentrations pre-therapy and post-therapy. The solid line represents the median serum concentration. The boxes above and below the median represent the 50th–75th percentiles and the 25th–50th percentiles of the scores, respectively. The vertical line (whisker) indicates the distribution of scores within 1.5 times of the interquartile range. The change in concentration pre-therapy to post-therapy is shown for each individual participant with a solid line.
Hypothesis 3: The magnitude of the increase in KynA/QA post-therapy was not associated with the corresponding decrease in PROMIS-D (F 11,218 = 0.9, p = 0.504), BDI (F 1,26 = 0.4, p = 0.552), or SDS (F 11,220 = 1.0, p = 0.450) scores. Secondary analyses indicated that a greater decrease in IL-1RA post-therapy was associated with a greater reduction in PROMIS-D (F 11,218 = 2.6, uncorrected, p = 0.004, Cohen's f 2 = 0.084), but the association did not survive FDR correction (Benjamini-Hochberg adjusted p = 0.141). The change in IL-RA was not associated with BDI (F 1,26 = 1.6, p = 0.214, uncorrected) or SDS (F 11,220 = 0.6, p = 0.795, uncorrected) scores.
Hypothesis 4: Baseline levels of KynA/QA did not significantly predict the change in PROMIS-D (F 11,330 = 0.9, p = 0.540, uncorrected), BDI (F 1,31 = 0.1, p = 0.733, uncorrected), or SDS (F 11,332 = 0.6, p = 0.866, uncorrected) scores over time. No individual KP metabolites or cytokines predicted the magnitude of the change in clinical-scale scores pre-therapy v. post-therapy in secondary analyses.
Hypothesis 5: Baseline KynA/QA did not predict response status to BA as measured by PROMIS Depression or BDI. Exploratory analyses showed that treatment responders as defined by the BDI had nominally higher baseline concentrations of KYN [odds ratio (OR) 52.36, 95% confidence interval (CI) 0.89–3089, p = 0.057, uncorrected], Kyn/Trp (OR 8.80, 95% CI 1.15–67.22, p = 0.036, uncorrected), and IL-6 (OR 4.05, 95% CI 1.13–14.56, p = 0.032, uncorrected) compared to non-responders (Fig. 4).

Fig. 4. Box and whisker plots showing the difference in baseline (pre-therapy) concentrations of kynurenine (left panel), kynurenine to tryptophan (Kyn/Trp, middle panel), and interleukin-6 (IL-6, right panel) between responders and non-responders to therapy defined on the basis of the reliable change index (RCI) for the BDI.
Discussion
This study aimed to determine the effects of BA on serum levels of KP metabolites and their association with an improvement in depressive symptoms. Consistent with our hypothesis, there was a highly significant increase in the primary outcome, KynA/QA, at the post-therapy visit compared to baseline. The increase in KynA/QA at the post-therapy visit was driven by a decrease in QA. QA is thought to produce neurotoxic effects via multiple different mechanisms, including NMDA receptor-induced excitotoxicity, the generation of reactive oxygen species, disruption of the blood–brain barrier, destabilization of the cellular cytoskeleton, increasing tau phosphorylation, disruption of autophagy, and the induction of proinflammatory response in astrocytes (Guillemin, Reference Guillemin2012). Under inflammatory conditions, metabolism of KYN down the QA pathway is favored because QA is metabolized into NAD+, a cellular energy source needed by activated immune cells (Savitz, Reference Savitz2020). Consistent with this model, QA was positively correlated – albeit modestly – with IL-1RA at baseline. Similarly, the first step of the KP, i.e. the conversion of TRP to KYN by the enzyme, indoleamine dioxygenase (IDO) is also increased by inflammation. KYN/TRP is considered to be a surrogate marker of IDO activity and was modestly correlated with TNF at baseline. Thus, the post-therapy decreases in QA and KYN/TRP may be due to a partial resolution of inflammation in participants receiving therapy.
In line with the inflammatory model of depression, decreases in KynA and/or increases in peripheral QA concentrations are commonly reported in depressed populations compared with healthy controls (Savitz, Reference Savitz2020). Furthermore, post-treatment shifts in the metabolic balance between the KynA and QA branches of the KP have been reported in three different conventional treatments for depression as well as exercise, which also has anti-depressant effects (Mura, Moro, Patten, & Carta, Reference Mura, Moro, Patten and Carta2014). First, escitalopram increased circulating concentrations of KynA/QA, an effect driven by a decrease in QA (Halaris et al., Reference Halaris, Myint, Savant, Meresh, Lim, Guillemin and Sinacore2015). There were no treatment-associated changes in seven inflammatory cytokines as well as CRP. Second, three studies have demonstrated that response to ketamine is associated with either an increase in KynA or a decrease in QA. Relative to non-responders, ketamine responders displayed increased KynA as well as KynA/KYN from 24 h after the first infusion until at least 2 weeks after the initiation of treatment (Zhou et al., Reference Zhou, Zheng, Liu, Wang, Zhan, Li and Ning2018). Similarly, ketamine treatment increased KynA (but not KynA/QA) concentrations and decreased QA/Kyn (but not QA) concentrations within three days of infusion in patients with treatment-resistant bipolar disorder (Kadriu et al., Reference Kadriu, Farmer, Yuan, Park, Deng, Moaddel and Zarate2019). In a third study, ketamine was shown to reduce QA production by microglia in mice and further, in depressed patients, a reduction in QA after treatment was associated with an improvement in depressive symptoms (Verdonk et al., Reference Verdonk, Petit, Abdel-Ahad, Vinckier, Jouvion, de Maricourt and Gaillard2019). Third, 2 weeks of electroconvulsive therapy (ECT) resulted in a significant increase in plasma KynA/QA, an effect driven by a decrease in QA (Schwieler et al., Reference Schwieler, Samuelsson, Frye, Bhat, Schuppe-Koistinen, Jungholm and Erhardt2016). Similar to this study, ECT had no effect on the concentrations of four different cytokines. Fourth, endurance exercise increased plasma concentrations of KynA and KynA/QA in healthy volunteers (Schlittler et al., Reference Schlittler, Goiny, Agudelo, Venckunas, Brazaitis, Skurvydas and Andersson2016). The above data, taken together with the results of this study, raise the possibility that the KP may be a common mechanistic pathway underlying the therapeutic efficacy of diverse anti-depressant treatments.
This common pathway may involve neuroplasticity, i.e. the activity-dependent modification of the structure and function of neural circuitry. There is a salient overlap in the molecular changes induced by anti-depressant treatments and the mechanisms of neuroplasticity (Pittenger & Duman, Reference Pittenger and Duman2008). These molecular mechanisms include alterations in glutamatergic neurotransmission via changes to NMDA receptors which are essential mediators of activity-dependent synaptic plasticity (Paoletti, Bellone, & Zhou, Reference Paoletti, Bellone and Zhou2013). Conceivably, the balance between the NMDA receptor antagonist, KynA, and the NMDA receptor agonist, QA, may modulate synaptic plasticity (Savitz, Reference Savitz2020). If normalization of the KP is a therapeutic mechanism common to diverse therapies, the KP could be a potential treatment target. Indeed several treatments targeting the KP are under development (Savitz, Reference Savitz2020). Furthermore, identifying psychotherapeutic interventions that have maximal impact on the KP may help to increase the efficacy of BA. For instance, identifying specific BA exercises that more meaningfully engage the reward circuitry and impact QA (e.g. physical v. social activities etc.) or identifying strategies to optimize the impact of BA exercises on neuroplasticity (i.e. enhance the consolidation of reward learning through post-activity processing) could theoretically help to fine-tune the psychotherapeutic intervention. Conceivably, synergistic effects could also be obtained by combining therapies that target the KP, for instance combining BA with one or more of the treatment modalities mentioned above.
There were three other secondary findings of interest. First, baseline KynA/QA did not significantly predict response to BA as predicted (hypotheses 4 and 5). The absence of a significant therapeutic response biomarker for BA in this study is unfortunately consistent with much of the literature which shows a robust effect of several psychological interventions on immune parameters (Shields et al., Reference Shields, Spahr and Slavich2020) but few instances in which these baseline immune parameters are reported to be predictive of treatment outcome. Second, the magnitude of the decrease in IL-1RA concentrations post-therapy was associated with the magnitude of the decrease in PROMIS-D (but not BDI) scores (hypothesis 3) although this result was not significant after FDR correction. IL-1RA (as well as several other cytokines) were reported to be decreased after 12 weeks of psychotherapy although the decrease in IL-1RA was not related to the improvement in symptoms (Dahl et al., Reference Dahl, Ormstad, Aass, Sandvik, Malt and Andreassen2016). Because IL-1RA inhibits the activities of IL-1β, IL-1RA is generally increased by IL-1β and is therefore usually considered to be a surrogate marker of IL-1β concentration (Bartfai et al., Reference Bartfai, Sanchez-Alavez, Andell-Jonsson, Schultzberg, Vezzani, Danielsson and Conti2007). IL-1β is a pro-inflammatory cytokine that has been reported to be elevated in some MDD populations (Howren, Lamkin, & Suls, Reference Howren, Lamkin and Suls2009) but whose concentration in the blood is generally too low to measure reliably. Given our hypothesis that changes in neuroplasticity may underlie the anti-depressant effects of various therapeutic interventions, it is potentially noteworthy that IL-1β has been shown to modulate neuroplasticity in several animal models (Lynch, Reference Lynch2015; Patterson, Reference Patterson2015). It is unclear why the PROMIS-D would be more sensitive to the change in IL-1RA than the BDI but one possibility is that the two scales are weighted differently in terms of the symptoms that they measure. Alternatively, because the PROMIS-D was administered at every session whereas that BDI was only administered pre-and-post therapy, differences in the statistical models may have accounted for the discrepant results. Another secondary finding was that higher baseline concentrations of Kyn/TRP and IL-6 were present in responders v. non-responders defined by the BDI (hypothesis 5). It is unclear if this result is robust since it did not survive FDR correction and it was not observed when response v. non-response was defined based on the PROMIS-D or when the response was considered as a continuous variable (hypothesis 4). Nevertheless, there are isolated reports in the literature of higher concentrations of IL-6 in responders v. non-responders to SSRIs (Yoshimura et al., Reference Yoshimura, Hori, Ikenouchi-Sugita, Umene-Nakano, Katsuki, Atake and Nakamura2013) and ECT (Kruse et al., Reference Kruse, Congdon, Olmstead, Njau, Breen, Narr and Irwin2018) and therefore these results may be worthwhile following up in future studies.
This study has several limitations. First, since this was a naturalistic study without a placebo control group we cannot determine if the reduction in QA is the consequence of BA, per se, or whether it is due to reductions in depressive symptoms due to non-specific factors such as placebo-effects, natural fluctuations in mood, or possible indirect effects of BA on the KP such as changes in diet, exercise or sleep. Second, a dedicated anhedonia scale was not included. Given the close link between inflammation and anhedonia, it is possible that anhedonic symptoms would be most sensitive to changes in inflammation. Third, KP metabolites and inflammatory cytokines were measured in serum and not the cerebrospinal fluid (CSF). Nevertheless, KYN and TRP are known to cross the blood–brain barrier and there is some evidence that QA also has this capacity (Heyes & Morrison, Reference Heyes and Morrison1997). This may explain the significant correlations between KYN/TRP (r = 0.77), and QA (r = 0.55) concentrations in the blood and CSF reported in a recent study of depressed patients (Haroon et al., Reference Haroon, Welle, Woolwine, Goldsmith, Baer, Patel and Miller2020). Fourth, although there are known sex differences in immune function (Klein & Flanagan, Reference Klein and Flanagan2016) and the KP (de Bie, Lim, & Guillemin, Reference de Bie, Lim and Guillemin2016; Meier et al., Reference Meier, Drevets, Teague, Wurfel, Mueller, Bodurka and Savitz2018), this study was not adequately powered to detect such effects. Fifth, given that we focused our analysis on one pre-registered primary outcome (KYNA/QA), this variable was not corrected for multiple comparisons (though secondary outcomes were). Larger studies could be useful for performing confirmatory analyses and exploratory investigations of a wider range of immune markers. Lastly, BA was conducted via a manualized, group therapy. While the level of symptom decrease observed here is similar to what has been reported in previous studies delivering BA as individual therapy (Dimidjian et al., Reference Dimidjian, Hollon, Dobson, Schmaling, Kohlenberg, Addis and Jacobson2006), the generalizability of findings in different formats cannot be determined.
In sum, the principal finding of this study was a significant post-therapy increase in the neuroprotective index, KynA/QA that was driven by a robust decrease in circulating QA concentrations. This result is consistent with prior reports of escitalopram, ketamine, ECT, and exercise-induced increases in KynA/QA, and raises the possibility that changes in the KP may contribute to the efficacy of several different treatments for depression. Future controlled studies are needed to test this hypothesis.
Supplementary material
The supplementary material for this article can be found at https://doi.org/10.1017/S0033291720004389
Acknowledgements
The authors thank all the research participants and wish to acknowledge the contributions of Brenda Davis, Debbie Neal, Chibing Tan, and Ashlee Rempel from the laboratory of TKT at the University of Oklahoma Integrative Immunology Center towards the transport, processing and handling of all blood samples as well as the measurement of cytokines. The authors also wish to thank Dr Ruth Hermann-Dunn for her work in conducting fidelity ratings for therapy sessions.
Financial support
This work was supported by the William K. Warren Foundation, the National Institute of Mental Health (K23MH108707; R21MH113871), and the National Institute of General Medical Sciences (P20GM121312).
Conflict of interest
Dr Paulus has received royalties for an article about methamphetamine use disorder from UpToDate. The other authors have no disclosures.
Ethical standards
The authors assert that all procedures contributing to this work comply with the ethical standards of the relevant national and institutional committees on human experimentation and with the Helsinki Declaration of 1975, as revised in 2008.


