


Significant outcomes
∙ Serum levels of complement factors are increased while peripheral blood levels are decreased in bipolar disorder (BD).
∙ Complement levels are decreased in advanced stages of BD suggesting time-dependent increased consumption of the complement system by as yet unknown factors.
∙ Levels of certain complement factors are correlated with severity of manic symptoms suggesting involvement of these factors in BD pathogenesis.
Limitations
∙ There was not a medication-free control group.
∙ The participants consisted of relatively small groups.
Introduction
BD is a highly prevalent and chronic mood disorder characterised by recurrent mania, hypomania and major depression episodes (Reference Belmaker1). It has long been established that the BD physiopathology does not only affect the central nervous system but also produces systemic biochemical and immunological alterations (Reference Berk, Kapczinski and Andreazza2). Several studies have shown polymorphisms in the inflammation-related genes and alterations of the peripheral markers of inflammation (Reference Drexhage, Knijff and Padmos3–Reference Ozdemircan, Dasdemir, Kucukali, Bireller, Ozturk and Cakmakoglu5). The most notable of these alterations are elevated levels of the proinflammatory cytokines [e.g. interleukin-1 (IL-1), IL-6 and tumour necrosis factor-α], acute phase reactants and vascular adhesion molecules. Moreover, the involvement of the innate immune system in BD has increasingly been recognised by reports showing altered expression levels of the receptor P2×7, pentraxin 3 and mannan-binding lectin-associated serine protease-2 (MASP-2) in BD patients (Reference Bhattacharya, Derecki, Lovenberg and Drevets6–Reference Foldager, Köhler and Steffensen8). Altered production of the inflammation factors might have a profound impact on neurotransmitter production, neuroplasticity and cognitive functions in BD patients (Reference Bhattacharya, Derecki, Lovenberg and Drevets6,Reference Soczynska, Kennedy, Goldstein, Lachowski, Woldeyohannes and Mcintyre9,Reference Rosenblat and Mcintyre10). Nevertheless, the impact of inflammatory factor alterations on the disease course or severity of BD has been scarcely investigated.
The complement system is a fundamental component of the inflammation participating in both adaptive and acquired immune responses and recognition of the invading microorganisms. Complement factors are also involved in the clearance of the necrotic, apoptotic and infected neurons and acute phase reactant responses (Reference Tsiftsoglou and Sim11,Reference Mevorach, Mascarenhas, Gershov and Elkon12). Despite their well-known significance in immune system functions and multi-functional characteristics, complement factors have been barely investigated in mood disorders and, in general, levels of inflammatory factors at different stages of BD have not been compared. As inflammation responses often involve the complement system activation, the complement system is involved in neuronal death and both inflammation and neuronal death occur in BD, we hypothesised that complement system factors might be involved in the progression and symptom severity of BD.
To investigate the significance of complement system alterations in BD, we measured serum levels of major classical, alternative and common complement pathway factors, analysed production of complement system factors at messenger RNA (mRNA) level and looked for putative correlations between complement levels and clinical-demographic features of BD patients. These measurements were conducted in first episode and chronic BD patients to find out whether complement expression changes occur due to the inherent deficiency of complement factors or as a result of pathogenic mechanisms of BD.
Methods
Patients
Consecutive unrelated 22 chronic BD patients (≥2 years of disease duration), 24 consecutive first episode BD patients (<5 months of disease duration) and age-gender matched 19 healthy individuals were recruited (Table 1). The diagnosis of BD was based on meeting the DSM-V criteria. Healthy controls were included after negative screening for the presence of a past or current psychiatric symptoms. All patients and controls were Caucasian individuals recruited from the northwestern region of Turkey. Study exclusion criteria for patients were any history of substance abuse, mental retardation (intelligence quotient <80), any other psychiatric or medical disorder, immunomodulating or immunosuppressant drug use, pregnancy or breast feeding, dementia, epilepsy, cranial trauma and immunisation in the last 12 months. Study exclusion criteria for healthy controls were having any chronic disease, history of immunomodulating or immunosuppressant drug use, pregnancy or breast feeding, antidepressant drug use within the last 1 year and mental retardation (intelligence quotient <80). Control subjects with a diagnosis of any DSM-V axis I and II disorders were also excluded. The study was approved by the institutional review board. The study procedures and protocols were approved by the local ethics committee (No. 2016/66-913) and informed written consent was obtained from all subjects. The investigation was carried out according to the principles expressed in the Declaration of Helsinki.
Table 1 Socio-demographic data of the study sample

BD, bipolar disorder; MADRS, Montgomery–Åsberg Depression Rating Scale; YMRS, Young Mania Rating Scale.
All BD patients had active symptoms (manic, depressive and mixed symptoms in 15, 5 and 2 chronic patients, respectively and 16, 5 and 3 patients in first episode patients, respectively) and were using one or more of antidepressants, antipsychotics and lithium at the time of blood sampling. Routine complete blood count and blood biochemistry tests were normal in all participants. The patients were screened during blood sampling on the Montgomery–Åsberg depression rating scale (MADRS) and the young mania rating scale (YMRS) to measure the severity of depressive and manic episodes, respectively.
Enzyme-linked immunosorbent assay (ELISA)
Blood samples of all participants were collected approximately at the same time of the day (08:00–10:00a.m.) to obtain serum and peripheral blood mononuclear cell (PBMC) samples. Serum levels of C4, factor B (Abcam, Cambridge, UK), soluble C5b-9 and neuron-specific enolase (NSE) (Abbexa, Cambridge, UK) were measured by ELISA kits as per manufacturer’s instructions.
Real-time polymerase chain reaction (RT-PCR)
EDTA-anticoagulated peripheral blood of 5 ml was drawn from each patient. PBMCs were isolated by standard Ficoll density-gradient centrifugation and then were washed with 0.01 M phosphate buffer solution (PBS). After centrifugation, the cells were dissolved in 20 μl of PBS and kept frozen at −80°C until the samples were used. RNA was extracted from PBMC using an RNA isolation kit (RNeasy Mini Kit; Qiagen, Hilden, Germany). mRNA levels for complement system factors were determined by RT-PCR with Sybr Green using commercial primers (Qiagen) (Table 2). RNA was reverse transcribed into complementary DNA using random hexamers, dichlorodiphenyltrichloroethane and deoxynucleotide mix (Roche Diagnostics, Mannheim, Germany). PCR reactions were performed on the LightCycler (Roche LightCycler 480 II; Roche Diagnostics). Relative mRNA expression levels were calculated by
 $${\rm 2}^{{{\minus}\Delta \Delta C_{t} }} $$
method using the glyceraldehyde 3-phosphate dehydrogenase (GAPDH) as the reference gene. GAPDH was selected as it has been previously used as a housekeeping gene in PBMC and complement gene expression studies (Reference Pasch, Van Den Bosch, Daha, Bos and Asghar13,Reference Hamidinia, Ghafourian Boroujerdnia and Talaiezadeh14) and was also found out to be the most suitable reference gene in our preliminary experiments.
$${\rm 2}^{{{\minus}\Delta \Delta C_{t} }} $$
method using the glyceraldehyde 3-phosphate dehydrogenase (GAPDH) as the reference gene. GAPDH was selected as it has been previously used as a housekeeping gene in PBMC and complement gene expression studies (Reference Pasch, Van Den Bosch, Daha, Bos and Asghar13,Reference Hamidinia, Ghafourian Boroujerdnia and Talaiezadeh14) and was also found out to be the most suitable reference gene in our preliminary experiments.
Table 2 Primers used in real-time polymerase chain reaction analysis of peripheral blood mononuclear cells of bipolar disorder patients and healthy controls

GAPDH, glyceraldehyde 3-phosphate dehydrogenase.
Statistics
Due to the uneven distribution of data in each group (determined by Kolmogorov–Smirnov test), non-parametric statistical methods were used. Age, education time, serum complement factor and PBMC complement factor mRNA expression levels were compared with Kruskal–Wallis test and Dunn’s post hoc analysis. Gender distribution of study groups was compared with χ2 test. MADRS and YMRS scores were compared among chronic and first episode BD patients with Mann–Whitney U test. Correlation tests were done with Spearman’s correlation test. p<0.05 was considered statistically significant.
Results
Demographic and clinical features of participants
There were no significant differences among study groups in terms of age (mean age±standard deviation, 28.7±4.6, 25.3±6.1 and 25.6±7.6 for chronic BD, first episode BD and healthy controls, respectively; p=0.374 by Kruskal–Wallis) and gender (man/woman ratios 8/14, 7/17 and 8/11 for chronic BD, first episode BD and healthy controls, respectively; p=0.673 by χ2 test; χ2=0.8) distribution. In chronic BD patients, mean disease duration was 7.2±2.8 (range 2–10) years and mean number of manic-depressive episodes was 5.8±1.9 (range 3–11). Chronic BD patients had significantly higher MADRS (13.4±1.3 versus 10.9±4.7; p=0.042 by Mann–Whitney U test; sum of ranks 767 and 1063 for first episode and chronic patients, respectively) and YMRS (33.3±3.8 versus 20.4±8.6; p=0.001 by Mann–Whitney U test; sum of ranks 769 and 1061 for the first episode and chronic patients, respectively) scores than first episode BD patients. There were no significant differences between mood status of BD patients (p=0.929; χ2=0.1) (Table 1).
Serum complement levels and clinical correlates
Serum levels of major classical complement pathway (C4), alternative complement pathway (factor B) and common complement pathway (sC5b-9) factors were measured by ELISA. Chronic BD patients showed significantly lower levels of C4, factor B and sC5b-9 than first episode patients and healthy controls (p<0.001 for all comparisons by Kruskal–Wallis and Dunn’s test) than other groups. There were no significant differences among first episode BD patients and healthy controls in terms of serum complement levels (p>0.05 for all by Kruskal–Wallis and Dunn’s test) (Fig. 1, Table 3). Serum C4 levels but not factor B and sC5b-9 levels showed a significant inverse correlation with disease duration (Spearman’s test) (Fig. 2). Serum levels of none of the studied complement factors correlated with age and number of manic-depressive episodes. YMRS scores showed a significant inverse correlation with only serum sC5b-9 levels (Spearman’s test) (Fig. 2). No significant correlation could be found between MADRS scores and serum levels of complement factors.
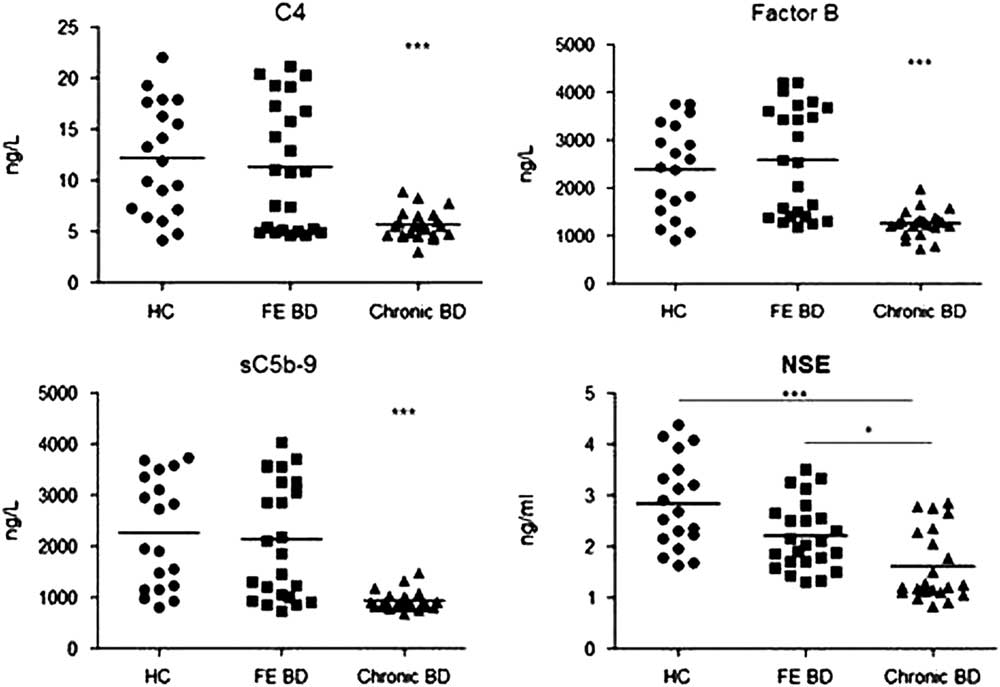
Fig. 1 Serum C4, factor B, sC5b-9 and neuron specific enolase (NSE) levels of healthy controls (HC), first episode (FE) bipolar disorder (BD) patients and chronic BD patients. Horizontal bars indicate mean values. *p<0.05; ***p<0.001.
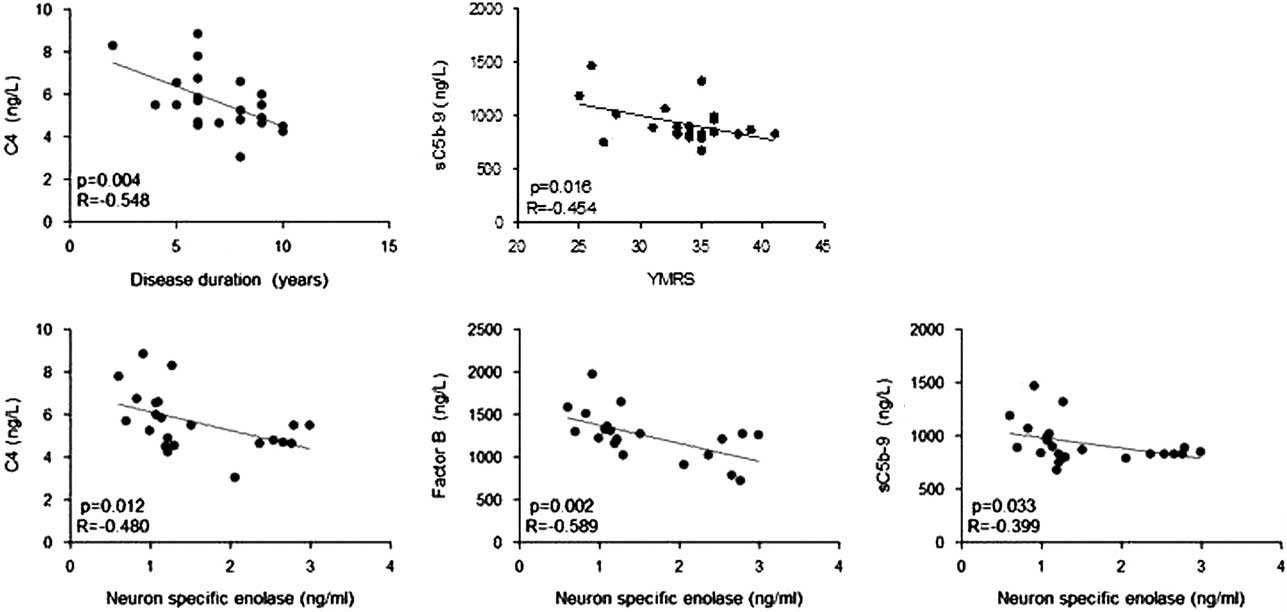
Fig. 2 Statistically significant correlations between serum levels of complement factors versus disease durations, young mania rating scale (YMRS) scores (upper row) and serum neuron specific enolase levels (bottom row). p, p value; R, correlation coefficient.
Table 3 Mean, standard deviation (±SD), range values (in brackets) and Kruskal–Wallis test analysis of complement factor and neuron-specific enolase (NSE) values of healthy control (HC), first episode bipolar disorder (FE BD) and chronic BD patients

DRS, difference in rank sum; ns, not significant.
*p<0.05; ***p<0.001.
NSE measurements
To show a potential association between complement levels and neuronal loss, serum levels of NSE, a putative marker of neuronal damage, were measured by ELISA. Chronic BD patients had significantly lower serum NSE levels than first episode BD patients and healthy controls (p=0.012 and <0.001 by Dunn’s post hoc analysis, respectively). There were no significant differences between serum NSE levels of first episode BD patients and healthy controls (p=0.144 by Dunn’s post hoc analysis) (Fig. 1, Table 3). Serum C4, factor B and sC5b-9 levels were inversely correlated with NSE levels (Spearman’s test) (Fig. 2). No significant correlation could be found between levels of NSE and complement factors in first episode BD and healthy control groups.
Complement mRNA expression levels
To investigate whether the serum complement level reduction of BD patients could be due to the altered production of complement factors, PBMC mRNA expression levels of the classical complement pathway (C1q and C4) and alternative complement pathway (Factor B) factors and PBMC mRNA expression levels of CD55, inhibitor of classical and alternative complement pathways (Reference Dalle Lucca, Li and Simovic15), were assessed by RT-PCR analysis. Chronic BD patients showed significantly elevated expression levels of C1q, C4 and factor B. By contrast, the mRNA expression of the complement inhibitor CD55 was severely suppressed in the chronic BD group (p<0.001 for all comparisons by Dunn’s post hoc analysis). No significant differences could be found between first episode BD patients and healthy controls in terms of PBMC mRNA expression levels of complement factors and complement inhibitor CD55 (p>0.05 for all comparisons by Dunn’s post hoc analysis) (Fig. 3, Table 3). There were no significant correlations between PBMC expression levels of four investigated factors and clinical-demographic features of BD patients and healthy controls. Likewise, PBMC mRNA expression levels and serum levels of C4 and factor B were not significantly correlated in BD patient and healthy control groups.

Fig. 3 Relative C1q, C4, factor B and CD55 expression levels of peripheral blood mononuclear cells (PBMC) obtained from healthy controls (HC), first episode (FE) bipolar disorder (BD) patients and chronic BD patients. Horizontal bars indicate mean values. ***p<0.001.
Discussion
Classical and alternative complement pathway factors are known to be activated by apoptotic neurons (Reference Mevorach, Mascarenhas, Gershov and Elkon12). Moreover, cerebral expression levels of certain complement factors are increased in Alzheimer’s disease suggesting that the complement system might be participating in neuropathology of Alzheimer’s disease (Reference Fischer, Schmoll, Riederer, Bauer, Platt and Popa-Wagner16). In psychiatric disorders, the complement system has most profoundly been studied in schizophrenia and a plethora of reports with conflicting results have been published. However, in general, factors of the classical and alternative complement pathways appear to be upregulated in schizophrenia patients (Reference Mayilyan, Weinberger and Sim17). Although the role of inflammation in the pathogenesis of mood disorders is increasingly being recognised, there are only a few reports on the expression of complement system factors in mood disorders. In one study, increased serum factor B, C3 and C4 levels were found during acute manic episodes (Reference Wadee, Kuschke, Wood, Berk, Ichim and Maes18) and lower MASP-2 levels were reported in BD patients in another study (Reference Foldager, Köhler and Steffensen8).
In this preliminary study, we have shown for the first time that patients with chronic BD exhibit reduced levels of C4 and factor B implicating that classical and alternative complement pathways are both associated with BD pathogenesis. Notably, similar results were obtained when statistical analysis was performed with only BD patients presenting with manic symptoms (data not shown) indicating the significance of the disease activity on complement levels. Our results contradict a previous study, which has found comparable levels of C3 and C4 in BD patients and healthy controls (Reference Santos Sória, Moura Gubert, Ceresér, Gama and Kapczinski19). This discrepancy might be explained by the fact that euthymic BD patients have been recruited in the previous study as opposed to patients with active manic and/or depressive symptoms in our study. On the other hand, euthymic and manic/depressive patients show similar levels of proinflammatory cytokines contradicting against this assumption (Reference Barbosa, Bauer, Machado-Vieira and Teixeira20). Whether complement factor levels are influenced by mood alterations or not needs to be further studied.
Reduced MASP-2 (Reference Foldager, Köhler and Steffensen8) and pentraxin 3 (Reference Dickerson, Stallings and Origoni7) levels have been previously reported in BD patients. Similar to these two factors, the alternative complement pathway component factor B is also involved in innate immunity responses (Reference Zou, Feng, Xu, Jian and Chao21). Therefore, altered levels of these factors in BD patients might be a reflection of impaired innate immunity. Glial activation and neuronal apoptosis might plausibly be enhancing the consumption of immunological factors participating in innate immune responses.
Potential explanations for reduced serum complement levels in BD patients could be (i) inherent complement deficiency, (ii) reduced production or (iii) overconsumption of complement factors. Normal serum complement levels in first episode BD patients and time-dependent reduction of serum C4 levels in chronic BD patients indicate that BD patients do not have an inherent dysfunction that prevents complement production or activation. However, our results do not exclude the possibility that a genetic dysfunction in the complement system, even if not altering basal levels of the complement components, could predispose the individual to complement level alterations after exposure to stressful events and thus contributing to the chronicity of the disease. Therefore, this possibility should be delineated in future studies through screening of genes involved in the complement production for potential polymorphisms or epigenetic alterations.
Complement components are primarily produced by the liver (Reference Nesargikar, Spiller and Chavez22), which is not easily accessible in living patients. To estimate the production rates of complement factors, their expression levels were evaluated in PBMC. In striking contrast with serum levels, mRNA expression levels of classical and alternative complement pathway factors were increased in chronic BD patients indicating that complement factor production is not compromised in BD. In view of these findings, a likely hypothesis is that reduced serum complement level findings is the end-result of excessive activation of the complement cascade and subsequent overconsumption of complement factors. Also, enhanced complement mRNA expression and reduced mRNA expression of the major complement inhibitor CD55 might be reflections of the compensating measures to overcome the complement deficiency induced by excessive consumption. However, the absence of an inverse correlation between serum and PBMC mRNA levels of C4 and Factor B contradicts the assumption that the complement production is increased as a response to reduced serum complement levels. Proinflammatory cytokines are known to facilitate the complement production by PBMC (Reference Markiewski and Lambris23) and these cytokines are known to be increased in BD patients (Reference Drexhage, Knijff and Padmos3). Thus enhanced cytokine production in chronic BD might be contributing to increased PBMC complement mRNA levels.
Consumption of complement factors might be induced by the neuronal death that is known to occur in certain regions of the central nervous system in BD (Reference Manaye, Lei, Tizabi, Dávila-García, Mouton and Kelly24). Complement factors can also be utilised for labelling unwanted synapses and their elimination by complement-mediated mechanisms, a process that is activated in neurodegenerative disorders (Reference Stevens, Allen and Vazquez25). In this context, NSE measurements were conducted to estimate neuronal loss and its association with serum complement levels. Levels of NSE are increased in serum in cases with acute neuronal injury (Reference Antonopoulos and Kadoglou26). By contrast, NSE levels are reduced in healthy individuals and Alzheimer disease patients with higher levels of brain atrophy indicating that NSE might be a putative indicator of neuronal death (Reference Streitbürger, Arelin and Kratzsch27). NSE levels of the healthy controls of our study were within the previously published ranges (1.5–12.5 ng/ml) for healthy individuals (Reference Wiener, Jansen and Ghisleni28,Reference Fizazi, Cojean and Pignon29), whereas, in compliance with a previous study (Reference Wiener, Jansen and Ghisleni28), some of the first episode and most of the chronic BD patients showed reduced (<1.5 ng/ml) NSE levels. Significant inverse correlation of NSE levels with levels of C4, factor B and sC5b-9 suggest that the neuronal apoptosis observed in certain brain regions of BD patients might be at least one of the factors triggering complement activity and leading to the complement overconsumption. On the other hand, it should be noted that all correlation coefficient (R) values were <0.6 and thus, despite significant p values, correlations between NSE and complement levels might indicate a weak association. Therefore the significance of the association between NSE and complement levels need to be further studied with larger patient groups.
A limitation of our study was the absence of a drug-free control group. Although both BD groups in our study were receiving different combinations of antidepressant, antipsychotic medications and lithium, chronic BD patients were exposed to these medications for a longer time period and thus observed complement level alterations could merely be a medication side effect. Although haloperidol does not appear to affect the complement activity (Reference Sasaki, Nanko, Fukuda, Kawate, Kunugi and Kazamatsuri30), in general little is known about the impact of other BD medications such as atypical antipsychotics, lithium and antidepressants on the complement metabolism and production. Due to low case numbers of our patient groups, a subgroup analysis for the comparison of different medications on complement levels could not be performed.
As another notable finding, sC5b-9 levels were found to be inversely correlated with YMRS but not MADRS scores suggesting that complement system alterations are more closely associated with manic symptoms in BD. Alternatively, absence of correlation with MADRS scores might possibly be due to low case numbers with depressive symptoms. In general, as another limitation, low number of cases without manic symptoms prevented to assess the differential impact of manic and depressive symptoms on studied complement parameters. Nevertheless, the validity of sC5b-9 as a prognostic biomarker in BD requires to be further studied.
There is accumulating evidence indicating that BD is marked by multi-systemic abnormalities and the fact that most BD patients treated with monoamine-based medications fail to achieve full recovery supports this notion. The central nervous system inflammation governed by the complement system might be one of the fundamental role players in BD pathogenesis. Future research delineating the participation of different complement factors in BD pathogenesis might yield novel targets for innovation of therapeutic strategies in management of BD.
Acknowledgements
This work was supported by the Research Fund of Istanbul University, Project No: 57877. Authors’ Contribution: U.A. and S.K. were involved in acquisition of data and drafting the article. C.İ.K. and S.Ç. were involved in conception and design of the study, revising the article critically for important intellectual content. E.T. was involved in conception and design of the study, analysis and interpretation of data, drafting the article. All authors approved the final version of the article.
Conflicts of Interest
The authors report no conflicts of interest.
Ethical Standards
The authors assert that all procedures contributing to this work comply with the ethical standards of the relevant national and institutional committees on human experimentation and with the Helsinki Declaration of 1975, as revised in 2008.


