


1. Introduction
Transpressional shear zones are common deformational features in many tectonic settings that accommodate significant amounts of strain across oblique convergent plate boundaries. During oblique convergence, lithospheric plates undergo shortening and transpressional deformation (Sanderson & Marchini, Reference Sanderson and Marchini1984; Tikoff & Teyssier, Reference Tikoff and Teyssier1994) which are associated with a wide orogenic belt. The tectonic transport vector is an effective parameter to specify the geometry and kinematics of deformation (Elliott, Reference Elliott1983). Inclined transpression was defined by Jones et al. (Reference Jones, Holdsworth, Clegg, McCaffrey and Tavarnelli2004) as isochronous contractional and dip-slip shearing that is a non-coaxial and non-plane strain deformation. An example of the classical crustal inclined transpression zone is the Zagros Thrust System, which involves ductile transpressional deformation (Mohajjel & Fergusson, Reference Mohajjel and Fergusson2000; Sarkarinejad, Reference Sarkarinejad2007; Sarkarinejad & Azizi, Reference Sarkarinejad and Azizi2008; Sarkarinejad, Faghih & Grasemann, Reference Sarkarinejad, Faghih and Grasemann2008; Sarkarinejad et al. Reference Sarkarinejad, Partabian, Faghih and Kusky2012; Sarkarinejad & Ghanbarian, Reference Sarkarinejad and Ghanbarian2014) resulting from relative motion between the Afro-Arabian continent and the Iranian microcontinent. Structural and kinematic analyses of the transpressional deformation indicate exhumation of the highly strained mylonitic shear zones associated with the nappes of the basement involved in the recently recognized hinterland fold-and-thrust belt of the Zagros orogen (Sarkarinejad & Alizadeh, Reference Sarkarinejad and Alizadeh2009; Sarkarinejad & Ghanbarian, Reference Sarkarinejad and Ghanbarian2014) and improve our understanding of strain partitioning within the still active zone of inclined transpression in the Zagros Mountains.
Analyses of lattice preferred orientation (LPO) patterns of quartz c-axes and of vorticity are important techniques for investigating the kinematics and geometry of flow in shear zones. The first vorticity analysis in deformed mylonites from the French Pyrenees (Passchier, Reference Passchier1987) marked important progress in developing methods for quantifying vorticity and has been applied since by many geologists (e.g. Passchier & Urai, Reference Passchier and Urai1988; Wallis, Reference Wallis1992; Simpson & De Paor, Reference Simpson and De Paor1993; Tikoff & Fossen, Reference Tikoff and Fossen1995; Grasemann, Fritz & Vannay, Reference Grasemann, Fritz and Vannay1999; Holcombe & Little, Reference Holcombe and Little2001; Gomez-Rivas et al. Reference Gomez-Rivas, Bonse, Griera, Carreras, Druguet and Evans2007; Jessup, Law & Frassi, Reference Jessup, Law and Frassi2007; Xypolias, Reference Xypolias2009). Since then the vorticity of deformed rocks has been analysed using various techniques (Xypolias & Doutsos, Reference Xypolias and Doutsos2000; Bailey & Eyster, Reference Bailey and Eyster2003; Law, Searle & Simpson, Reference Law, Searle, Simpson, Law, Searle and Godlin2004; Marques, Schmid & Andersen, Reference Marques, Schmid and Andersen2007; Sarkarinejad, Reference Sarkarinejad2007; Iacopini et al. Reference Iacopini, Carosi, Montomoli and Passchier2008; Sarkarinejad & Azizi, Reference Sarkarinejad and Azizi2008; Sullivan, Reference Sullivan2008; Frassi et al. Reference Frassi, Carosi, Montomoli and Law2009; Thigpen et al. Reference Thigpen, Law, Lloyd, Brown, Cook, Law, Butler, Holdsworth, Krabbendam and Strachan2010; Sarkarinejad & Ghanbarian, Reference Sarkarinejad and Ghanbarian2014).
Transpression can be divided into pure shear and simple shear dominated using the angle of convergence (Fossen & Tikoff, Reference Fossen and Tikoff1993). Kinematic partitioning of the pure shear and simple shear strain components in spatially separated domains is an important aspect of many transpressional systems (Fossen, Tikoff & Teyssier, Reference Fossen, Tikoff and Teyssier1994; Tikoff & Teyssier, Reference Tikoff and Teyssier1994; Jones & Tanner, Reference Jones and Tanner1995; Teyssier, Tikoff & Markley, Reference Teyssier, Tikoff and Markley1995). This paper describes well-exposed structural and microstructural fabrics, quartz c-axis LPOs, finite strain and kinematic vorticity analyses and deformation temperature obtained from the exhumed Zagros basement-involved mylonite nappes.
2. Geological and tectonic setting
The Zagros orogeny resulted from collision between the Afro-Arabian continent and the Iranian microcontinent in the Cretaceous (Alavi, Reference Alavi1994), and this belt is still an active convergent boundary (Allen, Jackson & Walker, Reference Allen, Jackson and Walker2004; Regard et al. Reference Regard, Bellier, Thomas, Abbassi, Mercier, Shabanian, Feghhi and Soleymani2004; Talebian & Jackson, Reference Talebian and Jackson2004; Tatar, Hatzfeld & Ghafory-Ashtiyani, Reference Tatar, Hatzfeld and Ghafory-Ashtiyani2004; Vernant et al. Reference Vernant, Nilforoushan, Haztfeld, Abassi, Vigny, Masson, Nankali, Martinod, Ashtiany, Bayer, Tavakoli and Chéry2004; Authemayou et al. Reference Authemayou, Bellier, Chardon, Malekzade and Abbassi2005) with a convergence rate of 22±2 mma−1 at N8°±5°E (Vernant et al. Reference Vernant, Nilforoushan, Haztfeld, Abassi, Vigny, Masson, Nankali, Martinod, Ashtiany, Bayer, Tavakoli and Chéry2004). The Zagros suture is the zone along which the Neo-Tethys closed by subduction of the oceanic crust beneath the Iranian microcontinent. This zone marks the boundary between the hinterland fold-and-thrust belt and the foreland fold-and-thrust belt, and is recognizable by the presence of the radiolarian oceanic sediments (Figs 3, 6a, further below), ophiolites and a contrast in P-wave velocities (Vergés et al. Reference Vergés, Saura, Casciello, Fernández, Villaseñor, Jiménez-Munt and García-Castellanos2011).
The Zagros orogenic belt can be divided into several structural domains from SW to NE. These include: Zagros foreland folded belt, Zagros foreland fold-and-thrust belt (Stöcklin, Reference Stöcklin1968; Berberian & King, Reference Berberian and King1981; Alavi, Reference Alavi1994), Zagros suture zone (Sarkarinejad, Reference Sarkarinejad2005), Zagros hinterland fold-and-thrust belt (Sarkarinejad & Ghanbarian, Reference Sarkarinejad and Ghanbarian2014), Sanandaj-Sirjan HP-LT/HT-LP paired metamorphic belts (Sarkarinejad, Reference Sarkarinejad1999) and the Urumieh–Dokhtar magmatic belt (Stöcklin, Reference Stöcklin1968). The study area is located in the basement-involved portion of the Zagros hinterland fold-and-thrust belt and is situated between Doroud and Azna cities NE of Lorestan province in western Iran (Fig. 1). Previous geological maps of the study area (Sahandi et al. Reference Sahandi, Radfar, Hoseinidoust, Mohajjel, Chaichi and Haddadan2006; Goodarzi, Reference Goodarzi2010) have been modified and a new geological map has been constructed (Fig. 2). The metamorphic rocks consist of quartzo-feldespathic mylonites, ultramylonites, amphibolitic mylonites, calc-schists, dolomarbles, schists, volcanic rocks, limestones and sandstones, a basal conglomerate and radiolarites. The structures are attributed to three phases of deformation.
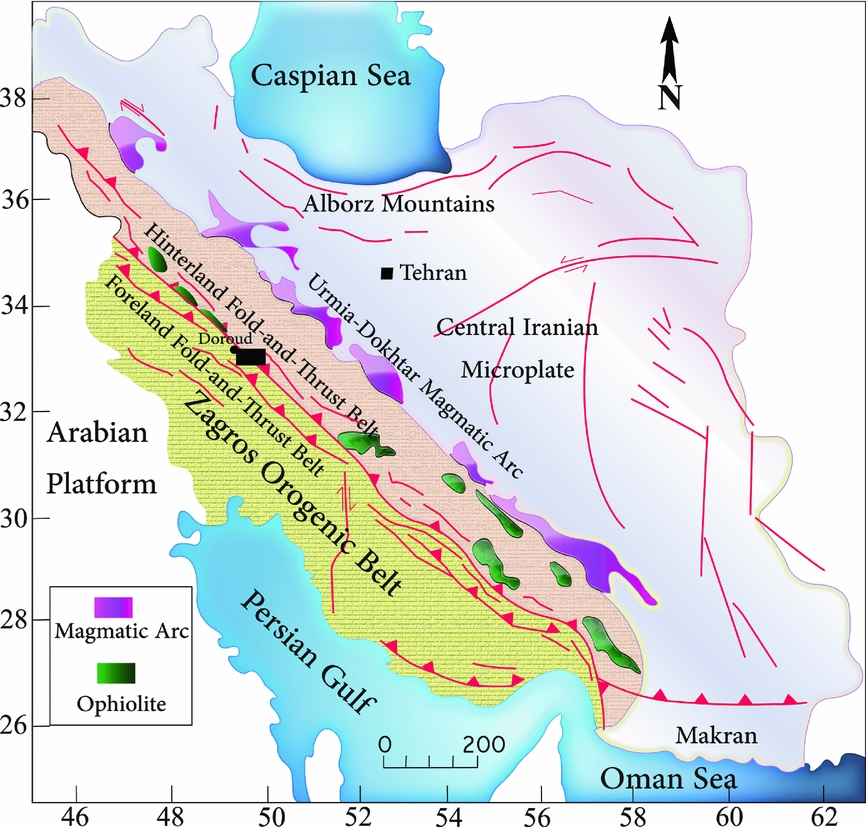
Figure 1. Structural domains of the Zagros orogenic belt in western Iran (Sarkarinejad & Ghanbarian, Reference Sarkarinejad and Ghanbarian2014). Black inset rectangle shows location of the Doroud–Azna region of the Zagros hinterland fold-and-thrust belt.

Figure 2. Detailed geological map of the Doroud–Azna area.
Several generations of structures were produced during three phases of deformation. Ptygmatic folds, boudinaged folds, folded boudins, parasitic folds, harmonic and disharmonic folds are common. Interference patterns of superposed folds are observed in the dolomarbles and calc-schists. The area is dominated by imbricate thrust systems and duplex structures which are developed together with fault-related folds (Fig. 6d, further below). Abundant small-scale and map-scale folds are asymmetric and related to thrust systems with a ramp–flat geometry. The main structures on the structural map (Fig. 3) strike mainly NW–SE.

Figure 3. Structural map of the Doroud–Azna area. The Zagros hinterland fold-and-thrust belt is shown in a cream colour, and the Zagros foreland fold-and-thrust belt in the SW corner is shown in green. With respect to the locality of the samples, stereographic projections of the quartz c-axis fabrics are shown on the map.
3. Deformation history
The hinterland of the Zagros orogenic belt has undergone three phases of deformation, defined as D1, D2 and D3 (Sarkarinejad & Azizi, Reference Sarkarinejad and Azizi2008). The 40Ar/39Ar step heating from the biotite grains of gneiss recorded plateau ages of 119.95±0.88 Ma and 112.58±0.66 Ma (Sarkarinejad, Godin & Faghih, Reference Sarkarinejad, Godin and Faghih2009) which occurred during collision between the Afro-Arabian and Iranian microcontinents during D1 deformation. These late Aptian ages are coincident with forming S1 foliations, L1 lineations and F1 folds at the peak of metamorphism.
40Ar/39Ar step heating of the hornblende of the amphibolites estimated ages of 89.09±1.34 Ma and 90.18±1.88 Ma, which indicate that S2 foliations, L2 stretching lineations and F2 folds formed during the Turonian–Cenomanian (Sarkarinejad, Godin & Faghih, Reference Sarkarinejad, Godin and Faghih2009). This phase (D2) of deformation is characterized by obduction of ophiolites over the toe wedge of the hinterland, exhumation of the high-pressure metamorphic rocks and inversion of the half-grabens formed in the mid-Permian–Triassic (Stampfli et al. Reference Stampfli, Mosar, Favre, Pillevuit and Vannay2001) to contractional regime along the Zagros accretionary prism.
Exhumation of mylonitic nappes by basement-involved shear zones, fault-related folds and formation of S/C shear band cleavages (Sarkarinejad, Reference Sarkarinejad2007; Sarkarinejad & Azizi, Reference Sarkarinejad and Azizi2008) by the latest phase (D3) of deformation.
4. Outcrop scale structures
4.a. Foliations
The metamorphic rocks of the area exhibit penetrative foliations S1 and S2. S1 foliations display a well-developed cleavage in muscovite schists. The S1 foliation mean orientation is N59°W, 37°NE (Fig. 4a). S1 foliations are overprinted by the second generation of foliations trending NW–SE that commonly lie at an angle of about 20° to S1 (Fig. 4b). S2 foliation formed in a lower-grade condition S1 forming the asymmetric crenulation cleavages and meso- and micro-folding (Fig. 8f, further below). Mean orientation of S2 is N40°W, 46°NE (Fig. 4b). S/C shear band cleavages were developed along the shear zones during a third phase of deformation (D3).

Figure 4. Lower-hemisphere, equal-area stereographic projections of poles to the foliations (S1 and S2) and lineations (L1 and L2) developed during D1 and D2 deformation events. They are contoured at 1%, 2%, 4%, 6% and 8% per 1% area. (a) Poles to S1 foliation and mean orientation plane. (b) Poles to S2 foliation and mean orientation plane. (c) L1 lineations, related to the D1 deformation event. (d) L2 lineations, related to the D2 deformation event.
4.b. Stretching lineation
L1 stretching lineation is well developed by the long axes of feldspar and amphibole minerals, thin quartz ribbons and mica fishes in schists. A second type of stretching lineation is defined by mesoscopic fold hinge lines. The mean plunge and trend of L1 is 41°, N38°E and the mean orientation of L2 is 48°, N45°E (Fig. 4c, d).
4.c. Superposed folds
Many mesoscopic superposed folds are well developed in dolomarble and calc-schist in the western part of the study area. Superposed folds form type-2 and type-3 (Fig. 7e, f, further below) interference patterns (Ramsay, Reference Ramsay1967). These interference patterns resulted from overprinting of F1 and F2 folds. Figure 7f (further below) illustrates a superposed fold with type-2 interference pattern that was produced when an F2 fold affected the axial surface of an F1 fold (Ramsay Reference Ramsay1962; Ramsay & Huber, Reference Ramsay and Huber1987, p. 492). Overprinting by D3 deformation on both previous deformations resulted in complex folding locally.
4.d. Boudins
Asymmetrical boudins and pinch-and-swell structures are abundant in the study area. There are boudins of quartz veins, chert bands and dolomitic layers enveloped by less competent layers of marble and muscovite schists. Some of the boudins are strongly sheared and imbricated to form piggyback structures (Fig. 7a, further below). F1 boudins in the cores of F2 folds documented polyphase of deformation (Fig. 7c, further below). The quartz and dolomitic layers commonly form domino, rotated shear band and drawn boudins (Goscombe, Passcier & Hand, Reference Goscombe, Passcier and Hand2004), within schist and phyllonitic fold limbs. Thin layers of quartz in the marble and dolomite are folded and boudinaged parallel to S2. Most of the asymmetrical boudins indicate a dextral sense of shear.
5. Thrust-and-fold structures
Thrust sheets, duplexes and imbricate thrust systems involving fault-bend folds are widespread in this area. Most of the map-scale hinterland dipping thrusts that crop out in the Doroud–Azna region are consistent with the NW-trending Zagros Thrust System. A cross-section of these thrusts is presented further below in Figure 12. Thrusting throughout the area has formed imbricated stacks that strike NW and dip NE with a mean orientation N38°W, 44°NE (Fig. 5). Younger layers in the hanging wall are juxtaposed against older layers in the footwall. Fault-bend folds develop by movement over thrust ramps (Suppe, Reference Suppe1983), and abundant mesoscopic fault-bend folds are observed in the metamorphic rocks that confirm the general kinematics of fault-related folds (e.g. Fig. 6b). Duplex structures in the Permian calc-schists locally overlap overturned folds to create antiformal stacks (Fig. 6e). Some NE-striking faults with a strike-slip component occur in the study area; these transfer faults have a mean orientation of N41°E, 67°NW (Fig. 5).
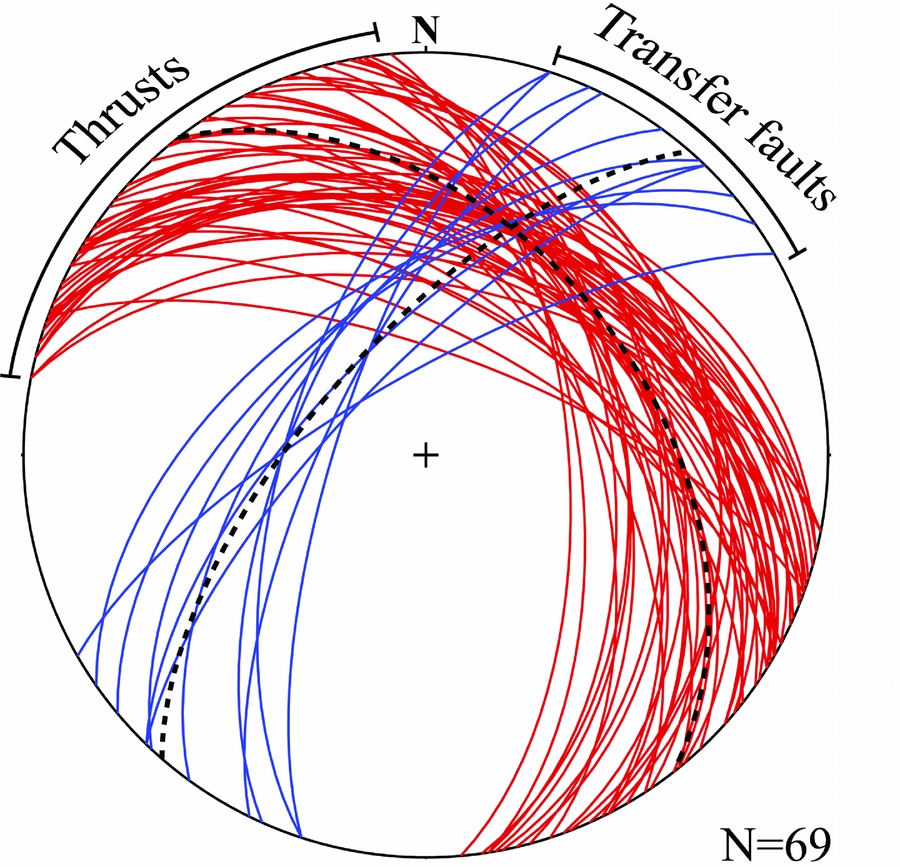
Figure 5. Lower-hemisphere, equal-area stereographic projection of the thrusts (red) and transfer faults (blue).

Figure 6. (a) Thrust boundary between hinterland fold-and-thrust belt and foreland fold-and-thrust belt. Basal conglomerate and radiolaritic ocean sediments are thrust over the limestone of the Asmari Formation. (b) Fault-bend folding in the marble layers illustrates the kinematic model of Narr & Suppe (Reference Narr and Suppe1994). (c) Folded and imbricated quartzo-feldspathic mylonite located in the NW of Azna. (d) Mesoscopic-scale imbricated wedges. (e) Fault-related folds formed by sequential imbrication in the antiformal stack structure in the Permian calc-schist.
6. Shear zone structures
Widespread shear zones are exposed along the flexural-slip duplexes and imbricate stacks in the hinterland of the Zagros Thrust System. Two shear zones within the basement are recognized in the Doroud–Azna region. These shear zones are named M1 and M2 (Fig. 12, further below) and formed in the D3 deformation phase. They are recognized by the juxtaposition of basement inliers. The M1-shear zone exposes amphibolitic mylonite, and the M2-shear zone exposes quartzo-feldspathic mylonite. These mylonites are overlain by volcanic rocks, limestone, sandstone, muscovite schist, calc-schist and dolomarble with ages from Middle Triassic to Middle Cretaceous that folded by fault-bend folding. In some areas mylonites are folded and overridden by thrusts (Fig. 6c). NE-dipping shear zones are c. 17 km long and 1 km wide. Asymmetrical σ-type and δ-type porphyroclast systems with lengths up to 1 cm within the shear zones indicate top-to-the-SE sense of shear. The recrystallized quartz in quartzo-feldspathic mylonites displays a well-developed c-axis LPO. Cross-sections, temperature and pressure conditions of the formation of mylonites, overall deformation style and high-strain structures all indicate that the shear zones are deeply rooted. Indeed, M1 and M2 shear zones are exhumed slices of the basement in the study area. Figure 7d shows a polished slab of the quartzo-feldspathic mylonite in the XZ-plane (parallel to the stretching lineation and perpendicular to foliation) as situated in the M2 shear zone. Asymmetrical porphyroclasts of feldspar are surrounded by dynamically recrystallized quartz and fine-grained muscovite. Porphyroclasts commonly have an internal monoclinic shape (Passchier & Simpson, Reference Passchier and Simpson1986). Mesoscopic S/C shear band cleavages in the XZ-plane are related to the third phase of deformation (D3). The S/C shear band cleavages indicate a dextral sense of shear, consistent with the complete Zagros Thrust System.

Figure 7. Mesoscopic-scale kinematic indicators of the hinterland fold-and-thrust belt. (a) Sheared boudins, showing piggyback structure. (b) Sigmoidal lenses with monoclinic symmetry which show top-to-the-SE sense of shear. C/S planes are shown. (c) Boudined folded boudins indicate high strain affected by thrusting. (d) Photograph of a polished quartzo-feldspathic mylonite (XZ-plane). (e) Example of type-3 superposed fold pattern. F1 recumbent fold superposed by F2 fold. (f) Type-2 superposed fold pattern seen on vertical face (As-F shows the trace of axial surface).
7. Shear sense indicators
The sense of shear in deformed rocks can be deduced by mesoscopic and microscopic structures (Simpson & Schmid, Reference Simpson and Schimid1983; Law, Reference Law, Knipe and Potter1990; Passchier & Trouw, Reference Passchier and Trouw2005). These structures are studied in planes parallel to the stretching lineation and perpendicular to the foliation. All of the investigated shear sense indicators, including sheared boudins (Fig. 7a), S/C fabrics (Figs 7b, 8a), porphyroclasts (Fig. 8c, d), mica fishes, shear bands (Fig. 8e), bookshelf structures (Fig. 8b) and asymmetrical folds, show a top-to-the-SE sense of shear in this area.

Figure 8. Photo-micrographs showing asymmetrical microstructures. All sections cut perpendicular to the foliation and parallel to the stretching lineation. (a) S/C shear band in mylonitic marble. The movement along the shear band is synthetic with the sense of shear in the surrounding mylonite. (b) Bookshelf structure in mylonitic marble, showing domino-type fragments that consist of synthetic and antithetic micro-faulting. (c) High-grade mylonite derived from quartzo-feldspathic mylonite. K-feldspar porphyroclast is surrounded by fine-grained recrystallized K-feldspar and quartz. (d) High-grade mylonite derived from amphibolite. Hornblende porphyroclast surrounded by a matrix of fine-grained feldspar and quartz. (e) High-grade quartzo-feldspathic mylonite showing C-plane shear band cleavage. (f) Crenulation cleavage, developing along schist with asymmetric micro-folds. S2 is sub-horizontal and overprints S1.
7.a. σ-, δ-type porphyroclasts
Rotated porphyroclasts wrapped by a fine-grained recrystallized matrix are produced predominantly during high-grade ductile deformation with monoclinic symmetry (Passchier & Trouw, Reference Passchier and Trouw2005). Porphyroclasts of K-feldspar and hornblende are observed in the quartzo-feldspathic mylonite and amphibolitic mylonite, respectively. K-feldspar porphyroclasts are embedded in a recrystallized fine-grained K-feldspar and quartz (Fig. 8c), and occasionally the K-feldspar porphyroclasts are mantled by recrystallized fine-grained K-feldspar, quartz and biotite. Fine recrystallized K-feldspar and quartz grains indicate medium to high-grade deformation conditions. The samples of amphibolitic mylonite with asymmetric hornblende grains show that hornblende was stable during deformation (Fig. 8d).
7.b. S/C shear bands
Shear band cleavages in mylonite and schist are characterized by C- and S-planes. The C-plane is parallel to the shear zone boundaries and is transected by the S-plane (Berthe, Choukroune & Gapais, Reference Berthe, Choukroune and Gapais1979; Berthe, Choukroune & Jegouzo, Reference Berthe, Choukroune and Jegouzo1979; Lister & Snoke, Reference Lister and Snoke1984). With respect to the internal and external asymmetry axes, the shear band cleavages indicate a dextral sense of shear (Fig. 8e).
7.c. Bookshelf structures
Bookshelf structures show two sets of micro-faults. Synthetic slip is consistent with regional dextral sense of shear, and antithetic micro-faults are opposite to the main sense of movement (Fig. 8b). The angle between the micro-faults and the mylonitic foliation is smaller than 45°. Bookshelf sliding is frequently observed between rotated porphyroclasts and can be used as a shear sense indicator.
8. Quartz c-axis fabrics
An important effect of intracrystalline deformation of quartz is the formation of c-axis LPOs that are related to deformation conditions and geometry (Passchier & Trouw, Reference Passchier and Trouw2005). Quartz c-axes were measured in ten oriented samples of quartzo-feldspathic mylonites from different structural positions along a NE–SW transverse line across the Zagros Thrust System (Fig. 9). The location of the samples is given in Figures 2 and 3. In each sample, c-axis measurements of 400–500 recrystallized grains were made on thin sections perpendicular to foliation and parallel to the stretching lineation, using an optical microscope equipped with a five-axis universal stage. The foliation plane is assumed to be the XY-plane of the finite strain ellipsoid, and the stretching lineation is the x-axis. Fabric skeletons (Fig. 9) show external and internal asymmetries (Law, Reference Law, Knipe and Potter1990), indicating a non-coaxial top-to-the-SE sense of shear. They display an obliquity of the central girdle segment with respect to the reference frame (ψ), with values of 60–70°. Also, the fabric asymmetry is determined by the relative magnitudes of angles C1 and C2 (external asymmetry) and ω1 and ω2 (internal asymmetry) (Law, Knipe & Dayan, Reference Law, Knipe and Dayan1984; Platt & Behrmann, Reference Platt and Behrmann1986; Law, Reference Law1987, Reference Law, Knipe and Potter1990). C-axis fabric skeletons show both external and internal fabric asymmetry (ψ = 81°, ω 1 = 75° and ω 2 = 25° for FM-1 sample) (Fig. 9; Table 1). The asymmetry of quartz c-axis fabrics relative to the foliation plane indicates non-coaxial progressive deformation. The density distributions of quartz c-axis fabric diagrams obtained from the Doroud–Azna area reveal a pattern of asymmetrical type-1 crossed girdle that shows non-coaxial and plane strain deformation (Etchecopar, Reference Etchecopar1977; Lister, Reference Lister1977; Lister, Paterson & Hobbs, Reference Lister, Paterson and Hobbs1978; Lister & Paterson, Reference Lister and Paterson1979; Etchecopar & Vasseur, Reference Etchecopar and Vasseur1987; Jessel & Lister, Reference Jessel, Lister, Knipe and Potter1990; Law, Reference Law, Knipe and Potter1990).

Figure 9. Equal-area, lower-hemisphere stereographic projections of the quartz c-axis fabrics (samples FM-1 to FM-10). The location of the samples is shown in Figures 2 and 3. Fabric skeletons for individual samples from the study area are illustrated (black inset). In all these projections, the foliation (S) is vertical, and stretching lineation (L) within the foliation is horizontal. N = number of grains measured in each sample. C1 and C2 show external fabric asymmetry and ω 1 and ω 2 show internal fabric asymmetry (Law, Reference Law, Knipe and Potter1990).
Table 1. Details of quartz c-axis fabrics, strain and kinematic vorticity number measurements for samples from the study area.

9. Finite strain analysis using R f/φ method
The R f/φ method is a powerful graphical analysis technique for calculating the finite strain of deformed elliptical fabrics (Ramsay, Reference Ramsay1967; Dunnet, Reference Dunnet1969). This method utilizes the mathematical relationship between the sectional orientations and ellipticity of deformed elliptical and spherical objects to calculate the two-dimensional magnitude and orientation of finite strain (Ramsay, Reference Ramsay1967; Dunnet, Reference Dunnet1969; Ramsay & Huber, Reference Ramsay and Huber1983, p. 67; Lisle, Reference Lisle1985). The R f/φ method has been widely used for regional strain analysis. Measurements of aspects ratio (R f) major and minor axes of ellipsoids were plotted versus the angle φ between major axes and the trace of the foliation in oriented thin sections of feldspar porphyroclasts.
The abundance of deformed feldspar porphyroclasts in mylonite within the quartzo-feldspathic mylonite provided us with a means of estimating the finite strain, using the methods described by Lisle (Reference Lisle1985). Feldspar, to which this method is commonly applied, tends to have clasts with a preferred orientation, which will influence their shape in the deformed state and create a challenge in strain analyses. We assume that at the scale of analysis, clasts act as deformed homogeneous objects and passive ellipsoids. Also we assume there was no interaction between clasts during deformation and the rock did not contain a pre-existing fabric. At least 80 feldspar grains were measured on every polished hand specimen surface (XZ-plane). Two-dimensional R f/φ finite strain data from all the locations have been derived from three-dimensional strain analysis to determine the shape of strain ellipsoids and finite strain analyze. In this method, the finite strains were estimated for ten samples FM-1 to FM-10. The location and R s value of each sample are shown in Figures 2, 10 and Table.

Figure 10. R f/φ finite strain analyses of feldspar porphyroclasts showing Ri and Rs onion curves for XZ-plane cut perpendicular to the foliation plane.
10. Finite strain analysis using enhanced normalized Fry method
Quantifying finite strain resulted in calculated fabric ellipsoids from both the R f/φ and enhanced normalized Fry methods. The enhanced normalized Fry method (Erslev & Ge, Reference Erslev and Ge1990) is a graphical technique for determining two-dimensional geological strain by measuring centre-to-centre distance of objects using a certain cut-off radius to remove particles beyond a defined distance from the void centre. The enhanced normalized Fry method was applied to three samples in order to compare the results with those obtained by the R f/φ method. In the enhanced normalized Fry analysis, centre-to-centre measurements are used and the central points of more than 150 feldspar grains per section were used to estimate finite strain. Two-dimensional strain measurements were made on XZ (parallel to stretching lineation and perpendicular to foliation). The finite strain values from the enhanced normalized Fry method for the XZ-plane of samples FM-2, FM-3 and FM-4 are R s = 2.6, 2.58 and 2.87, respectively, confirming the analyses of the R f/φ method (Fig. 11).

Figure 11. XZ-plane of the finite strain using the enhanced normalized Fry method. The finite strain ellipses show elliptical rims surrounding central vacancies, yielding a high-resolution ellipse, which commonly results from uniform and homogeneous deformation. (a) Sample FM-2, Rs = 2.6, (b) sample FM-3, Rs = 2.58 and (c) sample FM-4, Rs = 2.87.
11. Calculating the kinematic vorticity number
The kinematic vorticity number (Wk ) is a dimensionless number representing the relative rates of internal rotation and stretching at a point in space and a moment in time (Fossen, Reference Fossen2010, p. 438). Wk has a value that depends on the relative amount of pure shear (Wk = 0) versus simple shear (Wk = 1); intermediate types are referred to as general shear (Passchier & Trouw, Reference Passchier and Trouw2005). With respect to the theoretical relationship between vorticity, the orientation of lines with zero instantaneous rotation (the flow apophyses) and instantaneous stretching axes (ISA) (Passchier & Urai, Reference Passchier and Urai1988), Wallis (Reference Wallis1995) proposed that Wk can be estimated if the strain ratio in the XZ-plane of the finite strain (R XZ) and the angle (β) between the foliation and the orthogonal to the c-axis fabric skeleton (Lister & Williams, Reference Lister and Williams1979) are known. The kinematic vorticity number using the R XZ/β method is sensitive to small changes in the estimated angle β (Grasemann, Fritz & Vannay, Reference Grasemann, Fritz and Vannay1999; Bailey et al. 2004; Law, Searle & Simpson, Reference Law, Searle, Simpson, Law, Searle and Godlin2004), and the method becomes unreliable in high-strain zones with R XZ > 10–15 and β < 5 (Grasemann, Fritz & Vannay, Reference Grasemann, Fritz and Vannay1999). The vorticity analysis assumes that the vorticity vector is perpendicular to the maximum and minimum principal finite strain axes (Law, Reference Law, Law, Butler, Holdsworth, Krabbendam and Strachan2010). Also, flow assumes homogeneous, monoclinic and steady state. However, in a natural system the vorticity of flow may be integrated over space and time (Wk ). In the steady-state flow, instantaneous strain (Fossen & Tikoff, 1998; Jiang & Williams, 1998) is considered equal to finite strain (Wm ) (Law, Searle & Simpson, Reference Law, Searle, Simpson, Law, Searle and Godlin2004). The approximately plane strain suggested by the cross-girdle pattern of the quartz c-axes (Law, Reference Law, Knipe and Potter1990) can be satisfied using two-dimensional vorticity analysis (Tikoff & Fossen, Reference Tikoff and Fossen1995).
Wk was calculated using the Wallis (Reference Wallis1992, Reference Wallis1995) method in the following formula:
 $$\begin{eqnarray*}
W_k={\rm{sin}}\left\{{\rm{tan^1}}\left[\frac{{\rm sin}(2\it\beta)}{\begin{array}{l}[(R_{xz}+1)/(R_{xz}-1)\\\qquad\qquad-{\rm cos(2\beta)}]-{\rm{cos(2\beta)}}\end{array}}\right]\right\}\\ \nonumber
&&\times\frac{(R_{xz}+1)}{(R_{xz}-1)}
\end{eqnarray*}$$
$$\begin{eqnarray*}
W_k={\rm{sin}}\left\{{\rm{tan^1}}\left[\frac{{\rm sin}(2\it\beta)}{\begin{array}{l}[(R_{xz}+1)/(R_{xz}-1)\\\qquad\qquad-{\rm cos(2\beta)}]-{\rm{cos(2\beta)}}\end{array}}\right]\right\}\\ \nonumber
&&\times\frac{(R_{xz}+1)}{(R_{xz}-1)}
\end{eqnarray*}$$
Based on our data from ten samples (FM-1 to FM-10; Table 1), application of this method revealed that Wk ranges between 0.46 and 0.67 (Table 1) and the estimated kinematic vorticity number mean is 0.55±0.06.
12. Structural cross-sections
Numerous cross-sections across the Zagros orogenic belt have been published by various workers (e.g. Stöcklin, Reference Stöcklin1968; Alavi, Reference Alavi1994, Reference Alavi2007; Mohajjel et al. 2000; Blanc, Allen & Inger, 2003; McQuarrie, Reference McQuarrie2004; Sherkati & Letouzey, Reference Sherkati and Letouzey2004; Molinaro et al. Reference Molinaro, Letuemy, Guezou, Frizon De Lamotte and Eshraghi2005; Agard et al. Reference Agard, Omrani, Jolivet and Mouthereau2005, Reference Agard, Monie, Gerber, Omrani, Molinaro, Meyer, Labrousse, Vrielynck, Jolivet and Yamato2006, Reference Agard, Omrani, Jolivet, Whitechurch, Vrielynck, Spakman, Monie, Meyer and Wortel2011; Sarkarinejad & Azizi, Reference Sarkarinejad and Azizi2008; Sarkarinejad & Ghanbarian, Reference Sarkarinejad and Ghanbarian2014). However, these works do not present any detailed structural cross-sections in the hinterland in western Iran. In this research, AAʹ, BBʹ and CCʹ cross-sections across the study area have been constructed in order to understand the subsurface structural styles along traverses perpendicular to fold axes and major thrusts (Fig. 2). The cross-sections are constrained according to detailed field observations and high-resolution remote sensing data with modern orthorectification methods.
Constructed cross-sections from SW to NE include two parts of the Zagros orogenic belt: (1) Whole sequences of the Cambrian to Pliocene sedimentary rocks (McQuarrie, Reference McQuarrie2004) of the foreland fold-and-thrust belt folded on the Hormoz salt detachment surface. Seismic studies confirm the presence of the inverted half-grabens in the upper crust of the foreland basement (Sepehr & Cosgrove, Reference Sepehr and Cosgrove2004). (2) The hinterland fold-and-thrust belt is dominated by in-sequence thrusting, duplex structures and exhumation of the quartzo-feldspathic and amphibolitic mylonite nappes (M1 and M2 shear zones). Thrusts are related to folds (Suppe, Reference Suppe1983) which were constructed using the kink method (Faill, Reference Faill1969, Reference Faill1973). Several map-scale fault-bend folds crop out in the study area and are shown in the cross-sections (Fig. 12). Imbricate stacks are created fault-bend folding with NW-striking and NE-dipping.
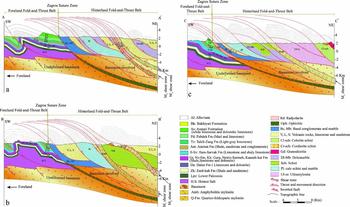
Figure 12. Generalized structural cross-sections across the study area, showing large-scale imbricated thrusts, basement-involved mylonite nappes and Palaeozoic and Mesozoic sedimentary cover sequences. Black lines across the geological map (Fig. 2) show the position of the AA', BB' and CC' cross-sections. The strike of cross-sections is NE–SW. (a), (b) and (c) present AA', BB' and CC' cross-sections, respectively.
The suture zone is considered as the boundary between foreland and hinterland fold-and-thrust Belts which are recognized by outcrops of ophiolites and radiolarian cherts in this zone. Ophiolites are not exposed in this part of the Zagros suture zone. As mentioned before, ophiolites are slices of Neo-Tethyan oceanic crust that obducted during the Turonian–Cenomanian within the Zagros accretionary prism (Sarkarinejad, Godin & Faghih, Reference Sarkarinejad, Godin and Faghih2009).
13. Discussion
The Zagros orogenic belt resulted from the NE subduction of Neo-Tethys oceanic crust below the Iranian microcontinent and subsequent convergence of the Arabian and Eurasian plates from the late Cretaceous to the Present (Stöcklin, Reference Stöcklin1968; Ricou, Reference Ricou1971; Takin, Reference Takin1972; Dewey et al. Reference Dewey, Pitman, Ryan and Bonnin1973; Berberian & King, Reference Berberian and King1981; Koop & Stoneley, Reference Koop and Stoneley1982; Alavi, Reference Alavi1994; Blanc, Allen & Inger, 2003; McClay et al. Reference McClay, Whitehouse, Dooley and Richards2004; McQuarrie, Reference McQuarrie2004; Sarkarinejad & Azizi, Reference Sarkarinejad and Azizi2008).
The Zagros Thrust System is an array of oblique-slip thrust sheets, shear zones, imbricate fans and duplex structures with involved components of both dip-slip and strike-slip that are related to each other geometrically, kinematically and mechanically and are associated with the Zagros dextral inclined transpression zone. This thrust system developed at the boundaries of the dextral inclined transpression zone (Sarkarinejad & Azizi, Reference Sarkarinejad and Azizi2008). Exhumation of the mylonites and ductile materials is bounded to these boundaries. Mylonitic nappes have been exhumed along the Zagros hinterland basement-involved located in the Zagros Thrust System, corroborating thick-skinned tectonics. The Tutak gneiss dome exposes a basement window exhumed in the hinterland of the Zagros orogenic belt (Sarkarinejad & Alizadeh, Reference Sarkarinejad and Alizadeh2009). The hinterland fold-and-thrust belt developed in the internal portion of the orogenic belt, and thrusting involved deeper crustal rocks and basement (Vaníček & Vaníček, 2008, p. 195).
Several kinematic models have been developed to explain diverse fault-related fold mechanisms in orogens. These include a detachment fold created by layers riding parallel to a thrust and without upward propagation of the thrust. In fault propagation folds, the fold forms beyond the tip of a blind thrust where propagation along the detachment surface has ceased but displacement on the thrust continues. Fault-bend folds are developed by movements over thrust ramps (Suppe, Reference Suppe1983) and show top-to-the-foreland motion. The interpreted structures in the study area shown in the three cross-sections (Fig. 12) reflect a combination of field data and kink-band fault-bend fold models of Suppe (Reference Suppe1983), map-scale oblique-slip thrusts, duplex structures and basement-involved mylonite nappes. Ongoing shortening causes older thrusts to override younger ones, producing imbricate thrust systems and antiformal stacks
In thick-skinned tectonics, thrust wedges and steep faults penetrate the basement, giving rise to basement blocks bounded by faults, with subsequent uplift and partial exhumation of basement rocks at the crustal scale (Escher & Beaumont, Reference Escher and Beaumont1997; Poblet & Lisle, Reference Poblet, Lisle, Poblet and Lisle2011).
Highly strained ductile rocks in natural shear zones can be exhumed from deep crustal levels during transpressional deformation (Sanderson & Marchini, Reference Sanderson and Marchini1984; Jones et al. Reference Jones, Holdsworth, Clegg, McCaffrey and Tavarnelli2004). Most orogenic belts have non-planar zone boundaries and wedge-shaped overall geometries (Jones et al. Reference Jones, Holdsworth, Clegg, McCaffrey and Tavarnelli2004). Inclined convergence and shortening were accommodated by imbricate thrust systems and duplex structures generated in the fold-and-thrust belts along the foreland and hinterland of the Zagros orogenic belt. Transpression was heterogeneously distributed within the shear zone system.
Basement-involved mylonitic nappes are exposed along flexural-slip imbricate thrust stacks and are enucleated within the basement by M1 and M2 shear zones (Fig. 12). Exhumed quartzo-feldspathic and amphibolitic mylonites indicate medium to high-grade metamorphic conditions of deformation. Fault-bend folds and M1 and M2 shear zones are formed by ongoing dextral inclined transpressional regime during D3 deformation.
Kinematic vorticity analysis demonstrates that regional ductile deformation involved general shearing with a combination of simple and pure shear (Fig. 13b). Given the assumptions involved in the method used, the mean kinematic vorticity (Wm ) calculated from ten specimens indicates a pure shear component of 62% and a simple shear component of 38% for the Zagros mylonites (Fig. 13a) that are close to the basal thrust of the hinterland fold-and-thrust belt. Based on this ratio, the estimated θ angle between the maximum instantaneous strain axis (ISA1) and the transpressional zone boundary is 17°. The angle of flow apophyses (α) indicates a convergence angle between the Iranian and Afro-Arabian plates of 57° along the exhumation of M2 mylonitic nappe.
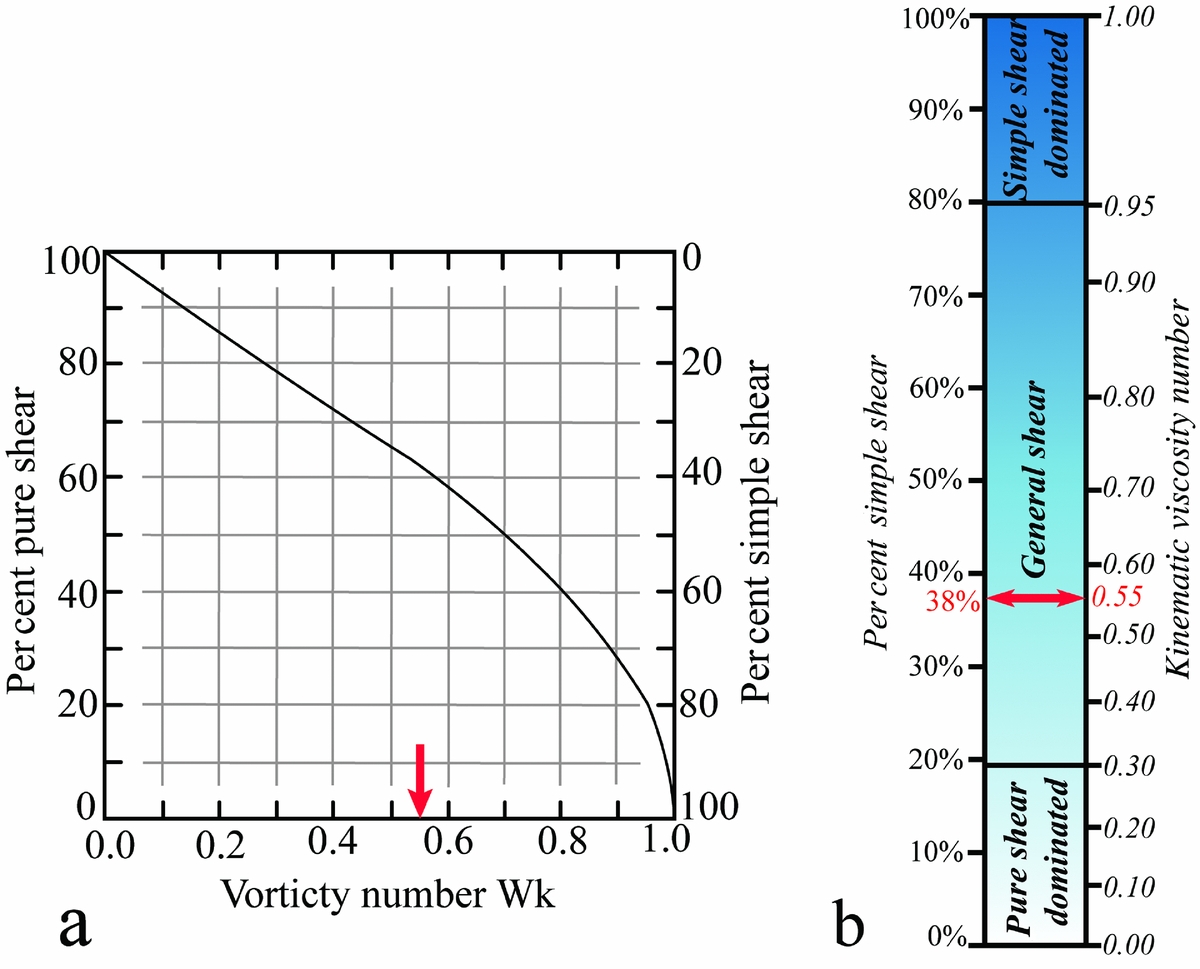
Figure 13. (a) Relation between kinematic vorticity number (Wk ) and components of pure and simple shear for instantaneous two-dimensional flow (modified after Law, Searle & Simpson, Reference Law, Searle, Simpson, Law, Searle and Godlin2004). The mean estimated Wk = 0.55 (arrow) for mylonite samples indicates 62% pure shear and 38% simple shear components. (b) Relation between the Wk value and per cent simple shear (modified after Forte & Bailey, Reference Forte and Bailey2007).
During plastic deformation and dynamic recrystallization, the opening angle of quartz c-axis girdles relates directly to the temperature of deformation (Tullis, Christie & Griggs, Reference Tullis, Christie and Griggs1973; Lister & Hobbs, Reference Lister and Hobbs1980; Lister & Dornsiepen, Reference Lister and Dornsiepen1982). The geothermometer (Kruhl, Reference Kruhl1996) modified by Law, Searle & Simpson (Reference Law, Searle, Simpson, Law, Searle and Godlin2004) and Morgan & Law (Reference Morgan and Law2004), implies that these rocks deformed at temperatures ranging between 425±50°C and 540±50°C. Quartz grains are generally recrystallized and form elongate polycrystalline ribbons. Quartzo-feldspathic mylonites show a strong foliation and lineation defined by the alignments of mica. Monoclinic cross-girdle quartz c-axis fabrics and the orthogonal relationship between fabric skeleton and foliation (ten samples in Fig. 9) are consistent with approximately plane strain conditions (Frassi et al. Reference Frassi, Carosi, Montomoli and Law2009).
14. Conclusions
The purpose of this research is to investigate collisional and convergent processes in a transpressional setting that resulted from oblique convergence between the Iranian microcontinent and the Afro-Arabian plates after the intervening portion of Neo-Tethys closed. Strain partitioning across the mylonitic nappes involved simultaneous dip-slip and strike-slip displacements in the ductile thrust system that developed during inclined dextral transpression.
Three phases of deformation formed the various structures. Quartz c-axis fabrics show asymmetrical type-1 cross girdles, indicating non-coaxial plane strain deformation. The mean value of the kinematic vorticity (Wm ) was 0.55±0.06, indicating a general shear deformation with 62% pure and 38% simple shear components in the Doroud–Azna area. Mesoscopic and microscopic shear sense indicators confirm dextral transpression (top-to-the-SE). The angle between the maximum horizontal instantaneous strain axis and the plate boundary (α = 57°) shows that the plate convergence causing the Zagros Thrust System was oblique. Based on opening angles of quartz girdles, deformation temperatures varied from 425±50°C to 540±50°C, which indicates amphibolite facies conditions. All of the structural evidence indicates that the hinterland fold-and-thrust belt of the Zagros orogen was characterized by thick-skinned deformation; basement was strongly involved and exhumed as mylonite nappes.
Acknowledgements
The authors wish to thank Professor C. J. Talbot and Dr David Iacopini for constructive reviews and valuable editorial comments. We also thank Professor Mark B. Allen, Editor-in-Chief of the Geological Magazine, for accepting the manuscript, and Professor Jan Tullis who critically reviewed and improved the manuscript. This research was supported by a Shiraz University Research Council (SURC) grant which is gratefully acknowledged.


