


INTRODUCTION
Programmed cell death (PCD) is a well-regulated cellular process that has been extensively characterized in multicellular organisms. This process has also been observed in an increasing number of unicellular eukaryotes including the Trypanosomatids, Dictyostelium, Plasmodium, T. vaginalis, E. histolytica and Blastocystis (Chose et al. Reference Chose, Sarde, Gerbod, Viscogliosi and Roseto2003; Bruchhaus et al. Reference Bruchhaus, Roeder, Rennenberg and Heussler2007; Tan and Nasirudeen, Reference Tan and Nasirudeen2005).
PCD can be initiated by various factors both external and internal and these are coordinated by a complex network of regulators and effectors. The various triggers are factors like cellular stress, serum or growth factor deprivation, chemotherapeutic agents, receptor ligand binding, de-regulation of cell division and development or differentiation (Debrabant et al. 2002). The most common types of PCD known are apoptosis and autophagy. Apoptosis (type I PCD) involves an orchestrated cascade of biochemical events leading to characteristic changes in cell morphology which includes proteolytic cleavage by caspases, cell shrinkage, DNA inter-nucleosomal fragmentation, phosphatidylserine exposure, blebbing of the plasma membrane, formation of apoptotic bodies and loss of mitochondrial membrane potential with cytochrome c release to the cytosol (Menna-Burreto et al. Reference Menna-Barreto, Goncalves, Costa, Silva, Pinto, Oliveira and de Castro2009). These changes finally lead to cell death. Apoptosis has been divided into 2 forms – caspase-dependent and caspase-independent pathway. The caspase-independent pathway involves the induction of mitochondrial membrane permeabilization (MMP) and the release of apoptosis-inducing factor (AIF), which is controlled by the Bcl-2 family of proteins. In the caspase-dependent pathway, after MMP induction, cytochrome c redistributes from mitochondria to cytosol to activate caspase-9, in collaboration with ATP and the cytosolic factor Apaf-1 (Lorenzo and Susin, Reference Lorenzo and Susin2004).
Autophagy (type II PCD) involves the autophagosomal – lysosomal system. Autophagosomes are double-membrane vesicles which are responsible for the engulfment of cytoplasmic constituents, during turnover of organelles. After autophagosome – lysosome fusion, an autophagolysosome is formed in which cellular residues are digested. Autophagy is crucial to maintain the metabolic balance and the recycling of cellular structures during cell growth and development. The de-regulation of such a balance can initiate cell death as a result of prolonged starvation or oxidative stress. In this it has been suggested that limited self-digestion of cell materials, including organelles, can help individual cells provide energy to facilitate survival for up to several days. However, if conditions do not improve, self-digestion continues and eventually results in autophagic cell death (Bruchhaus et al. Reference Bruchhaus, Roeder, Rennenberg and Heussler2007). Clearly these processes differ from that of necrosis which is typically associated with extreme cell injury causing dramatic alterations in mitochondrial function, cytoplasmic vacuolization and, ultimately, the breakdown of the plasma membrane. The recycling process of dead cells in necrosis by comparison is slow and less regulated, due to the absence of specific cell signals, leading to an important inflammatory response (Menna-Burreto et al. Reference Menna-Barreto, Goncalves, Costa, Silva, Pinto, Oliveira and de Castro2009).
With the increasing evidence of PCD in single-celled organisms including bacteria (Koonin and Aravind, Reference Koonin and Aravind2002) it is important to understand how this/these processes evolved with respect to the pathways and also the rational for such systems in unicellular organisms. Although there are a significant number of publications in this area on organisms such as Dictyostelium, Trypanosoma, Leishmania and Plasmodium, our understanding of the pathways involved in many organisms is variable. Giardia is a micro-aerophilic parasite of humans and animals that lacks mitochondria but contains mitosomes (thought to be relic mitochondria). This organism is a eukaryote and possesses many typical characteristics such as a distinct nucleus and nuclear membrane, cytoskeleton, and endomembrane system; however, other aspects of the cell such as SSU rRNA and some key metabolic enzymes are prokaryotic-like (Svard et al. Reference Svard, Hagblom and Palm2003). Although controversial, the majority of workers think of Giardia as a eukaryote that has diverged at or just after mitochondrial acquisition and this has made Giardia an important organism for research into the understanding of evolution in eukaryotic cells (Thompson, Reference Thompson2004).
In this study we have observed 2 forms of PCD that are demonstrably different. Through standard cell biological methods and analysis of the Giardia genome we support the presence of a caspase-independent apoptotic-like PCD mechanism in this organism that may be a progenitor of the classical pathway – a ‘pre-apoptosis’.
MATERIALS AND METHODS
In this study Giardia duodenalis isolates JKH-1 and MR4 were used. JKH-1 is a G. duodenalis isolate which has a reduced sensitivity to metronidazole and this isolate belongs to assemblage B (obtained from a duodenal aspirate from a USA patient with recurrent giardiasis, axenized in the laboratory of Dr T. Paget, University of Hull, 1998). MR4 is a G. duodenalis isolated from muskrat and belongs to assemblage A (obtained from the laboratory of Professor E. Jarroll, Northeastern University, Boston, USA).
Culture of Giardia
Giardia trophozoites were cultured axenically at 37 °C in TYI-S-33 medium supplemented with bile (1 g/ l) and 10% (v/v) fetal calf serum and a pH of 6·8–7·2. The medium was sterilized by filtration (0·22 μm filter, Sartorius) prior to use and stored at 4 °C. Cultures were inoculated in 11·5 ml vol. flat-sided culture tubes (Nunc). Trophozoites were transferred every 48 h into fresh growth medium when cells became confluent. Adherent trophozoites were removed from the tubes by chilling and 1 ml of the chilled trophozoites was transferred into 10·5 ml of fresh medium. For experimental purposes, the chilled trophozoites were first centrifuged (1200 g for 10 min) then washed with phosphate-buffered saline (PBS), centrifuged (1200 g for 10 min) and finally counted in a haemocytometer (Improved Neubauer).
Induction of PCD
PCD was induced using hydrogen peroxide, metronidazole and starvation. Confluent Giardia cultures were harvested by chilling at 4°C for 1 h. Adherent cells were then removed by shaking and the cells were centrifuged at 1200 g for 10 min. The pelleted cells were washed twice with PBS. For each assay point 1×10⁶ cells were used. For induction, fresh stock solutions were prepared – hydrogen peroxide (1 mM and 100 mM); metronidazole (1 mg/ml). Analysis was performed by flow cytometry. For induction of PCD via starvation, Giardia cells were grown up to 60% confluency in TYI-S-33 medium after which the medium was removed, together with the non-adherent cells, and replaced with PBS and incubated at 37°C for 12 h or 16 h before harvesting for analysis.
Annexin-binding assay
Giardia cells were induced for PCD as outlined above and after incubation the cells were washed twice by centrifugation (300 g for 5 min) with cold PBS. After the second wash the pellet was re-suspended in 0·5 ml of cold 1X binding buffer to which 1·25 μl of Annexin V-FITC (Invitrogen, UK) was added. This was incubated for 15 min in the dark and the cells were washed again by centrifugation. The pellet was finally re-suspended in 0·5 ml of cold 1X binding buffer containing propidium iodide (PI) (1 mg/ml). The samples were placed on ice and away from light and finally analysed by flow cytometry (Beckman Coulter, UK and Cellquest™ software) or by fluorescent microscopy (Nikon Eclipse 50i) and the image captured using image pro-plus software.
TUNEL (Terminal deoxynucleotidyltransferase-mediated dUTP-biotin nick end labelling) assay
After treatment with various agents, Giardia cells were centrifuged at 300 g for 5 min and washed twice with washing buffer. The cells were re-suspended in 50 μl of DNA labelling solution (10 μl of reaction buffer, 0·75 μl of TdT enzyme, 8·0 μl of BrdUTP and 31·25 μl of dH2O) and then incubated for 1 h at 37°C in a water bath with shaking every 15 min to ensure suspension. After this, the cells were rinsed twice with rinsing buffer and each time they were centrifuged at 300 g for 5 min and the supernatants removed. Pellets were then suspended in 100 μl of the antibody solution (5 μl of Alexa Fluor 488 dye-labelled antiBrdU antibody with 95 μl of rinse buffer) and incubated for 30 min at room temperature in the dark. Then 0·5 ml (1 mg/ml) of PI was added to each sample and the samples were incubated for another 30 min at room temperature in the dark.
Monodansylcadaverine (MDC) staining
MDC (Sigma, UK) was prepared fresh as a 5 mM solution in acetic acid for each experiment. For the assay, 50 μM MDC in acetic acid was added to all the samples, both control and starved cells, and these were then incubated in the dark for 15 min. After incubation the cells were washed×3 in PBS, centrifuged at 1200 g for 5 min, and the pellet was then re-suspended in PBS and viewed immediately under a fluorescence microscope.
It is well documented that wortmannin is a specific inhibitor of the PI3 kinases and that these kinases are actively involved in the regulation of autophagy. To check if the PI3 kinases are involved in the regulation of MDC labelling in starved Giardia cells, we pre-treated the cells before starvation and monitored the formation of MDC labelling. Cells were exposed to 25 μM wortmannin for 3 h before starvation after which they were stained with MDC.
Caspase assays
Giardia cells were induced with 50 μM hydrogen peroxide and incubated for 4 h. These cells were washed twice with PBS and then broken by sonication at 5 μm peak-to-peak amplitude 30% power. Broken cells were then pelleted and 50 μl of the supernatant was mixed with 10 μl (100 μM) of caspase 3 substrate conjugate (Z-DEVD (Asp-Glu-Val-Asp)-AFC (7-amino-4-trifluoromethylcoumarin), Calbiochem, UK. The reaction was assayed immediately (T0) using a fluorescence spectrophotometer at an excitation of ∼400 nm and an emission of ∼505 nm. The samples were then incubated for 1 h at 37°C and fluorescence was determined. The effects of caspase inhibitors were also determined. For this assay, confluent cultures of Giardia were harvested as outlined above and were incubated with various concentrations of each of the caspase inhibitors [Z-VAD-FMK (Z-carbobenzoxy-valyl–alanyl–aspartyl-[O-methyl]-fluoromethylketone) (general caspase inhibitor); Z-DEVD-FMK (Z-Asp-Glu–Val-Asp-fluoromethylketone) (caspase 3 inhibitor); Z-IETD–FMK (Ile–Glu (OMe)–Thr–Asp (OMe)-fluoromethylketone) (caspase 8 inhibitor)] for 1 h. Cells were then washed and induced for PCD with 50 μM hydrogen peroxide and incubated for 4 h. After incubation cells were stained with annexin and PI and the results were obtained by flow cytometry.
Western blotting
Sodium dodecyl sulphate–polyacrylamide gel electrophoresis (SDS-PAGE) was conducted using 10% (w/v) separating gel as described above. Samples of 50 μg/ml proteins were separated by denaturing SDS–PAGE and then transferred to nitrocellulose membranes. The membranes were blocked with 10% (w/v) skimmed milk and then incubated with anti-caspase 3 or anti-caspase 8 (1/1000 dilution) for 1 h. After being washed, the membranes were incubated with goat anti-mouse HRP conjugate (1/5000 dilution) for 1 h. Proteins were visualized by addition of a substrate (luminol).
Transmission electron microscopy
In the presence and absence of both hydrogen peroxide and metronidazole, 1×10⁷Giardia cells were incubated for 4 h and harvested. The cells were fixed overnight at room temperature with 2·5% (w/v) glutaraldehyde in 0·1 M phosphate buffer, pH 7·2, then post-fixed for 30 min with 1% (w/v) osmium tetroxide, 1·25% (w/v) potassium ferrocyanide and 5 mM calcium chloride (CaCl2) in 0·1 M cacodylate buffer, pH 7·2. They were then dehydrated in an ascending ethanol series (30%–100%) and embedded in Epon resin. Ultra thin sections were stained with uranyl acetate and lead citrate and then examined under an electron microscope (JEOL–JEM 1230) and Gatan multiscan 600–CW camera.
Bioinformatic analysis of Giardia genome
Giardia genomes were surveyed for genes that may express PCD-related proteins. This was performed by using consensus sequences of known components to search the ORF library available at http://www.giardiadb.org/giardiadb. Amino acid sequences of several proteins involved in PCD from different organisms were taken from the NCBI protein database. For each protein a consensus sequence was obtained using the program CLUSTALW (http://npsa-pbil.ibcp.fr/cgi-bin/align-multalin.pl) (Combet et al. Reference Combet, Blanchet, Geourjon and Deleage2000), the consensus sequence was used to search the Giardia genomes using BLASTP for homologues of the protein in Giardia. Also, individual amino acid sequences were used as BLAST queries in the Giardia genomes, in other to identify hits with high similarity index.
RESULTS
Effects of hydrogen peroxide and metronidazole
Giardia duodenalis isolates JKH-1 and MR4 were treated for 2 h, 4 h, 6 h, 8 h and 24 h with various concentrations of H2O2 (0, 25 μM, 50 μM and 100 μM) to induce PCD. These cells were then stained with annexin (marker for early apoptosis) and propidium iodide (PI) (marker for membrane damage, possibly late apoptosis/necrosis). Figure 1 shows the data obtained for MR4. Interestingly, even in the control set of data, cells stained with both annexin and PI. The levels of staining increased with time (Fig. 1A) such that by 24 h, 38% of cells stained with annexin and 59% with PI. When cells were exposed to H2O2 (Fig. 1B and C) a rapid increase in annexin staining was seen over the first 6 h, with the highest level seen with 50 μM H2O2. For both treatments after 6 h, the levels of staining decreased such that by 24 h only 8% (25 μM H2O2) and 3% (50 μM H2O2) of cells were stained. These changes were mirrored with PI staining suggesting that significant damage had occurred to these cells. With 100 μM H2O2 the maximum level of annexin staining (22%) occurred at 2 h and after that time levels decreased to 0 by 24 h. Staining with PI, however, increased rapidly such that by 8 h, 84% of cells were stained. Similar effects were seen with Giardia isolate, JKH–1 (data not shown).
Fig. 1. Time-dependent effects of hydrogen peroxide on Giardia duodenalis isolate MR4. Data represent the effects of various concentrations of hydrogen peroxide over a range of time points. The cells were stained with annexin and PI and the results were obtained with flow cytometry. The error bars represents standard deviation from the mean. For this data set n=4. (A) 0 live control – no hydrogen peroxide; (B) 25 μM hydrogen peroxide; (C) 50 μM hydrogen peroxide; (D) 100 μM hydrogen peroxide.
Time-dependent effects of metronidazole
The effects of metronidazole on MR4 are shown in Fig. 2. After treatment with 2 μg/ml metronidazole (a sub-MIC dose) the kinetics of staining was different from those observed with H2O2 cells. Under these conditions maximum staining with either PI or annexin was seen after 17 h. After this, levels of annexin staining decreased whilst levels of PI staining remained constant. Cells treated with 5 μg/ml metronidazole (a dose higher than MIC) again showed maximum annexin staining after 17 h (40%). However, for PI we saw a biphasic response with staining increasing rapidly to 50% by 8 h and then a second increase to >90% was seen after 17 h, and this mirrored the decline in annexin staining. Again the data for JKH–1 (not shown) was similar except that the maximum level of PI staining after 24 h (70%) was less than that seen for MR4 and this presumably reflects the decreased sensitivity of this isolate to metronidazole.

Fig. 2. Effects of metronidazole on Giardia duodenalis isolate MR4 after treatment at different time points up to 24 h. Data were obtained from flow cytometry. After treatment the cells were stained with annexin and PI. The error bars represent the standard deviation from the mean. For this data set n=6. (A) After treatment with 2 μg/ml metronidazole; (B) after treatment with 5 μg/ml metronidazole.
DNA fragmentation
The effects of treatment of Giardia with metronidazole (Fig. 3) and H2O2 after 24 h were observed by fluorescence microscopy. The cells were stained with TUNEL reagent. We can clearly see the difference between the treated and untreated cells represented in the histogram.

Fig. 3. (A) DNA fragmentation in Giardia duodenalis (MR4) 24 h after treatment with hydrogen peroxide and metronidazole. After treatment the cells were stained with TUNEL reagent. The error bars represent the standard deviation from the mean. n=6.
Starvation and cell response
The effects of starvation on the Giardia isolate JKH–1 are shown in Fig. 4. In Fig. 4A and B we see untreated control cells stained with PI, annexin and DAPI. As expected, low levels of annexin and PI staining were observed. Cells treated with H2O2 (apoptotic-like control) showed, as expected, a high level of annexin staining Fig. 4C and D. However, when cells were starved in PBS for 12 h (Fig. 4E and F) we observed an increase in PI staining with no change in annexin, suggesting that cells are damaged but not undergoing an apoptotic-like process. When starved cells were stained with MDC we observed punctate staining within the cell and this contrasted to the staining observed in control cells (Fig. 4 G and H). This staining is suggestive of the presence of autophagic vacuoles and this is further supported by the inhibition of punctate MDC staining by pre-treatment of cells with wortmannin (Fig. 4I). Clearly this suggests that starvation induces a type of cell death which is different from that initiated by hydrogen peroxide. Interestingly, cells treated with rapamycin, a known inducer of autophagy in mammalian cells, did not stain with MDC (data not shown).
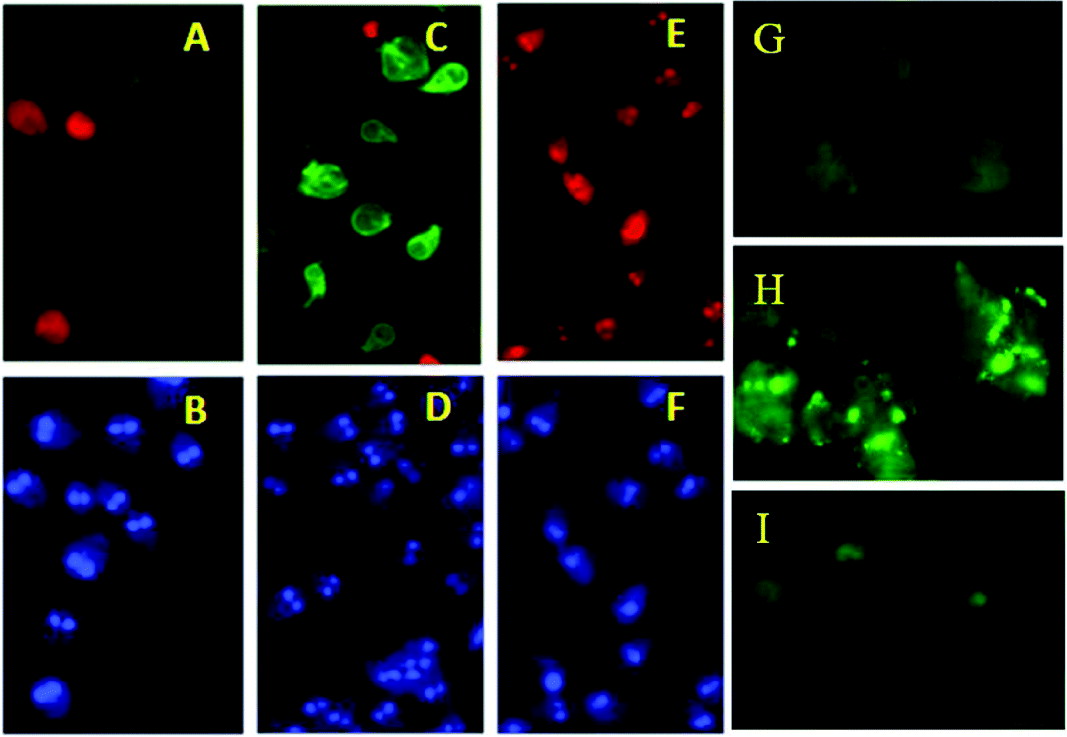
Fig. 4. (A) Annexin (green) and PI (red) of control cells, (B) DAPI (blue) stain of control cells. (C) Annexin and PI stain of 50 μM H2O2 treated cells (D) DAPI stain of 50 μM H2O2 treated cells, (E) Annexin and PI stain of cells starved in PBS for 12 h, (F) DAPI stain of cells starved in PBS for 12 h; MDC staining of Giardia cells (G) control cells, (H) starved cells (12 h), (I) starved cells+3 h pre-treatment with wortmannin (P13 K inhibitor).
Caspase activity
The effect of caspase inhibitors is shown in Table 1. In Giardia trophozoites it was observed that, after initial treatment with each of the caspase inhibitors and induction with H2O2, there was no significant change in the number of cells stained with annexin and PI. Also there was no statistically significant difference between the inhibited and uninhibited trophozoites. On the other hand, THP-1 cells showed a significant reduction with increasing concentration of inhibitors on the number of cells stained with PI and annexin. Western blotting was performed with caspase 3 antibody on cell-free extracts of both Giardia isolates and THP-1 cells after treatment with H2O2. We observed staining in the lanes containing our control THP-1 cells but did not observe any staining/bands in any of the Giardia extracts used, even with 50 μg/ml protein (results not shown).
Table 1. Effects of caspase inhibitors Z-VAD-FMK (general caspase inhibitor) on THP-1 cells and Giardia trophozoites JKH-1 and MR4
Transmission electron microscopy
When observed with transmission electron microscopy, control untreated Giardia trophozoites (Fig. 5A), showed typical pear or teardrop shaped morphology. The ventral disc (d) was seen in the anterior region of the cell and it was surrounded by the marginal groove and the ventro-lateral flange. The adhesive disc, located in the ventral anterior region of the trophozoite, was mainly made of concentrically arranged microtubules. The flagella were externalized. After treatment with H2O2, we observed changes in cell shape, with cells becoming rounded or spherical in appearance. Within the cell we saw changes such as vacuoles on the periphery that became more electron dense and contained clearly defined structures (Fig. 5B). In addition (Figure 5C), we saw displacement of the nucleus and nuclear condensation along with fragmentation of the ventral disc.

Fig. 5. Transmission electron micrographs of Giardia duodenalis. (A) Control cells showing normal trophozoite ultrastructure. Flagella externalized, the disc (d) is ventral, 6 axonemes (a), are located in between 2 nuclei (n), the vacuoles on the periphery are clear; (B) Giardia cell after treatment with 50 μM H2O2. The vacuoles on the periphery are filled with electron-dense material as can be seen in the magnified image. (C) Cytotoxic effects showing fragmentation of the ventral disc, nuclear condensation and change in cell shape showing dorsal protuberance.
Giardia genome analysis
Bioinformatic analysis of Giardia genomes (Table 2) revealed various key genes present in the genome that are related to autophagy. In contrast we were not able to detect any apoptotic gene that had any significant similarity with those identified in other protozoa and eukaryotes (Table 3); however, we did observe the presence of TOR and ATG8.
Table 2. Bioinformatic analysis of the Giardia genome

Table 3. Bioinformatic analysis of Giardia genome

DISCUSSION
It has been shown that organisms use different pathways of programmed cell death to actively self-destruct. The data presented in this study indicate that Giardia undergoes programmed cell death in response to various stresses and that there are 2 distinct non-necrotic forms, apoptosis-like (Type I) PCD and autophagy-like (Type II) PCD. Our data support studies by other investigators (Pérez-Arriaga et al. Reference Pérez-Arriaga, Mendoza-Magaña, Cortés-Zárate, Corona-Rivera, Bobadilla-Morales, Troyo-Sanromán and Ramírez-Herrera2006; Ghosh et al. Reference Ghosh, Ghosh, Ghosh, Nozaki and Ganguly2009; Corrêa et al. Reference Corrêa, Vilela, Menna-Barreto, Midlej and Benchimol2009; Shemarova, Reference Shemarova2010) who have demonstrated through the use of staining that a type of PCD occurs in Giardia. However, we also present additional data to suggest that apoptotic-like cell death occurs via a mechanism(s) independent of caspases. We were unable to detect caspase activity using a range of approaches including, Western blot, and the use of specific fluorescent substrates and inhibitors. Corrêa et al. (Reference Corrêa, Vilela, Menna-Barreto, Midlej and Benchimol2009) demonstrated that Giardia possesses 2 forms of cell death – apoptosis and autophagy. Interestingly, this group proposed the presence of caspases and a caspase-dependent mechanism using CaspaTag and fluorescence microscopy. This method, although frequently used, has been shown by several authors to have questionable specificity (Darzynkiewicz and Pozarowski, Reference Darzynkiewicz and Pozarowski2007). The lack of caspase genes in the genome of unicellular eukaryotes and the possession of an apoptotic pathway independent of caspases has been well documented. In recent years there have been various reports highlighting the involvement of metacaspases in an apoptotic-like PCD in unicellular organisms. Metacaspases have shown a well-established functional activity in yeast (Mazzoni and Falcone, Reference Mazzoni and Falcone2008), but work in Trypanosoma brucei (Helms et al. Reference Helms, Ambit, Appleton, Tetley, Coombs and Mottram2006) and Plasmodium berghei (Le Chat et al. Reference Le Chat, Sinden and Dessens2007) has been inconclusive (Atkinson et al. Reference Atkinson, Babbitt and Sajid2009). Caspase-independent apoptosis does occur; however, this typically requires the presence of functional mitochondria and therefore this pathway is unlikely in Giardia because this organism lacks mitochondria. Giardia does, however, have a relic structure termed the mitosome but this organelle is not able to generate energy and no clear metabolic or signalling role has been associated with it (Rosa et al. Reference Rosa, Einicker-Lamas, Bernardo and Benchimol2008). Analysis of the Giardia genome for apoptotic-related genes including caspases and metacaspases was unsuccessful in that we were unable to identify any components. Clearly there are a number of factors that may contribute to this observation including errors in the genome; however, it more likely that this is due to significant diversity in the lower eukaryotes with respect to physiology, metabolism and evolutionary position. Similar observations have been made in other protozoans such as Trichomonas and Blastocystis (Tan and Nasirudeen, Reference Tan and Nasirudeen2005; Helms et al. Reference Helms, Ambit, Appleton, Tetley, Coombs and Mottram2006). These authors have suggested that apoptotic-like PCD occurs via a unique mechanism(s) that is very different from that seen in other higher eukaryotic cells. It is possible that such organisms have developed an assortment of mechanisms for PCD.
In addition to apoptotic-like PCD, starvation-induced death demonstrated evidence of autophagy (type II PCD) in Giardia. This observation was supported by morphological and bioinformatics analysis. It would seem from the genome data presented that the autophagy pathway shows some conservation; however, our survey suggested that the pathway in Giardia is not complete. This is in clear contrast to our ‘apoptotic’-like mechanism(s). However, these data must be looked at carefully as the level of divergence in Giardia proteins may make these types of analysis biased towards those that have significant homology.
The mechanism of programmed cell death (PCD) which takes place in amitochondriate Giardia is still unknown. The pathways involved are not yet clear although we find that the end results are similar to known pathways in other unicellular organisms. Our study supports the claim that PCD originated prior to multicellularity and divergence of the unicellular eukaryotes. These processes would seem to be evolutionarily conserved; however, the mechanisms that underpin these are not common to all eukaryotes.
We should also highlight that we were unable to observe any major differences in the response of our two isolates (taken from assemblages A and B) to the various stresses used in this study. We have highlighted the only variation observed in relation to metronidazole and this could be related to the difference in sensitivities of the isolates to the drug. In addition, our genomic survey utilized data from all of the genomes available in the Giardia genome database. We suggest that the lack of variation in response to stress may be indicative of common mechanisms used by this genetically diverse group to cope with these insults. Our genomic survey also was unable to highlight any differences between the genomes available in the database. Thus, we suggest that the group may exhibit common responses; however, as we do not fully understand the mechanisms involved we are not able to say if all isolates utilize the same cellular machinery.
Finally, it is clear that to delineate such pathways in the protozoans will require a global analysis of transcriptomes and proteomes. Elucidation of these pathways is of great significance not only in terms of evolution but also in terms of identifying novel approaches for the treatment of giardiasis and for the control of many important protozoan parasites. Efficacious targeting at the molecular level should lead to disease control and produce few undesirable side effects in the host, particularly as the mechanisms involved in both the mammalian and Giardia systems would seem to be significantly different.
FINANCIAL SUPPORT
We would like to thank the Medway School of Pharmacy, Central Avenue, Chatham Maritime, Chatham, Kent ME4 4TB for funding us to carry out this project.


