Introduction
Water deficit is a common environmental factor that constrains crops to express their ecophysiological potential and causes crop yield reduction (Jones and Corlett, Reference Jones and Corlett1992; Souza and Cardoso, Reference Souza and Cardoso2003). The best option to improve crop production and yield stability under drought stress is to develop drought-tolerant crop varieties (Blum, Reference Blum1988; Ashraf et al., Reference Ashraf, Ozturk and Athar2009). Different crop species, subspecies and cultivars might show variations in drought tolerance, suggesting the importance of identifying drought-tolerant genotypes for crop improvement (Budak et al., Reference Budak, Kantar and Kurtoglu2013). For Brassica crops' improvement, wild relatives that harbour drought tolerance are of great importance (Sun et al., Reference Sun, Yang, Zhang, Zhang and Yun1999; Prakash and Bhat, Reference Prakash and Bhat2007).
Eruca species are important marginal oil crops grown on soils with reduced fertility in India, Pakistan, Canada and China, and preferred over other relative species because of their tolerance and adaptability to unfavourable environmental conditions (Ashraf, Reference Ashraf1994; Sun et al., Reference Sun, Yang, Zhang, Zhang and Yun1999, Reference Sun, Pan, Liu, Meng, Zhang, Wang and Zeng2004; Prakash and Bhat, Reference Prakash and Bhat2007; Warwick et al., Reference Warwick, Gukel, Gomez-Campo and James2007). Eruca lines with larger and yellow seeds, higher plant and seed yield have been reported to be available (Huang et al., Reference Huang, Liao, Cheng, Ye, Luo, Li, Cai, Wu and Huang2014). Recently, it has been reported that Eruca species are tolerant to heavy metals and could be developed into an industrial oil crop for phytoremediation (Zhi et al., Reference Zhi, Deng, Luo, Ding, Hu, Deng, Li, Zhao, Zhang, Wu and Huang2015). In this study, the influence of different polyethylene glycol (PEG) concentrations on seed germination and early Eruca seedling growth was studied, and then tolerances to PEG-simulated drought stress in one line of Brassica carinata, one line of Brassica napus and 249 Eruca lines were evaluated based on the principal component analysis (PCA) and unweighted pair-group arithmetic average (UPGMA) cluster analysis.
Materials and methods
Materials
In this study, 237 Eruca lines were obtained from the Agricultural Research Service, USDA. Twelve Eruca lines and one B. carinata line (B. carinata cultivar XB1) were provided by the laboratory of Oil Crops, Hubei University. One line of B. napus (B. napus cultivar Zhongshuang 9) was obtained from Oil Crops Research Institute, Chinese Academy of Agricultural Sciences, China. The plant materials and their codes are listed in Supplementary Table S1 (available online).
Methods
First, the seeds of one Eruca line (Eruca vesicaria subsp. sativa cultivar Hubu-14) were treated with 0, 5, 10, 15 and 20% PEG 6000 to study the influence of PEG concentrations on early seedling growth, and then the seeds of B. napus cultivar Zhongshuang 9, B. carinata cultivar XB1 and 249 Eruca lines were treated with 20% PEG to evaluate their drought tolerance. Healthy seeds were inoculated in 9 cm sterile Petri dishes lined with three layers of sterile Whatman filter papers supplemented with 5 ml of distilled water or the respective PEG solutions. About 1 ml ddH2O or respective PEG solution was added into each Petri dish every day. After seed inoculation, the germinated seeds were counted every second day for 8 d. The incubation temperature was set at 25°C with a 16 h photoperiod under a 2000 lx white fluorescent lamp. The experiment was arranged in a completely randomized design with three replicates, each replicate with about 20 seeds. Root length, shoot length and fresh seedling weight were measured 8 d after seed inoculation.
Seedling vigour (SV) was calculated by using the following formula:
 $$\begin{eqnarray} SV = germination\,percentage\times seedling\,length. \end{eqnarray}$$
Relative seedling vigour (RSV) was calculated as seedling vigour of the PEG treatment divided by that of the control (Li et al., Reference Li, Yang, Zhang, Zou, Cheng, Zheng and Li2008).
The mean germination time (MGT) was calculated for each lot according to the equation developed by Ellis and Roberts (Reference Ellis, Roberts and Hebblethwaite1980):
 $$\begin{eqnarray} MGT = \frac {\Sigma ( nT )}{\Sigma n }, \end{eqnarray}$$
where n is the number of seeds newly germinated at time T, with T representing the days from the beginning of the germination test; and Σn is the final germination. Relative mean germination time (RMGT) was calculated as MGT of PEG treatment divided by that of the control.
Germination velocity (GV) was calculated as described by Khan and Ungar (Reference Khan and Ungar1984):
 $$\begin{eqnarray} GV = \Sigma G / t , \end{eqnarray}$$
where G is the percentage of seed germination at 2 d intervals and t is the total germination period. Relative germination velocity (RGV) was calculated as the germination of the PEG treatment divided by that of the control.
Germination drought resistance (GDR) was calculated as described by Bouslama and Schapaugh (Reference Bouslama and Schapaugh1984):
 $$\begin{eqnarray} GDR = 1.00\times nd2 + 0.75\times nd4 + 0.5\times nd6 + 0.25\times nd8, \end{eqnarray}$$
where nd2, 4, 6, 8 indicate the germination percentage on days 2, 4, 6 and 8, respectively. Relative germination drought resistance (RGDR) was calculated as GDR of the PEG treatment divided by that of the control.
Relative seed germination (RSG), relative root length (RRL), relative shoot root length (RSL), relative fresh seedling weight (RFSW) were calculated as the averages of the PEG treatment divided by that of the controls. Variance, correlation and PCA analyses were carried out on SPSS 19.0. Dendrograms were generated using UPGMA clustering procedure in a sequential agglomerative hierarchical combination strategy based on the similarity matrix generated by NTSYSpc version 2.1 (Rohlf, Reference Rohlf2000). A cophenetic matrix was derived from the similarity matrix using COPH (cophenetic values) program, and goodness-of-fit of the clusters was tested by comparing the original similarity matrix with the cophenetic value matrices using Mantel matrix correspondence test (Mantel, Reference Mantel1967).
Results
Influence of different PEG concentrations on seed germination and early seedling growth in Eruca
Variance analyses (data not shown) indicated that the influence of different PEG concentrations on the RRL, RSL and RFSW of E. vesicaria subsp. sativa cultivar Hubu-14 was highly significant (P< 0.01), but was not significant on RSG (P>0.05). The 20% PEG 6000 concentration significantly decreased the RRL, RSL and RFSW of Eruca (Fig. 1).

Fig. 1 Influence of polyethylene glycol (PEG) concentrations on relative seed germination (RSG), relative root length (RRL), relative shoot length (RSL) and relative fresh seedling weight (RFSW) in Eruca vesicaria subsp. sativa cultivar Hubu-14.
Genotypic variation among the drought tolerance indices
Variance analyses (data not shown) indicated that under the 20% PEG treatment, differences among the tested genotypes were highly significant (P< 0.01) with respect to the RSG, RRL, RSL, RFSW, RSV, RMGT, RGV and RGDR. From Table 1, it is evident that in the tested Eruca lines, the root growth was, in general, stimulated, while the shoot length and fresh seedling weight were inhibited by the PEG treatment. The other drought tolerance indices were not so severely influenced by the PEG treatment. Among the drought tolerance indices, RSV had the greatest variation, followed by RRL, RSL, RFSW, RGV, RGDR and RSG, while RMGT showed the least variation. RRL, RSL, RFSW, RSV were much higher in Eruca than in B. napus cultivar Zhongshuang 9, while the difference was not so significant with respect to RSG, RMGT, RGV and RGDR (Table 1).
Table 1 Coefficient of variations among the drought tolerance indices of Eruca and Brassica napus cultivar Zhongshuang 9

For the description of the abbreviations, see the Materials and methods section. RSG, relative seed germination; RRL, relative root length; RSL, relative shoot root length; RFSW, relative fresh seedling weight; RSV, relative seedling vigour; RMGT, relative mean germination time; RGV, relative germination velocity; RGDR, relative germination drought resistance.
Correlations among the drought tolerance indices of Eruca
In Table 2, simple correlation analyses indicated that in Eruca, RSG was positively correlated with RRL, RSV, RGV and RGDR (P< 0.01) but negatively correlated with RFSW (P< 0.05); RRL was positively correlated with RSL, RFSW, RSV, RGV and RGDR (P< 0.01); RSL was positively correlated with RFSW and RSV (P< 0.01) but negatively correlated with RMGT (P< 0.01); RFSW was positively correlated with RSV (P< 0.01); RSV was positively correlated with RGV and RGDR (P< 0.01) but negatively correlated with RMGT (P< 0.01); RMGT was negatively correlated with RGV and RGDR (P< 0.01); and RGV was positively correlated with RGDR (P< 0.01). Further partial correlations indicated that RSG was positively correlated with RSV, RMGT and RGDR (P< 0.01) but negatively correlated with RRL, RFSW and RGV (P< 0.01); RRL was positively correlated with RSV (P< 0.01) but negatively correlated with RSL (P< 0.05); RSL was positively correlated with RFSW and RSV (P< 0.01) but negatively correlated with RMGT (P< 0.05); RFSW was positively correlated with RGDR (P< 0.01) but negatively correlated with RGV (P< 0.01); RMGT was positively correlated with RGDR (P< 0.01) but negatively correlated with RGV (P< 0.01); and RGV was positively correlated with RGDR (P< 0.01).
Table 2 Simple and partial correlations among the drought tolerance indices of Eruca a

For the description of the abbreviations, see the Materials and methods section. RSG, relative seed germination; RRL, relative root length; RSL, relative shoot root length; RFSW, relative fresh seedling weight; RSV, relative seedling vigour; RMGT, relative mean germination time; RGV, relative germination velocity; RGDR, relative germination drought resistance.
*, Significant at the 0.05 level; **, significant at the 0.01 level.
a Simple correlations (above the diagonal); partial correlations (below the diagonal).
PCA of drought tolerance indices
PCA based on eight drought tolerance indices showed that the first three components with latent root values more than 1 accounted for 85.46% of the total variation. Principal component (PC) 1 with high contributions from RGDR, RGV, RSG, RMGT, RSV, RFSW and RRL accounted for 43.89% of the total variation. PC2 with high contributions from RRL, RSL, RSV and RFSW accounted for 27.85% of the total variation. PC3 with high contributions from RFSW, RMGT and RSL accounted for 13.73% of the total variation (Table 3). The loadings for the components yielded from the PCA are given in the following equations:
 $$\begin{eqnarray} Z_{1} = 0.46\hairsp RSG + 0.22\hairsp RRL + 0.08\hairsp RSL + 0.03\hairsp RFSW + 0.32\hairsp RSV - 0.33\hairsp RMGT + 0.51\hairsp RGV + 0.51\hairsp RGDR; \end{eqnarray}$$
 $$\begin{eqnarray} Z_{2} = - 0.12\hairsp RSG + 0.50\hairsp RRL + 0.47\hairsp RSL + 0.43\hairsp RFSW + 0.47\hairsp RSV + 0.22\hairsp RMGT - 0.18\hairsp RGV - 0.17\hairsp RGDR; \end{eqnarray}$$
 $$\begin{eqnarray} Z_{3} = 0.22\hairsp RSG + 0.35\hairsp RRL - 0.44\hairsp RSL - 0.54\hairsp RFSW + 0.33\hairsp RSV + 0.48\hairsp RMGT - 0.09\hairsp RGV - 0.06\hairsp RGDR. \end{eqnarray}$$
Scores of the first three components and the final PC score for each line are given in Supplementary Table S1 (available online). In total, 11 Eruca lines (E. vesicaria subsp. sativa PI 650219, 170362, 388803, 164936, 251498, 426727, 426626, 650220, 650230, 426723 and 251492) were found to have final PC scores higher than 2.0 and thus considered to be highly drought tolerant.
Table 3 Principal components (PC) with latent root values more than 1 in Eruca and Brassica napus cultivar Zhongshuang 9 for drought tolerance

RSG, relative seed germination; RRL, relative root length; RSL, relative shoot root length; RFSW, relative fresh seedling weight; RSV, relative seedling vigour; RMGT, relative mean germination time; RGV, relative germination velocity; RGDR, relative germination drought resistance.
Cluster analysis
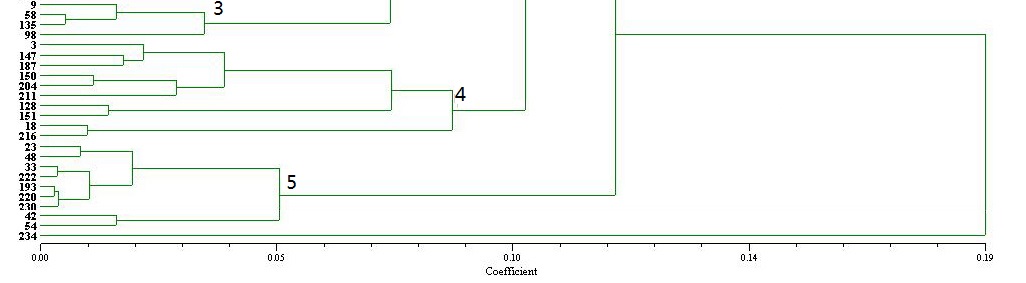
The Mantel test indicated that the cophenetic matrix of UPGMA cluster dendrogram was moderately high (r= 0.68). Therefore, it can be concluded that the dendrogram provides a good representation of the similarity matrix. UPGMA cluster analysis using NTSYSpc version 2.1 (Rohlf, Reference Rohlf2000) indicated that the Eruca lines and B. napus cultivar Zhongshuang 9 could be clustered into five major groups. The first group (Supplementary Fig. S1-1, available online) was, in general, drought sensitive, but the subgroup formed by 426673 (code 74), 426687 (code 84), 650194 (code 163), 429696 (code 100), 426695 (code 79), 426625 (code 59), 426660 (code 76) and 426688 (code 91) was an exception, in that they were slightly drought tolerant. The second group (Supplementary Fig. S1-2, available online) was, in general, slightly–medium drought tolerant, with the exception of the subgroup formed by PI 251493 (code 17), 426716 (code 115), 407630 (code 31), 633205 (code 132), 650217 (code 221), 426714 (code 124), 426735 (code 127) and 426715 (code 113), in that they showed slight–medium drought sensitivity. Group 3 including PI 251492 (code 9), 426626 (code 58), 426727 (code 135) and 426710 (code 98) showed high PC1 and low PC2 and was, in general, drought tolerant with the exception of PI 426710 (code 98), which showed only slight drought tolerance. Group 4 including PI 426645 (code 3), 650187 (code 147), 426746 (code 187), 650180 (code 150), 650214 (code 204), 650214 (code 211), 426725 (code 128), 597835 (code 151), 597834 (code 18) and 650237 (code 216) generally showed low PC1 and high drought sensitivity. Group 5 including PI 170362 (code 23), 164936 (code 48), 251498 (code 33), 650219 (code 222), 650183 (code 193), 650230 (code 220), 650220 (code 230), 388803 (code 42) and 388804 (code 54) generally showed high drought tolerance. B. carinata cultivar XB1 (code 234), as an outstander, showed high drought sensitivity (Supplementary Fig. S1-3, 4, 5, available online).
Discussion
Genetic improvement of drought tolerance in crops can be achieved by identifying resources of drought tolerance. Differences in drought tolerance have been well illustrated in maize (Grzesiak, Reference Grzesiak2001), wheat (Winter et al., Reference Winter, Musick and Porter1988), rapeseed (Richards and Thurling, Reference Richards and Thurling1978), oat (Larsson and Gómy, Reference Larsson and Gómy1988), broad bean and field pea (Grzesiak et al., Reference Grzesiak, Iijima, Kono and Yamauehi1997) and coconut (Gomez et al., Reference Gomez, Oliva, Mielke, de Almeida, Leita and Aquino2008). Wild germplasm and landraces can also be valuable genetic resources for breeding towards drought tolerance (Peleg et al., Reference Peleg, Fahima, Abbo, Krugman, Nevo, Yakir and Saranga2005; Hegde and Mishra, Reference Hegde and Mishra2009). It has been reported that Eruca is one of the Cruciferae species most tolerant to drought (Sun et al., Reference Sun, Yang, Zhang, Zhang and Yun1999; Prakash and Bhat, Reference Prakash and Bhat2007).
Methods of screening for drought tolerance within a large number of genotypes should be easy, fast, accurate and inexpensive (Grzesiak et al., Reference Grzesiak, Grzesiak, Filek and Stabryta2003). Field/pot screening for roots is destructive, costly and laborious when a large number of genotypes is involved (Razavi et al., Reference Razavi, Keyser, Riek and Van Labeke2011). Germinating seeds under PEG-simulated drought stress have several advantages compared with field/pot screenings, including: easy to score root and shoot traits; controlled environmental conditions, thus increasing the repeatability; screening large numbers of genotypes in a small space within a short time; precise control of the concentration of mineral nutrients (Kumar et al., Reference Kumar, Abdel-Ghani, Pace, Reyes-Matamoros, Hochholdinger and Lübberstedt2014). It has been established that PEG-induced drought stress mimics withdrawal of water from plants (Lawlor, Reference Lawlor1970; Perez-Alfocea et al., Reference Perez-Alfocea, Estan, Caro and Guerrier1993). It has been reported that exposing plant roots to a PEG 6000 solution had no toxic symptoms at the plant level (Hardegree and Emmerich, Reference Hardegree and Emmerich1990; Zgallai et al., Reference Zgallai, Steppe and Lemeur2005). Because PEG is a neutral polymer and highly soluble in water, it has been widely used to induce drought stress in plants (Zgallai et al., Reference Zgallai, Steppe and Lemeur2005).
PCA is designed to transform the original variables into new uncorrelated variables called ‘components’, which are linear combinations of the original variables. It is used to explain the observed variances and to understand the interrelationship among different parameters (Alvin, Reference Alvin2002). PCA has been successfully used for studying drought tolerance in soybean (Kron et al., Reference Kron, Souza and Ribeiro2008), trees (Worbes et al., Reference Worbes, Blanchart and Fichtler2013) and tomato (Shamimi et al., Reference Shamimi, Saqlan, Athar and Waheed2014). In the present study, it was found that 20% PEG 6000 decreased significantly the RRL, RSL and RFSW of Eruca. Then, 20% PEG 6000 was used to evaluate the drought tolerance in the Brassica and Eruca lines using the PCA in combination with the UPGMA cluster analysis, and some highly drought-tolerant Eruca lines were identified. Our results indicated that RRL, RSL, RFSW and RSV were much higher in Eruca than in B. napus cultivar Zhongshuang 9, which has been reported to have relatively high drought tolerance (Xie et al., 2013), while the difference was not so significant with respect to RSG, RMGT, RGV and RGDR. Highly drought-tolerant Eruca lines will be valuable for drought tolerance improvement not only in Eruca itself, but also in Brassica crops as they are drought-tolerant lines from a drought-tolerant species.
Supplementary material
To view supplementary material for this article, please visit http://dx.doi.org/10.1017/S1479262115000519
Acknowledgements
This work was supported by funds from the Science and Technology Department of Hubei Province; Huangshi Science and Technology Bureau, Key Laboratory Biology and Genetic Improvement of Oil Crops, Ministry of Agriculture, China; the National Natural Science Foundation of China (30771382, 30671334, 30971807, 31201238); an European Committee 7th Framework Programme (ICON, 211400) and the Swedish Research Links project.