INTRODUCTION
The transition from the last glaciation to the Holocene in the Northern Hemisphere is characterized by consecutive cooler and warmer periods. These abrupt climate shifts were registered in ice cores (Johnsen et al. Reference Johnsen, Clausen, Dansgaard, Fuhrer, Gundestrup, Hammer, Iversen, Jouzel, Stauffer and Steffensen1992; Alley et al. Reference Alley, Shuman, Meese, Gow, Taylor, Cuffey, Fitzpatrick, Grootes, Zielinski, Ram, Spinelli and Elder1997; Rasmussen et al. Reference Rasmussen, Andersen, Svensson, Steffensen, Vinther, Clausen, Siggaard-Andersen, Johnsen, Larsen, Bigler, Röthlisberger, Fischer, Goto-Azuma, Hansson and Ruth2006), lacustrine sediments (Goslar et al. Reference Goslar, Kuc, Ralska-Jasiewiczowa, Różanski, Arnold, Bard, Van Geel, Pazdur, Szeroczyńska, Wicik, Więckowski and Walanus1993, Reference Goslar, Arnold, Tisnerat-Laborde, Czernik and Ralska-Jasiewiczowa2000; Hajdas Reference Hajdas, Ivy-Ochs, Beer, Bonani, Imboden, Lotter, Sturm and Suter1993, Reference Hajdas, Ivy-Ochs, Bonani, Lotter, Zollitschka and Schlüchter1995; Brauer et al. Reference Brauer, Endres, Güntera, Litt, Stebich and Negendanka1999; Schwander et al. Reference Schwander, Eicher and Ammann2000; Nakagawa et al. Reference Nakagawa, Kitagawa, Yasuda, Tarasov, Nishida, Gotonda and Sawai2003), marine varves (Kitagawa and van der Plicht Reference Kitagawa and van der Plicht1998; Hughen et al. Reference Hughen, Southon, Lehman and Overpeck2000), as well as speleothems (Wang et al. Reference Wang, Cheng, Edwards, An, Wu, Shen and Dorale2001).
Dendrochronological research on subfossil wood ongoing in recent years allowed for construction of chronologies covering the Late Glacial period. Numerous sites with postglacial subfossil wood were found in the Alps. Wood from the sites in Switzerland allowed for construction of the Swiss Lateglacial Master Chronology (SWILM), 1606-yr in length, dated to ca. 14,300–12,700 cal BP (Kaiser et al. Reference Kaiser, Friedrich, Miramont, Kromer, Sgier, Schaub, Boeren, Talamo, Guibal and Sivan2012). This chronology was correlated with dendrochronological curves based on pinewood from gravel pits of the river Danube and its tributaries spanning the periods: ca. 14,000–13,300 cal BP and ca. 13,280–12,950 cal BP (Spurk et al. Reference Spurk, Friedrich, Hofmann, Remmele, Frenzel, Leuschner and Kromer1998a, Reference Spurk, Friedrich, Hofmann, Remmele, Frenzel, Leuschner and Kromer1998b; Friedrich et al. Reference Friedrich, Remmele, Kromer, Hofmann, Spurk, Kaiser, Orcel and Küppers2004).
Chronologies based on subfossil pine trees from sites situated in lowland areas form another group, located several hundred kilometers to the north from the aforementioned ones, e.g. Warendorf (Westphalen), covering the period 13,720–13,260 cal BP, and Reichwalde near Cottbus (Lausitz), spanning 14,020–13,570 cal BP (Friedrich et al. Reference Friedrich, Knipping, von der Kroft, Renno, Ullrich and Vollbrecht2001, Reference Friedrich, Remmele, Kromer, Hofmann, Spurk, Kaiser, Orcel and Küppers2004; Kaiser et al. Reference Kaiser, Friedrich, Miramont, Kromer, Sgier, Schaub, Boeren, Talamo, Guibal and Sivan2012). Another area in which numerous trunks of subfossil pine trees were encountered is Late-Vistulian terrace in the Warta river valley, in the region of Koźmin and Kwiatków (central Poland) (Dzieduszyńska et al. Reference Dzieduszyńska, Kittel, Petera-Zganiacz, Brooks, Korzeń, Krąpiec, Pawłowski, Płaza, Płóciennik, Stachowicz-Rybka and Twardy2014).
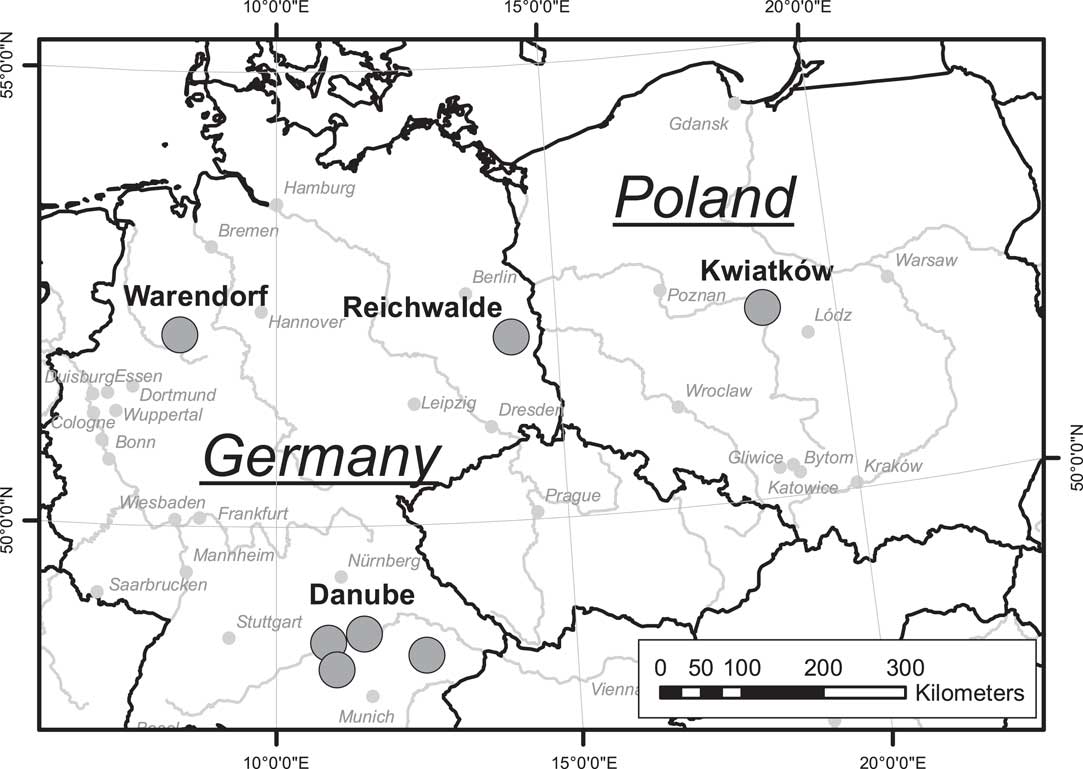
The Kwiatków site lies in the southern stretch of the Warta river valley, which is at this point about 8 km wide. It is located about 12 km south of Koło, at 18°40'48,34″E, 52°5'58,876″N (Figure 1). The site was discovered during archaeological excavations of a vast settlement complex from the pre-Roman and Roman periods (2nd century BC to 3rd century AD). During the exploration of deep archaeological features, the organic mud horizon with subfossil trees has been recorded, similar to that known from the Koźmin Las site (Dzieduszyńska et al. Reference Dzieduszyńska, Kittel, Petera-Zganiacz, Brooks, Korzeń, Krąpiec, Pawłowski, Płaza, Płóciennik, Stachowicz-Rybka and Twardy2014). The investments aimed at opening up a new exploitation field in the brown coal mine Adamów, enabled to unveil the organic level with Late Glacial trunks of pine trees and sampling them.

Figure 1 Location of the original study site Kwiatków and German sites with subfossil pine wood from Allerød.
MATERIAL AND METHODS
Dendrochronology
Samples were collected in three large trenches of approximately 800 m2 each. In total, over 300 wood fragments of collapsed trunks and stumps were collected for dendrochronological analysis and species identification. Most of the samples represented pine (Pinus sylvestris L.), but some birch (Betula sp.) trees were recognized as well. Dendrochronological analysis was made for 267 selected samples of wood coming from subfossil pine trunks and branches with more than 40 tree rings. Among the pine trees examined, young specimens prevailed. The trees older than 150 yr appeared only occasionally, while the oldest specimen grew 234 yr.
Among the samples analyzed dendrochronologically, the ones cut from pine trunks predominated. On account of the sequence lengths as well as the lowest anatomical perturbations, they were used for construction of the local chronology. The average curve (2KWI_A3C), produced from the 46 tree-ring sequences best correlating mutually, spanned 265 yr. The intercorrelation of samples is 0.490 (P<0.01) and the expressed population signal (EPS) equal to 0.9. The EPS indicates how close a dendrochronological mean curve is to a hypothetical chronology of the total population (Cook and Kairiukstis Reference Cook and Kairiukstis1990). The approximate age of the pine chronology 2KWI_A3C was determined on the basis of the AMS radiocarbon (14C) dating of samples containing selected annual growth rings and then teleconnected with Reichwalde chronology to 13,821–13,557 cal BP (M. Friedrich and F. Reinig, personal communication). This dating is supported by high statistical agreement between the chronologies: t=5.5 and Gl=61 (Gleichlaeufigkeit-% [Gl] and the t-value [t]; see Baillie and Pilcher Reference Baillie and Pilcher1973; Rinn Reference Rinn2005 for details).
Material
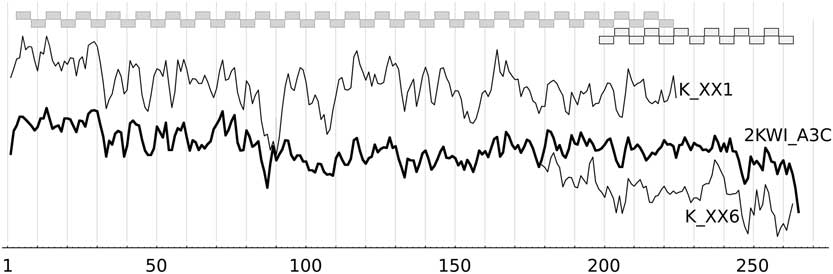
Two trunks, laboratory coded K_XX1 and K_XX6, which did not contain extremely narrow annual increments, were selected for the 14C analysis. The prepared samples consisted of 5 consecutive annual increments each: 44 samples from the trunk K_XX1 and 13 from K_XX6. Five samples encompassing the youngest increments from the trunk K_XX1 overlapped with 5 samples containing the contemporaneous rings from K_XX6 (cf. Figure 2). Samples selected for dating cover period of 260 yr.

Figure 2 Dendrochronological curves of pinewood samples K_XX1 and K_XX6, and mean ring-width curve of the chronology 2KWI_A3C. 44 samples, each containing 5 consecutive annual increments, were prepared from the trunk K_XX1, and 13 similar samples from the trunk K_XX6. Their time intervals are presented above the dendrochronological curves.
Wood Pretreatment for AMS Measurements
The methods of chemical pretreatment of wood for 14C dating, including high accuracy dating, were examined and described by numerous authors (e.g. Hoper et al. Reference Hoper, Mccormac, Hogg, Higham and Head1998; Bird et al. Reference Bird, Ayliffe, Fifield, Turney, Cresswell, Barrows and David1999; Santos et al. Reference Santos, Bird, Pillans, Fifield, Alloway, Chappell, Hausladen and Arneth2001; Anchukaitis et al. Reference Anchukaitis, Evans, Lange, Smith, Leavitt and Schrag2008; Nemec et al. Reference Nemec, Wacker, Hajdas and Gäggeler2010; Southon and Magana Reference Southon and Magana2010; Santos and Ormsby Reference Santos and Ormsby2013; Staff et al. Reference Staff, Reynard, Brock and Bronk Ramsey2014, Wacker et al. Reference Wacker, Güttler, Goll, Hurni, Synal and Walti2014; Hajdas et al. Reference Hajdas, Hendriks, Fontana and Monegato2016; Sookdeo et al. Reference Sookdeo, Wacker, Fahrni, McIntyre, Friedrich, Reinig, Nievergelt, Tegel, Kromer and Büntgen2016). Also, the authors of this article had decided to conduct their own tests, carried out in three Polish laboratories (Gliwice, Kraków, and Poznań). The tests included 3 methods of α-cellulose preparation, 2 methods of holo-cellulose preparation, FTIR spectroscopy, δ13C measurements and interlaboratory comparisons. The detailed description of methodology and results were subject of a separate paper (Michczyńska et al. Reference Michczyńska, Krąpiec, Michczyński, Pawlyta, Barniak, Goslar, Nawrocka, Piotrowska, Szychowska-Krąpiec, Waliszewska and Zborowska2018). The outcome indicated the α-cellulose production as the most suitable preparation method. The α-cellulose extraction was preceded by the mercerization step and the standard ABA treatment. Then, in the bleaching process (with NaClO2 + HCl), the production of holo-cellulose followed (see BABAB method described by Nemec et al. Reference Nemec, Wacker, Hajdas and Gäggeler2010). Finally, strong sodium bases (10% and 17%) and weak (1%) hydrochloric acid were used. In order to avoid the influence of possible interlaboratory shifts, the chemical preparation and graphitization of samples was carried out in one laboratory, the Gliwice Radiocarbon Laboratory. The one exception reported here was sample 206-210, which was used for interlaboratory comparison and for assessment of differences between 14C age for holo- and α-cellulose.
Graphitization
Samples of α-cellulose have been converted to graphite for AMS 14C measurements. The process was performed in automated graphitization system AGE, manufactured by IonPlus™ (Wacker et al. Reference Wacker, Nemec and Bourquin2010). Subsamples of ca. 3 mg of α-cellulose were weighted to tin capsules and combusted in elemental analyzer vario MICRO cube (Elementar™). The CO2 from sample was transferred to graphitization unit and reduced with hydrogen at 580ºC. The graphite was deposited on 2 mg of Fe powder.
Two blank materials were used, coal and subfossil wood (called OLGA). The wood was subjected to the same chemical procedure as unknown samples, while coal was prepared with standard ABA treatment. The blank samples and reference material, Oxalic Acid II (NIST SRM4990C) were combusted and graphitized as described above.
AMS Measurements
AMS measurements were performed in AMS Laboratory in Poznań, which is equipped with two 1.5 SDH-Pelletron Model “Compact Carbon AMS”, ser. no. 003 (Goslar et al. Reference Goslar, Czernik and Goslar2004) and ser. no. 012, produced in 2001 and 2012 by the National Electrostatics Corporation, Middleton, WI, USA. Conventional 14C ages of the analyzed samples were calculated using fractionation-corrected (Stuiver and Polach Reference Stuiver and Polach1977) 14C/12C ratios (basing on simultaneously measured 13C/12C), after their normalization based on 14C/12C measured on modern standard (OxII) and blank samples. All the samples have been analyzed in 3 AMS runs, with 4 OxII and 3–4 background samples measured in a run. To control stability of the spectrometer during the run, each sample underwent 6–7 partial measurements. 1-sigma uncertainty of calculated 14C age was determined using uncertainty implied from counting statistics and standard deviation of mean of partial 14C/12C results, whichever was bigger. Scatter of 14C results obtained on individual modern standards (SDOM better than 16 yr), and standard deviation of blanks measured one long-term period (SD not worse than 0.11 pMC) were included in the uncertainty of calculated 14C ages.
RESULTS
Results of AMS dating are presented in Table 1. Most samples have two lab codes: a GdA- code indicates the graphite production in the Gliwice Radiocarbon Laboratory, while a Poz- code indicates the AMS measurement performed in Poznań Radiocarbon Laboratory. The tests described in another publication (see Michczyńska et al. Reference Michczyńska, Krąpiec, Michczyński, Pawlyta, Barniak, Goslar, Nawrocka, Piotrowska, Szychowska-Krąpiec, Waliszewska and Zborowska2018) proved no significant differences between 14C ages obtained for holo- or α-cellulose prepared from the same sample. Therefore, the results for holo-cellulose (for sample 206-210) are also reported in the Table 1. If several measurements were performed for one sample, the χ2 test value is given. In case of 2 measurements, the t-test value is additionally added. t-test and χ2 test values indicated, in most cases, good reproducibility of the results and allowed the weighted average to be used as a final 14C age.
Table 1 Results of AMS measurements for the Kwiatków sequence. If several measurements were performed for one sample, the χ2 test results are given as a χ2 value per degrees of freedom. In the case of 2 measurements, the t-test value is additionally added. The last column presents the final age values.
* Date excluded from modeling.
In two cases (samples covering tree-rings 51–55, 61–65) statistical tests indicated poor agreement and a simple average was calculated as a final age value. For these samples uncertainty was calculated as standard deviation of mean, multiplied by a Student-Fisher coefficient. These dates were excluded from further analysis. A similar situation was observed for the sample 216-220, but repeated measurements (marked by letter “C” in GdA- code) allowed to indicate the outlier (GdA-5179A; Poz-90497; 11987±53) and exclude it from further analysis.
DISCUSSION
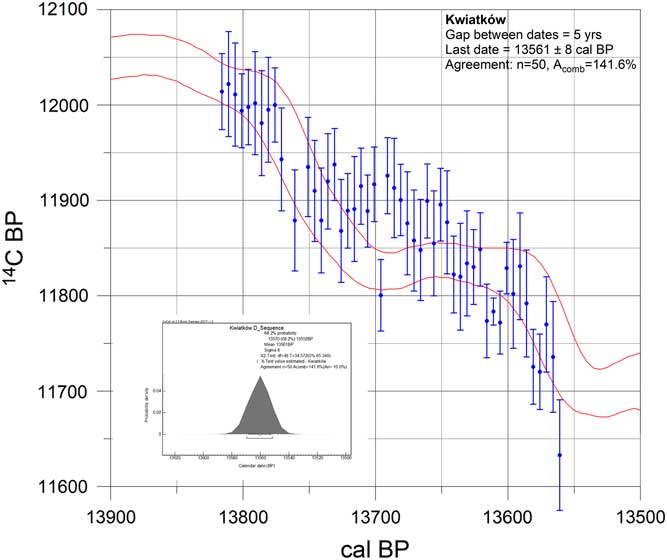
The Kwiatków floating chronology presented above was anchored using the IntCal13 calibration curve. For this purpose the authors used the D_Sequence procedure in the OxCal program (Bronk Ramsey et al. Reference Bronk Ramsey, van der Plicht and Weninger2001). As a result, the Kwiatków floating chronology was affixed to the IntCal13 calibration curve at 13,561 cal BP. The uncertainty of this anchoring resulting solely from D_Sequence algorithm is ±8 yr (1-sigma). The goodness of fit, specified by a combination agreement index was very good (n=50, Acomb=141.6%, An=10.0%). The results of the measurements for the Kwiatków chronology anchored to the IntCal13 calibration curve are shown in Figure 3.

Figure 3 The Kwiatków floating chronology anchored using the IntCal13 calibration curve and D_Sequence procedure in OxCal programme (Bronk Ramsey et al. Reference Bronk Ramsey, van der Plicht and Weninger2001). As a result, the Kwiatków floating chronology was affixed to the IntCal13 calibration curve at 13,561 cal BP with the uncertainty of 8 yr.
Independently, the Kwiatków floating chronology was anchored to the raw data (the Heidelberg tree-ring sequence) using the classical wiggle-matching method based on the χ2 test (Bronk Ramsey et al. Reference Bronk Ramsey, van der Plicht and Weninger2001). For this purpose:
∙ in some cases it was necessary to calculate a weighted average of the two 14C dates for the same calendar date,
∙ both sets of data have been replaced by polygonal chains. Because in the case of data from Heidelberg there is no constant distance between particular points (distance from 0.5 to 21 yr), it was decided to present both series with a resolution of 1 year,
∙ the Kwiatków sequence has been shifted relative the Heidelberg sequence every 1 year and for each position the sum of squares of deviations between the polygonal chains divided by the sum of squares of uncertainty was calculated:
 $$\chi ^{2} {\equals}\mathop{\sum}{{{\left( {y_{{iK}} {\minus}y_{{iH}} } \right)^{2} } \over {u^{2} \left( {y_{{iK}} } \right){\plus}u^{2} \left( {y_{{iH}} } \right)}}} $$
∙ the position of the Kwiatków sequence for which the χ2 test value has the minimum is selected as the best fit of the waveforms.

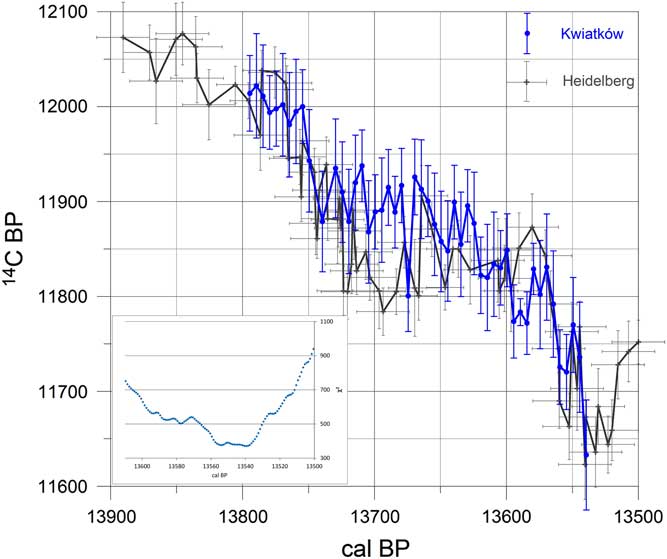
The Kwiatków floating chronology anchored to the Heidelberg tree-ring sequence data is presented in Figure 4. χ2 values around the minimum are presented in the inset. Although the χ2 function has a minimum for 13,540 cal BP, the graph of the value of this function clearly shows that the lowest, similar test values occur for a range of about 20 yr. In fact, there are two minima—one global, anchoring the Kwiatków sequence about 20 yr younger than according to D_Sequence (13,540 cal BP), and the other local one giving anchorage close to D_Sequence (13,554 cal BP).

Figure 4 The best correlation between the Kwiatków floating chronology and the Heidelberg tree-ring sequence data. The χ2 test results around minimum are presented in the inset. The Kwiatków floating chronology was affixed to the Heidelberg data at 13,540 cal BP.
The length of the plateau in the minimum (20 yr) can be a measure of the uncertainty of the anchorage. The values of the test function in the minimum (370.7 and 376.2) indicate that both sequences are not fully compatible with each other. The expected value in the case of full compliance is 257, and the critical value at the confidence level of 5% is 295. Differences between the sequences Kwiatków and Heidelberg are revealed for two periods—about 13,580–13,600 cal BP and 13,680–13,700 cal BP. Small wiggles of both sequences are very similar for the rest of the time period.
Observed differences between chronologies can result from several reasons:
∙ local effects,
∙ 14C dates for Kwiatków chronology were produced for 5 consecutive tree rings, and for Heidelberg data for 10 consecutive tree rings,
∙ different intervals between individual dates. For data from Kwiatków it was a fixed interval of 5 yr (except for 2 dates excluded from modeling; see Table 1), and for data from Heidelbergintervals were variable—from 0.5 yr to 21 yr.
CONCLUSIONS
The constructed Kwiatków chronology was based on a pine tree sequence, 260 yr in length, which covers the period ca. 13,821–13,561 cal BP as fitted to the IntCal13 calibration curve or 13,800–13,540 cal BP as fitted to the Heidelberg data. Dendrochronologically dated wood samples were used to reconstruct changes in the concentration of the 14C isotope in the atmosphere in this part of the Allerød.
The 14C concentration measurements performed by the authors proved that the constructed dendrochronological scale Kwiatków is related to the time interval, when the only record of 14C changes in the atmosphere from terrestrial archives is the series of data for the two floating pine chronologies from southern Germany and Switzerland. The IntCal 13 calibration curve in the time range of 12–14 ka cal BP is based exclusively on the Heidelberg floating tree-ring series (Reimer et al. Reference Reimer, Bard, Bayliss, Beck, Blackwell, Bronk Ramsey, Buck, Cheng, Edwards, Friedrich, Grootes, Guilderson, Haflidason, Hajdas, Hatté, Heaton, Hoffmann, Hogg, Hughen, Kaiser, Kromer, Manning, Niu, Reimer, Richards, Scott, Southon, Staff, Turney and van der Plicht2013, see IntCal13 Supplemental Data, Figures S1–S25). Each new, high-precision 14C concentration change data in the cited time interval, may thus contribute to the refinement of the calibration curve. The presented data show more complex changes of atmospheric 14C concentration compared to the smoothed IntCal13 calibration curve.
ACKNOWLEDGMENTS
Research was funded by the National Science Centre grant No. 2013/09/B/ST10/02249. The authors are grateful to Jakub Michczyński for his help in carrying out the computer calculation required for the wiggle-matching χ2 test.