


I. INTRODUCTION
In situ recovery (ISR) is a unique hydrometallurgical process where an ore deposit remains in place, a lixivant is recirculated through the ore deposit to dissolve a target metal or mineral, and this solution is returned to the surface for processing. ISR provides a low-environmental-impact and low-operating-cost alternative to conventional open-cut and underground mining. From an economic point of view, ISR incurs lower capex and opex costs, which allows for the creation of additional “economic” resources. Environmental disturbance is minimized as no surface comminution is required and there is no production of tailings/solid waste dumps. However, the potential contamination of ground water should be taken seriously when considering ISR application. Readers are referred to more detailed and critical reviews of ISR applications and its environmental impact in the publications of Mudd (Reference Mudd2000a, Reference Mudd2000b, Reference Mudd2001).
The application of ISR at a commercial scale exists mostly for the extraction of uranium from roll-front sandstone deposits (Benes et al., Reference Benes, Boitsov, Fazlullin, Hunter, Mays, Novak, Slezak, Stover, Tweeton and Underhill2001; World Nuclear Association, 2014). Copper ISR is much less established compared with uranium, however, such a technique represents an opportunity to recover low-grade copper ores in existing and new mines under suitable geology and mineralogical conditions (Sinclair and Thompson, Reference Sinclair and Thompson2015). ISR offers great potential for broader application, especially for small deposits, or deposits that are deep and uneconomic to mine because of the cost of traditional mining techniques.
Unlike conventional processing, no standard methodology exists to identify and evaluate the suitability of ore deposits for ISR processing. The aim of this work is to develop a program that includes a range of characterization techniques and leaching tests to understand sample and deposit amenability to ISR processing.
II. METHODS AND MATERIALS
A. Copper mineralogy and processing options
The mineralogy of copper deposits determines to a large degree their leaching mechanisms and extraction rates, and this constrains potential processing options. Copper presents as either oxide forms or relatively more reduced forms, i.e. native copper or copper sulphides. In oxide forms, copper may be present as copper oxides/hydroxides, chlorides/carbonate hydroxides. . Copper in reduced form often exists as primary and secondary sulphides. Understandably, copper in oxide forms is easier to process, and secondary copper sulphides leach more easily compared with primary copper sulphides. A summary of copper species, their relative recovery rates and possible processing options is provided in Table I.
Table I. Summary of copper species, their recovery rate and processing options from Watling (Reference Watling2006).

Copper-oxide ores are suitable for heap leach and ISR processing, secondary copper-sulphide ores are suitable for heap leaching. Examples can be found in the reviews of Watling (Reference Watling2006) and Sinclair and Thompson (Reference Sinclair and Thompson2015). More work is required to understand the suitability of primary and secondary copper-sulphide ores for ISR processing.
B. Ore specimen and drill core sample preparation
An ore specimen of about half a tonne was obtained from a low-grade copper deposit in South Australia. The specimen was cut and polished to expose a flat surface of ~300 mm in diameter. Drill core samples were cut vertically to the polished surface from various locations on the flat surface. Each drill core sample was cut into two to three sections, and the exposed surfaces were polished for further analysis. A photograph of the location of the drill cores at the flat specimen surface and further sectioning of each drill core is illustrated in Figure 1.
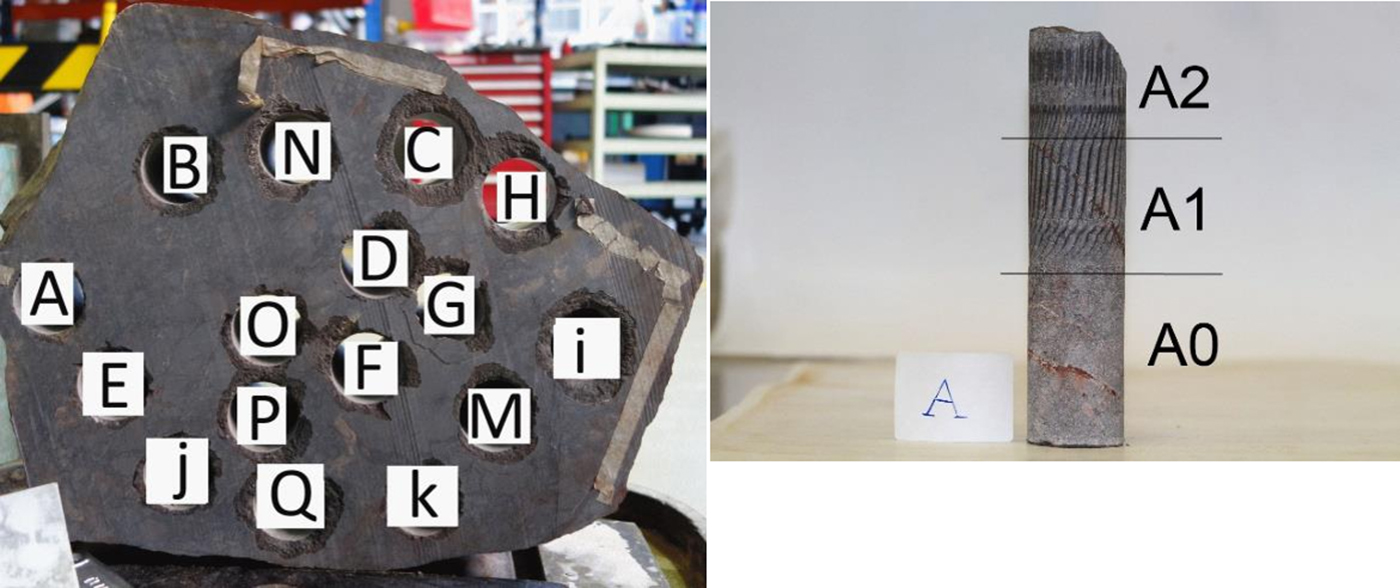
Figure 1. (color online) Photograph of the location of the drill cores at the flat specimen flat surface and sectioning of each drill core.
C. Data collection and analysis
1. X-ray fluorescence mapping
All drill core samples were mapped using micro-X-ray fluorescence (μ-XRF) analysis. This technique allows for the production of elemental maps, which can be used to identify the presence and association of any metals. The instrument used to collect the data was a Bruker M4 TORNADO™ equipped with a rhodium target X-ray tube operating at 50 kV and 500 nA with a XFlash® silicon drift X-ray detector. Maps were created using a 25 µm spot size with dwell times of 10 ms per pixel. Data were processed using Bruker ESPRIT (1.5) software. Maps are represented as unquantified background-corrected peak height data for Kα peaks for each element.
2. Quantitative evaluation of minerals by scanning electron microscopy analysis
One side of the drill-core samples was analysed by quantitative evaluation of minerals by scanning electron microscopy (QEMSCAN, E430 running I discover 5.2) using a CSIRO-developed species identification protocol (SIP). Particle scans were obtained over a period of 1 h.
3. X-ray diffraction (XRD) analysis
Samples for XRD analysis were air-dried, finely ground and back-pressed into conventional XRD sample holders. XRD measurements were carried out using a PANalytical high-resolution multi-purpose powder diffractometer (Empyrean) using Co-Kα radiation and the X-ray tube operating at 45 kV and 40 mA. A Bragg–Brentano high-definition monochromator was placed in the incident beam. A PIXcel3D proton counting X-ray detector was used to collect the data over an angular range of 10°–90° 2θ with a continuous scan mode for 1 h. The qualitative XRD data were interpreted with HighScore Plus (3.04) software using the ICDD database (2011).
Micro-XRD analysis was obtained using the same XRD instrument, where the drill core sample was held in a specially designed sample holder as shown in Figure 2. The holder aligned the sample with its flat upper face parallel to the top of the XYZ sample stage. The sample height was set to the analytical height of the instrument using a dial gauge having an accuracy of 1 µm. Areas selected for analysis from the QEMSCAN data were identified by comparing the image from the instrument camera with the QEMSCAN image.

Figure 2. (color online) Specially designed sample holder to hold drill core samples for micro-XRD analysis.
Data were acquired using CoKα radiation using a 100 µm monocapillary to collimate the X-ray beam. The diffracted beam optics were 0.02R Soller slits and Programmable Antiscatter slits operating in fixed mode with a 1° slit width. A Pixcel array detector was used to collect and analyse the diffracted X-rays. Scans were acquired from 30° to 90° 2θ with a 0.1° step size. Count times were 35 000 s per step (with 255 steps acquired simultaneously) for a total scan time of 23 h.
4. Computed tomography scan
The cores were scanned using the XRADIA XRM 500 high-resolution 3D X-ray microscope system at the Australian Resources Research Centre (ARRC, Kensington, Western Australia). The scanner was set to 160 kV, 10 W, and a voxel size of 13 µm. A total of 2000 projections were recorded over 360° for each sample and were used to reconstruct the three-dimensional volumes. The generated data were processed and analysed using AvizoFire® and CSIRO-developed codes, following methods described by Godel (Reference Godel2013).
5. Leaching experiments
Several selected drill core samples were placed inside 250 ml Nalgene bottles in 200 ml 0.2 M hydrochloric acid containing 0.5 M ferric chloride. The bottles were placed inside an incubator without shaking and kept at 50 °C. A 5 ml sub-solution sample was withdrawn at intervals from the main leach solution, filtered through a 0.45 µm membrane filter, and kept for further elemental analysis.
III. RESULTS AND DISCUSSION
A. XRF mapping
XRF mapping is a relatively low-cost, rapid, and non-invasive technique that was initially applied to determine the copper concentration of the drill core samples. During the mapping process, any elements that were present at detectable levels were recorded to obtain information about the association of certain elements with other elements that are present. XRF mapping was conducted on 37 drill core samples, with the relative copper concentrations as summarized in Table II.
Table II. XRF mapping results, and the relative copper concentrations for 37 drill core samples.
Among the copper-rich samples, copper is commonly associated with sulphur, which suggests the presence of copper sulphide(s), and the association of copper with iron is not clear-cut. An example of this behaviour is evident in Figure 3, which shows the Cu, S, and Fe XRF mapping. There is no evidence of copper association with any other elements other than sulphur. As listed in Table I, several possible copper-sulphide minerals might be present, but further work is required to identify these.

Figure 3. (color online) XRF mapping of Cu (a), S (b), and Fe (c), showing a strong correlation of Cu and S, but no obvious correlation with Fe.
B. QEMSCAN analysis results
QEMSCAN analysis was performed on selected samples with high copper concentrations to identify the copper species. Once copper-rich areas had been identified, a more detailed analysis was performed on selected areas. Figure 4 shows the QEMSCAN analysis results. Areas 1 and 2 indicate where more detailed QEMSCAN analyses were performed.

Figure 4. (color online) QEMSCAN analysis of a drill core sample. Top image: Areas 1 and 2 that indicate where further analyses were performed. Bottom images: QEMSCAN identified minerals in Areas 1 (left) and 2 (right).
QEMSCAN analysis indicates that, for Area 1, chalcocite (Cu2S) is surrounded by iron oxides and quartz. For Area 2, chalcocite is surrounded by iron oxides and bornite (Cu5FeS4). The phases were identified based on a combination of energy-dispersive X-ray spectra of the elements of any selected area. For instance, for the phase to be identified as bornite, Cu, S, and Fe spectra must be present, however, it is unclear whether the Fe spectrum originates from bornite or from the iron oxides.
QEMSCAN-derived elemental mapping from Areas 1 and 2 is illustrated in Figure 5. In Area 1, there is a clear separation between the Cu-containing and Fe-containing minerals. In Area 2, the Cu-containing and Fe-containing minerals are intimately associated, which complicates the identification of the true copper-sulphide species.

Figure 5. (color online) QEMSCAN-derived elemental mapping from surrounding Areas 1 (a) and 2 (b).
C. Bulk and micro-mineralogical analysis by XRD
Powder XRD from a representative bulk sample from the whole specimen (Figure 6) reveals that the sample contains predominantly quartz, moderate amounts of mica-type (muscovite) minerals and low to trace amounts of kaolinite, feldspar minerals, Ti-minerals (anatase and ilmenite), and Fe-oxide (hematite). No copper minerals were identified.
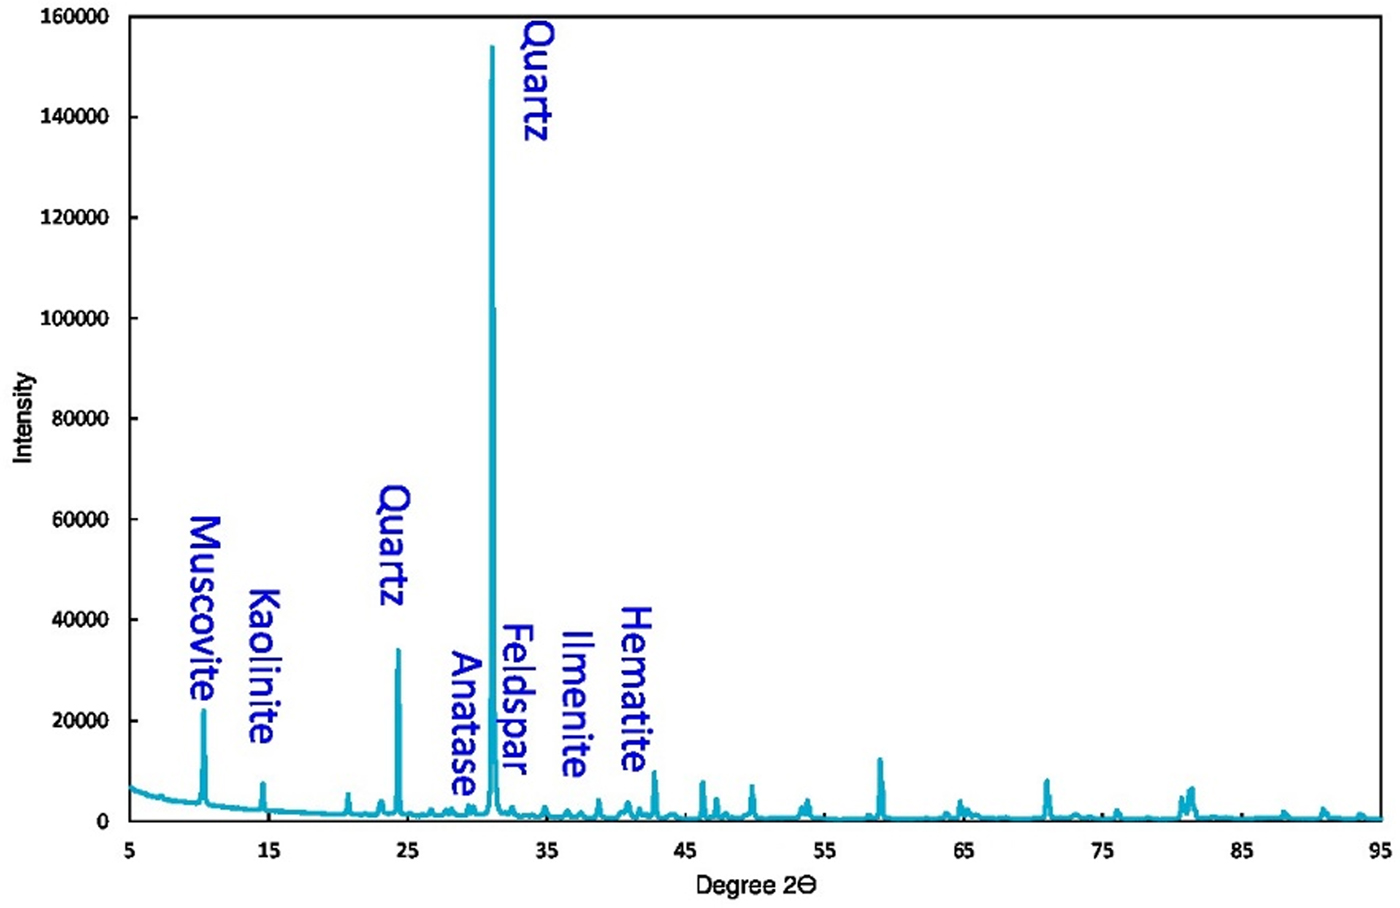
Figure 6. (color online) XRD trace and phase assignment of the bulk sample.
A special sample holder was designed and constructed to hold the drill-core sample (shown previously in Figure 2). XRD traces from selected Areas 1 and 2 as indicated in Figure 5 were recorded. A tetragonal chalcocite (ICSD card no. 98-001-6550 was identified in Area 1, and a hexagonal chalcocite (ICSD card no. 98-005-3329) was identified in Area 2. No other copper species were identified in these areas. This confirms that the copper sulphide presents in the drill core as chalcocite only. Chalcocite is a secondary copper sulphide as indicated by Table II, which is easier to leach compared with primary copper sulphide (Watling, Reference Watling2006).
D. Understanding the copper distribution in the drill core samples by CT scanning
CT scanning was performed on selected copper-rich drill core samples (samples B, J, and P in Table II), to understand the distribution of copper in the drill core samples in three dimensions, and to provide an indication of the accessibility of the copper minerals to lixivant in the ISR environment. The CT scans suggest that some copper is distributed along the cracks (Figure 7(a)), which potentially will allow reagent access. Some drill core samples contain disseminated copper minerals, which means that contact with leach solution is much less likely (Figure 7(b)).

Figure 7. CT scanning image of top and side views of two drill cores showing the copper distribution along a crack (left); disseminated copper distribution (right).
E. Bottle roll leaching of drill core samples
Initial results of the bottle roll leach of the same drill core samples that were subjected to CT scanning show a steady recovery of copper from the drill core samples (see Figure 8). The leaching experiments are ongoing and the copper recoveries will be determined when the copper concentrations in the leached residues are analysed.
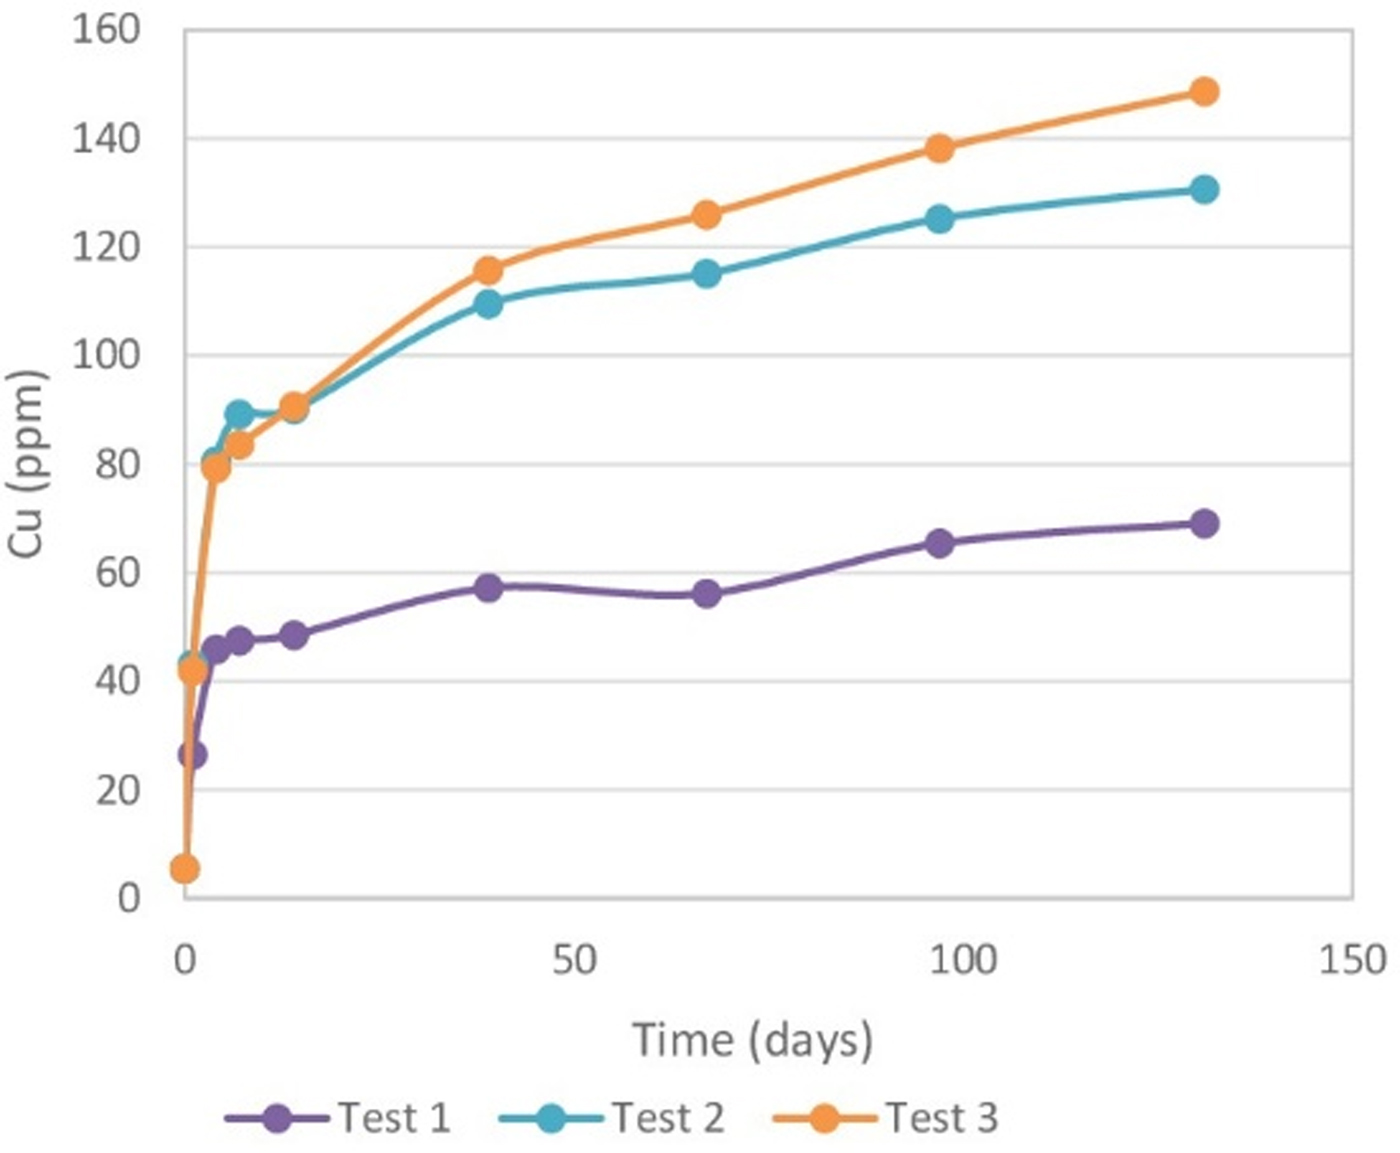
Figure 8. (color online) Copper concentration versus leaching time for selected drill core samples.
IV. CONCLUSION
A range of state-of-the-art characterization techniques have been applied to assess the suitability of a low-grade copper sulphide deposit for ISR. XRF mapping was used to identify zones of higher copper concentration. QEMSCAN and micro-XRD analysis revealed the main speciation of copper as a secondary copper sulphide, which is expected to be more readily leached than primary copper sulphide minerals. CT scanning provides a qualitative visualization of the copper distribution and that the accessibility of copper varies through the ore sample. Preliminary leaching results indicate that copper is recoverable at moderate temperatures that may be expected in situ and with no mixing. The rate of leaching is clearly related to accessibility of the copper sulphide. This preliminary work demonstrates the importance of mineralogical characterization to predict the leaching characteristics of ore by ISR.
Acknowledgements
The authors acknowledge the financial support from CSIRO Mineral Resources for this work, the authors are grateful for the help of James Kear and Dane Kasperczyk for preparing the samples. The authors would like to thank Sophia Surin for the instrumental help of the XRD analysis, Michael Verrall for the instrumental help for the XRF mapping, Belinda Godel for CT scanning analysis of the samples.


