INTRODUCTION
Selection of promising genotypes in a breeding programme is based on various criteria, most importantly final crop yield and its quality. Relationships among yield and yield-contributing traits also play an important role (Diz et al. Reference Diz, Wofford and Schank1994; Gűler et al. Reference Gűler, Adak and Ulukan2001; Mohammadi et al. Reference Mohammadi, Prasanna and Singh2003; Rabiei et al. Reference Rabiei, Valizadeh, Ghareyazie and Moghaddam2004). Selection may also be based on other plant and/or crop features, such as, early maturity (Ahmad et al. Reference Ahmad, Rana and Siddiqui1991), industrial crop yield (e.g. oil yield, Baye & Becker Reference Baye and Becker2005), crop resistance (e.g. Bridge Reference Bridge2000; Singh et al. Reference Singh, Padmaja and Seetharama2004) and yield quality features (e.g. Gravois Reference Gravois1998; Topal et al. Reference Topal, Aydin, Akgűn and Babaoglu2004). Whatever criteria are used, there is always a final trait (e.g. seed yield) or several final traits (e.g. seed yield and quality) to which the most attention is paid. In the present paper, it is assumed that there is just one final trait of study (for the sake of simplicity, this is assumed to be seed yield) and several yield-contributing traits.
To detect traits having influence on a final trait (see all the papers cited previously), i.e. seed yield, path analysis is commonly applied. However, identifying traits determining yield is just the first step of a study; ultimately it is important to select genotypes that deliver maximum yield through optimizing yield-contributing traits. To group the genotypes and, in turn, to find the best group of the genotypes, cluster analysis may be applied.
The question is how to combine results from these two methods. A procedure for this is proposed in the present paper. Modern methodology is applied for both methods, viz. likelihood-based path analysis (Shipley Reference Shipley1997, Reference Shipley2002; Kozak & Kang Reference Kozak and Kang2006; Vargas et al. Reference Vargas, Crossa, Reynolds, Dhungana and Eskridge2007) and model-based cluster analysis (Fraley & Raftery Reference Fraley and Raftery1998, Reference Fraley and Raftery2002).
The paper focuses on selection of grasspea (Lathyrus sativus L.) genotypes with the most promising traits for agriculture purposes. The selected genotypes can constitute a valuable initial material for further selection of high-yielding cultivars in plant breeding programmes. The genus Lathyrus comprises 187 species and subspecies spread over the Old and New World (Allkin et al. Reference Allkin, McFarlane, White, Bisby and Adey1983). Among these, grasspea is the most commonly used for nutrition, in the form of seeds. In Poland, through selection from local grasspea populations and after a series of multi-year field experiments, two promising lines – Derek and Krab – have been registered as original cultivars (Milczak et al. Reference Milczak, Pędziński, Mnichowska, Szwed-Urbaś and Rybiński2001).
Grasspea is superior in yield, protein value, nitrogen fixation, and tolerance to drought, flood and salinity compared to other legume crops. Lathyrus species, including grasspea, have considerable potential in crop rotation, improving physical soil conditions and reducing weed populations and the amount of disease, resulting in an overall reduction of production costs (Vaz Patto et al. Reference Vaz Patto, Skiba, Pang, Ochatt, Lambein and Rubiales2006). Grasspea, which was used in Neolithic times (Lambein & Kuo Reference Lambein, Kuo, Zwierząt and Rolniczego1997), is presently considered a model crop for sustainable agriculture (Vaz Patto et al. Reference Vaz Patto, Skiba, Pang, Ochatt, Lambein and Rubiales2006). However, in addition to the unquestionable advantages mentioned above, grasspea also has several less favourable features, such as strong lodging, indeterminate character of growth, an excessively long period to ripen and seeds that contain anti-nutritional substances (e.g. neurotoxin β-ODAP) (Rybiński & Pokora Reference Rybiński and Pokora2002; Jiao et al. Reference Jiao, Xu, Wang, Li, Li and Wang2006). Hence, one of the conditions for further introduction of grasspea in agriculture is the genetic improvement of these unfavourable characteristics, which may be achieved by mutation induction (Waghmare & Mehra Reference Waghmare and Mehra2000; Rybiński Reference Rybiński2003). This can be a valuable supplement to conventional plant breeding methods and can be used to create additional genetic variability to be used in the development of cultivars for specific purposes or with specific adaptabilities (Campbell et al. Reference Campbell, Mehra, Agrawal, Chen, El Moneim, Khawaja, Yadov, Tay and Araya1994).
The present paper proposes a procedure for determining promising genotypes from among a pool of genotypes, based on applying path and cluster analyses. The procedure may support genotype selection in a classical breeding programme. An application of the procedure is presented for a pool of 22 grasspea genotypes (cultivar Krab and 17 derived mutants and cultivar Derek and three derived mutants). Firstly, the plant traits influencing grasspea seed yield were determined and, having chosen these traits, genotypes possessing a desirable level of these traits and high seed yield were selected.
MATERIALS AND METHODS
Plant material
Material for the study comprised two cultivars of grasspea (L. sativus L.), Derek and Krab, plus 17 mutants derived from the former and three mutants from the latter. The mutants were obtained using helium-neon laser light combined with two chemomutagens, viz., N-nitroso-N-methylurea (MNU) and sodium azide (NaN3). The seeds from plants of M1 progeny were used to obtain the M2 generation, from which the mutated plants were selected. In generation M3, the seeds of those forms selected in M2 were sown together with those of the initial cultivars, to verify the changes observed in generation M2. In the next generation, M4, the chosen genotypes were propagated. The most promising 20 mutants, together with the parent cultivars, were compared in a field trial.
The field trial was arranged in a randomized complete block design with three replications, conducted on the Experimental Field of the Institute of Plant Genetics in Cerekwica, Poland (51°55′N, 17°21′E), in 2002 and 2003. The seeds were sown in experimental plots (1·5×3 m not including the edge rows; including these, the plot size was 1·8×3 m, seed spacing was 300×150 mm). Plant development, lodging resistance and time to flowering and maturity were observed. At harvest, plant height (PH) and yield structure parameters, viz., number of branches/plant (BP), number of pods/plant (PP), height of the lowest pod (HLP), pod length (PL), number of seeds/plant (SP), weight of seeds/plant (WSP) and 1000-seed weight (TSW) were observed. The traits were measured on 15 plants randomly chosen from each replicate plot.
In 2002, weather conditions were normal for Poland. In 2003, however, strong abiotic stress occurred, caused by drought during March, April, May, June, August and September. The sum of rainfall in 2003 from April to the end of June (50·9 mm) was markedly lower when compared with the same period in 2002 (142·8 mm). August 2003 was particularly dry (3·6 mm), in contrast to 2002 (66·4 mm). Average rainfall for the period 1999–2004 was 499·6 mm.
Statistical analysis
Firstly, the normality of distribution of the traits was tested using Shapiro–Wilk's normality test (Shapiro & Wilk Reference Shapiro and Wilk1965). Non-normal traits were transformed using the power (Box-Cox) transformation (Quinn & Keough Reference Quinn and Keough2002) with lambda (λ) parameter assessed at the interval from −2 to 2. The parameters PP (λ=1·9) and SP (λ=0·45) were transformed for 2002, and BP (λ=−0·15) for 2003. Having the variables transformed and normally distributed, it was assumed that the data followed the multivariate normal distribution.
The following procedure was applied to identify the traits that had the strongest influence on, grasspea seed yield, and to select genotypes possessing the selected traits at a desirable level. The procedure was applied for each year independently. Firstly, in order to determine the most important traits influencing seed yield, path analysis, based on a correlation matrix, was applied to the data. For each trait selected into the final model, its overall effect on seed yield was estimated. Secondly, in order to select genotypes that possessed a desirable level of the traits selected using path analysis, model-based cluster analysis was applied with appropriate weighting.
Path analysis
Path analysis estimation and testing was performed using likelihood-based methodology (Shipley Reference Shipley2002). The computation was performed using the SEM library (Fox Reference Fox2006) of the R language (R Development Core Team 2006). The associations were studied in each year independently based on means for each genotype calculated across the replications.
In each year, a final model was sought using the exploratory path analysis (Shipley Reference Shipley1997). Below, the symbol ‘A→B’ is used for a path from trait A to trait B. A model with the paths PL→SP and SP→WSP was chosen to begin. In further model selections, an additional path was added. If this added path was significant and if the χ2-test did not reject the model, the path was kept in the model; if any other path in the model was not significant, it was discarded from the model. The critical P-value for acceptance of a path coefficient and a model was 0·05.
It is commonly known that the development of plant and crop traits is ontogenetic in nature, so traits develop in a sequence during plant ontogeny. For this reason, when seeking the model, it was assumed that the following paths were possible: PH→HLP, BP, PP, PL, SP, TSW and WSP; HLP→BP, PP, PL, SP, TSW and WSP; BP→PP, PL, SP, TSW and WSP; PP→PL, SP, TSW and WSP; PL→SP, TSW and WSP; SP→TSW and WSP; and TSW→WSP. Other paths were not considered.
Cluster analysis
Model-based cluster analysis (Fraley & Raftery Reference Fraley and Raftery1998, Reference Fraley and Raftery2002) was applied to group the genotypes. Only those traits which were important determinants of WSP in both years were included in the analysis: these were PH, BP, PL and SP, as well as WSP. Zero-weights were assigned to the other traits so they played no role in recognizing the data structure. Before the analysis, the traits were standardized to follow the normal distribution with zero mean and variance equal 1. It was assumed that the data constituted a mixture of multinormal densities. After this, weighting traits were applied. To a particular trait, a weight was assigned equal to its overall effect on WSP. To the most important variable, WSP, the weight 1 was assigned.
The model-based clustering was performed using mclust package (Fraley & Raftery Reference Fraley and Raftery2006) of the R language and environment (R Development Core Team 2006). In particular, the clustering was performed via EM algorithm and the optimal number of clusters was estimated according to the Bayesian information criterion (BIC).
RESULTS
Analysis of variance indicated that the main effects of genotype as well as genotype×year interaction were significant for all the traits of study (Rybiński & Bocianowski Reference Rybiński and Bocianowski2006). The differences between the years were large, which was the result of large differences in weather conditions between the two years. Some genotypes had a mean seed yield in 2003 less than half that in 2002.
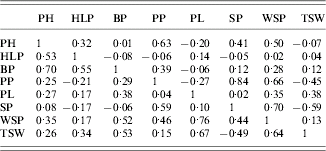
Table 1 shows a correlation matrix for the traits for both years. The correlations differed between years. In 2002, WSP was mainly correlated with BP, PP, PL and SP, whereas in 2003, it was mainly correlated with PH, PP and SP. Interestingly, the correlation between WSP and SP was negative in 2002 but positive in 2003.
Table 1. The correlation matrix for the traits studied (after transformation) for 2002 (below diagonal) and 2003 (above diagonal)
Path analysis
Figure 1 shows the causal models assessed for 2002 (a) and 2003 (b) (values of path coefficients are not shown, only their existence). Both models were highly significant (Table 2). Estimates of path coefficients are presented in Table 3 (for 2002) and Table 4 (for 2003). A path coefficient informs about the direct effect of a trait on the dependent trait. However, because indirect effects also existed, overall effects of the traits on WSP have been presented. An overall effect is a sum of the direct path for the trait on WSP and all the indirect effects leading from the trait to WSP. The overall effects for both years are presented in Table 5.

Fig. 1. Causal models estimated for 2002 (a) and 2003 (b).
Table 2. Details of the models for 2002 and 2003 – χ2-test and its goodness of fit
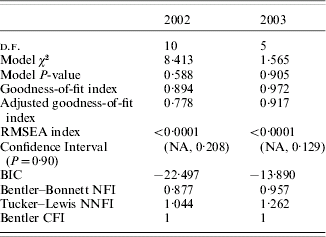
RMSEA=root mean square error of approximation; BIC=Bayesian information criterion; NFI=normed fit index; NNFI=non-normed fit index; CFI=comparative fit index.
Table 3. Coefficients of the model estimated for the traits of study for 2002
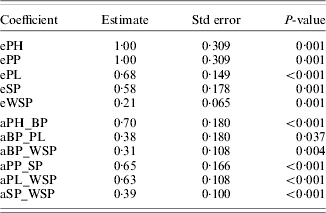
eA=residual variance of trait A.
aA_B=standardized path coefficient from trait A to trait B.
Table 4. Coefficients of the model estimated for the traits of study for 2003
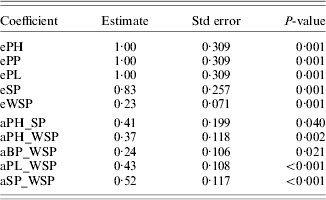
eA=residual variance of trait A.
aA_B=standardized path coefficient from trait A to trait B.
Table 5. Coefficients of overall effects of traits on WSP of grasspea

* x, the corresponding trait had no effect on TSW.
In 2002, WSP was a positive direct effect of PL, SP and BP (in decreasing order of strength of determination). The PH and PP determined WSP indirectly. The largest overall effect on WSP was that of PL (0·63) and BP (0·55); see Table 5. Note that all these traits influenced WSP positively.
The causal mechanism assessed for 2003 was slightly different. The largest direct effect on WSP was that of SP (0·52). The PL, PH and BP also directly influenced WSP positively, but to a smaller extent. The largest overall effect on WSP was detected for PH and, slightly smaller, for SP. Again, all the traits influenced WSP positively. In both years, HLP and TSW did not influence WSP. The PP was a weak indirect (via SP) determiner of WSP in 2002 only; in 2003, PP did not influence WSP. These results suggest that a genotype should possess a high level of WSP, PH, BP, PL and SP to be considered for further selection.
Cluster analysis
Results of cluster analysis are presented in Table 6. For 2002, three clusters were constructed based on the BIC criterion. Cluster 1 comprised three genotypes possessing a desirable, high level of the traits taken to the analysis, viz. PH, BP, PL, SP and WSP (Table 7). In this cluster, cultivar Krab and its two mutants K3 and K64 were grouped. Cluster 2 comprised 14 genotypes derived from Krab together with cultivar Derek, with a moderate level of the traits. In cluster 3, five genotypes with an undesirable, low level of the traits studied were grouped. Interestingly, all three mutants derived from Derek were grouped in this cluster, together with two from Krab.
Table 6. Cluster analysis for PH, BP, PL, SP and WSP in both years. The traits were clustered after standardization, and PH, BP, PL and SP were assigned weights equal to their overall effects on WSP (Table 5)

Table 7. Cluster mean values±s.e. of the traits used to group the data for both years
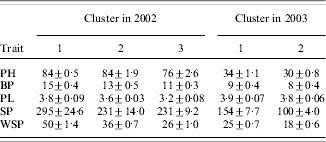
The clustering obtained for 2003 was very different from that for 2002. Two clusters were detected. Eleven genotypes with a desirable, high level of the traits were assigned to cluster 1 and included cv. Derek and its three mutants and cv. Krab and its mutants K3 and K64 and four others. Note again that conditions for plant development were unfavourable in 2003, and yield and other traits were much smaller for 2003 than those for 2002. Therefore, the genotypes that for 2002 were grouped in the ‘best’ cluster and for 2003 in the ‘worst’ cluster might be considered unstable. It means that their reaction on favourable development conditions was positive, but they were not resistant to unfavourable conditions. On the other hand, the genotypes grouped in the best cluster for both years, viz., cultivar Krab and its mutants K3 and K64, can be considered stable. Note that all the genotypes from cluster 1 for 2002 were also grouped in cluster 1 for 2003.
DISCUSSION
For both years, PH, BP, PL and SP were the determinants (all positive) of WSP. The PP determined WSP only in 2002, and HLP and TSW did not influence WSP in both years. However, path analysis studies linear systems (Shipley Reference Shipley2002), whereas the model includes multiplicative seed yield components, such that WSP=SP×TSW (Kozak & Mądry Reference Kozak and Mądry2006). Because of this, TSW was discarded from the final model. This problem has been also underlined by Gozdowski et al. (Reference Gozdowski, Kozak, Kang and Wyszyński2007), who encountered similar problems when applying path analysis to yield-component data.
Model-based cluster analysis based on traits selected (using path analysis) in both years as being important in determining final seed yield, viz., PH, BP, PL and SP. These were weighted proportionally to their overall effect on WSP, to identify the most promising genotypes. These were cultivar Krab and its two mutants, K3 and K64, which had high seed yield, and the traits mentioned were at a near-optimum level. Because the two years of study had very different conditions for plant development, these genotypes might be considered stable.
The difference between a simple clustering of genotypes and the procedure presented in the present paper is noticeable. Cluster analysis applied to all the traits would show grouping structure within the whole data set; this is a classical aim of cluster analysis. However, this is not what needs to be learned for the selection purpose. It is necessary to know which genotypes are the ‘best’ for seed yield and traits affecting seed yield. Therefore, those genotypes with high yield and a desirable level of the traits detected as yield determinants must be selected – the remaining traits play no required role, and thus should not be taken into account in the analysis. This is exactly what the procedure set out in the present paper does. Furthermore, via weighting traits, the importance of traits in finding a grouping structure within the data is proportional to their importance in determining yield.
To compare the results obtained using the proposed procedure and a classical approach to clustering genotypes, the same model-based cluster analysis for all the traits of study, viz., PH, HLP, BP, PP, PL, SP and WSP, was applied. For both years, the BIC criterion showed that the most possible solution was that there was no clustering structure within the data. This probably resulted from the noise inserted by the traits not determining WSP. Alternatively, it is also possible that the traits not determining WSP had a strong clustering structure and that this structure had quite an impact on the final clustering. In such a situation, clustering would be obtained that shows grouping different from that we aim to study. For example, it is not important whether there is any structure in the data subject to HLP, because this trait did not influence seed yield.
The proposed procedure requires a large number of genotypes. Both path and cluster analyses require, as a rule of thumb, not less than 30. However, analyses for 15 or more genotypes are permissible, especially when genotype trait means are estimated across several replications. Furthermore, both methods have distribution assumptions. The likelihood-based path analysis does not work properly if the data do not follow a multivariate normal distribution. If no transformation is effective, the only way is to apply the classical path analysis based on the methodology of Wright (Reference Wright1921), as done by Gozdowski et al. (Reference Gozdowski, Kozak, Kang and Wyszyński2007). However, this situation should not happen when the analysis is done for mean values of the traits estimated across replications, as it was in the present example. If the distribution assumptions in model-based cluster analysis are not met, non-probability approaches to cluster analysis, like hierarchical methods or K-means algorithm, may be applied (for a discussion on such methods see, for example, Everitt et al. Reference Everitt, Landau and Leese2001).
The procedure is applied separately for environments. Therefore, a path diagram and clustering structure for each environment are obtained, and then, in each environment the most promising genotypes are selected. The final stage of the procedure is to select the most promising genotype across the environments. This is done based on the results of cluster analysis applied separately for the environments. The more environments, the more stable genotypes would be selected. Only two environments were considered in the present paper, so selecting the genotypes based on the clustering for the environments was easy and straightforward. However, if there are more environments (say, more than 10), cluster analysis for categorical variables (see, for example, Everitt et al. Reference Everitt, Landau and Leese2001) should be applied to group the genotypes subject to their belonging to clusters for the environments. Such an analysis would show genotypes with high, stable seed yield and yield-contributing traits at a desirable level.
The conclusion from the current work is that the statistical approach proposed in the paper should be useful for plant breeders for identifying traits influencing a trait of final interest (e.g. seed yield) and identifying the most promising genotypes. In the example on grasspea seed yield, one final trait of interest was considered, that is, seed yield. Because the material comprised results for a small pool of grasspea genotypes obtained across two years and one location, the analysis presented should be treated as an example of application of the proposed procedure. The present authors do not claim these results to be of high importance for the breeding of grasspea – instead the aim was to propose the procedure for determination of promising genotypes and to present its application for real data. This approach may provide an interesting insight into plant breeding, and on this basis, plant breeders may acquire useful information on relationships among traits they study and grouping structure among the genotypes they evaluate. Further studies should be focused on how the procedure should be applied when there is more than one trait of final interest (e.g. seed yield and a quality trait). The use of path and cluster analyses would be the same as in the present paper. However, the challenge is then to decide what weights should be assigned to the traits.


