INTRODUCTION
Currently, the combination of photon and electron beams are used separately in the treatment of some tumours, particularly in head and neck or breast.Reference Korevaar, Heijmen, Woudstra, Huizenga and Brahme 1 – Reference Mu, Olofsson, Karlsson, Sjögren and Zackrisson 8 The low penetration depth and high depth–dose gradient of the electron beam means that it is applied for rather superficial tumours.Reference Khan 9 According to advances occurring in the treatment with electron beams, an intensity modulation technique is also now employed.Reference Hogstrom, Antolak, Kudchadker, Ma and Leavitt 10 , Reference Yeboah, Sandison and Moskvin 11 Regarding high depth–dose gradients, electrons are known to be the best options where organs at risk (OARs) are located beyond the therapeutic regions. In addition, for superficial tumours, high-energy electrons can be considered as the optimum beam as the surface dose increases compared with that of photon beams.Reference Khan 9 , Reference Hogstrom and Almond 12
Despite the advantages of electrons in the treatment of superficial tumours and OARs sparing, they have some disadvantages, which should also be considered, as follows: the dependence of the electron dose distribution on flatness of the treatment area’s surface; heterogeneity in the irradiated area; increment of penumbra by depth; reduction of planning target volume (PTV) coverage with depth increment; and lateral electronic dis-equilibrium.Reference Korevaar, Heijmen, Woudstra, Huizenga and Brahme 1 , Reference Mu, Olofsson, Karlsson, Sjögren and Zackrisson 8 , Reference Van Battum and Huizenga 13 , Reference Khaledi, Arbabi and Sardari 14 Accordingly, the reduction of the dependency of electron dose distribution on the heterogeneity of the irradiated area can be achieved by adding a photon field equal to the size of the electron beam field.Reference Korevaar, Heijmen, Woudstra, Huizenga and Brahme 1 , Reference Krayenbuehl, Oertel, Davis and Ciernik 2 , Reference Xiong, Li and Chen 15 Meanwhile, to decrease the dependence of the penumbra on profile measurement depth, a photon field with a similar size to the electron field also can be added or a narrow field of photons with low weighting is added to the edges of the electron field.Reference Korevaar, Heijmen, Woudstra, Huizenga and Brahme 1 , Reference Korevaar, van Vliet, Woudstra, Heijmen and Huizenga 5 , Reference Mosalaei, Karnas, Shah, Van Doodewaard, Foster and Chen 7
A study was conducted by Mu et al.Reference Mu, Olofsson, Karlsson, Sjögren and Zackrisson 8 for optimisation of the dose distribution in PTV and reduction of the dose received by normal tissue. They showed that combining photons and electrons can be used to treat semi-deep tumours. Because of the smaller number of segments in the photon and electron combination method compared with intensity modulated radiotherapy (IMRT), in addition to the higher speed of treatment, the tumour recurrence probability is reduced during each fraction.Reference Mu, Olofsson, Karlsson, Sjögren and Zackrisson 8 Another investigation compared IMRT and the combination of photons and electrons to treat lung tumours.Reference Krayenbuehl, Oertel, Davis and Ciernik 2 The electron energy was between 9 and 16 MeV, and the photon energy was 18 MV. The results demonstrated that the mixed beam dose reaching the OARs was lower than both conventional and IMRT methods. In some other investigationsReference Palma, Sánchez and Salguero 16 , Reference Mueller, Fix and Joosten 17 the optimisation of separately mixed beam has been developed.
Moreover, Eldib et al.Reference Eldib, Jin, Li and Ma 18 studied the possibility of replacing electronic multileaf collimators (eMLC) instead of the current lead cut-outs to mix electron and photon beams separately without an applicator . In these two methods (eMLC versus the cut-outs), the variation of dose delivered to 10% of PTV volume was 1·57%±1·65, while the dose delivered to the 99% of PTV volume changed by 1·08%±0·78. Similar results were obtained for normal tissues such as the lungs. The authors concluded that similar results with a cut-out can be obtained using eMLC, while a patient’s treatment time can be saved.
However, the present work follows the procedure of feasibility of simultaneous production of photon and electron beams by a LINAC, as has previously been reported.Reference Khaledi, Arbabi, Sardari, Mohammadi and Ameri 19 In the previous study, the Monte Carlo (MC) simulation of percentage depth dose (PDD) and beam profile parameters (i.e., X-ray percentage, depth of maximum dose and penumbra) for 16 MeV primary electrons were prepared. Because of the stability of profile penumbra and the special shape of the PDDs in the mixed beam mode, the usefulness of the produced beam for semi-deep targets (such as nasal cavity) was demonstrated. The dose fall-off of simultaneous mixed beam was slower than with the separately mixed beam, and the therapeutic region was 0·8 cm wider than the separately mixed one. Furthermore, the profile of a separately mixed beam had a dentate edge,Reference Korevaar, van Vliet, Woudstra, Heijmen and Huizenga 5 with a 10% higher dose value, in comparison with our work.
In theory, and according to the previous work, the resulting mixed radiation field takes advantage of the finite range of the electron components while using the X-ray components to restore distal and lateral dose fall-off. The purpose of the present work is to produce, measure, and calculate the PDD, profile, output, and energy spectrum of the simultaneous mixed beam.
MATERIALS AND METHODS
In this study, the production of such a simultaneous mixed beam for 16 and 20 MeV primary electrons performed in practice and has been examined by using a nasal phantom and water phantom with film dosimetry, ionisation chamber and MC code. A Varian 2300 CD LINAC (Varian Medical Systems, Palo Alto, CA, USA), has been employed in this study and it was set to operate in 16 or 20 MeV electron modes. The opening of the jaws for 10×10 cm2 electrons applicator at 100 cm source surface distance (SSD) (isocenter) is 14×14 cm2, and the length of applicator is 32 cm.
Dosimetry in a PTW (PTW Freiburg, Freiburg, Germany) MP3 water phantom has been performed for four electron fields with cut-out dimensions of 10×10, 6×6, 5×5 and 4×4 cm2. According to the International Atomic Energy Agency (IAEA) in TRS-398Reference Andreo, Burns and Hohlfeld 20 protocol, parallel plate chambers are preferred for measuring PDD in the electron fields as well as photon fields. Therefore, a PTW Advanced Markus, which has a sensitive volume of 0·02 cm3, was utilised for PDD and output factors of mixed beam and electron measurements. A cylindrical PinPoint 3D dosimeter, Model 31016 (PTW Freiburg, Freiburg, Germany) was used for profiles dosimetry, which has a sensitive volume of 0·016 cm3. Furthermore, a homemade Plexiglas phantom used for film dosimetry in nasal inhomogeneous area by a Kodak EDR2 film and PTW VeriSoft software and subsequently converted optical density to dose level that had been scanned by an Epson Expression 1680 Pro scanner.
For simulation, MC software of MCNPX Ver. 2.6 was run on a Core i5, 4 GB RAM PC. With the help of previous studies,Reference Khaledi, Arbabi, Sardari, Mohammadi and Ameri 19 , Reference Turian, Smith, Bernard, Griem and Chu 21 the geometry of LINAC head was simulated, so that, after drawing the most impressive components and geometrical features of LINAC, including the collimators, primary and secondary scattering foils, and applicator along with water and nasal Plexiglas phantoms in AutoCAD software, the drawing has been imported to MCNPX code. Thickness of the primary scattering foil was considered at 0·5 mm and made of tantalum, and the secondary scattering foil was of aluminium and in the form of a cone with a height of 5 mm and base radius of 20 mm. The jaws’ thickness were 8 cm and made of tungsten; thus the upper surface of the X and Y jaws were 32 and 22 cm from the source, respectively. Moreover, the distance of the electron source from the simulated 50×50×50 cm3 pure water (H2O) phantom was 100 cm. The distance of the primary and secondary scattering foils from the source were 10 and 13 cm, respectively. The libraries used to transport particles inside the phantom were MCLIB04 and EL03. Cut-off energy for electrons and photons was chosen at 0·2 and 0·03 MeV, respectively. The importance of all materials (cells) in the simulation were selected equal to unity (IMP=1).
Setup
Six lead targets (lead layers) with a thickness of 1 and 2 mm and holes diameters of 0·2, 0·3 and 0·5 cm were used for producing the photons and electrons mixed beam (Figure 1a). According to our previous study, to find the optimum characteristics for lead layers, the distance between the holes was 0·9 cm. A frame with a height of 7 cm made of Styrofoam was located below this lead layer (Figure 1b), and two 1-mm thick stuck together steel layers as scattering layers were placed under the frame. One of the steel layers covered the irradiated field and another one with 3×3 cm2 size was placed at the centre of field to reduce the intensity of the transmitted electrons through the lead layer holes (Figures 1c and 1d). The scattering layer is exactly on the entrance window of the applicator, implying that the distance from the source was 63 cm. Because a 7 cm frame separates the scattering layer from the lead layer, the lead layer distance from the source is 56 cm.
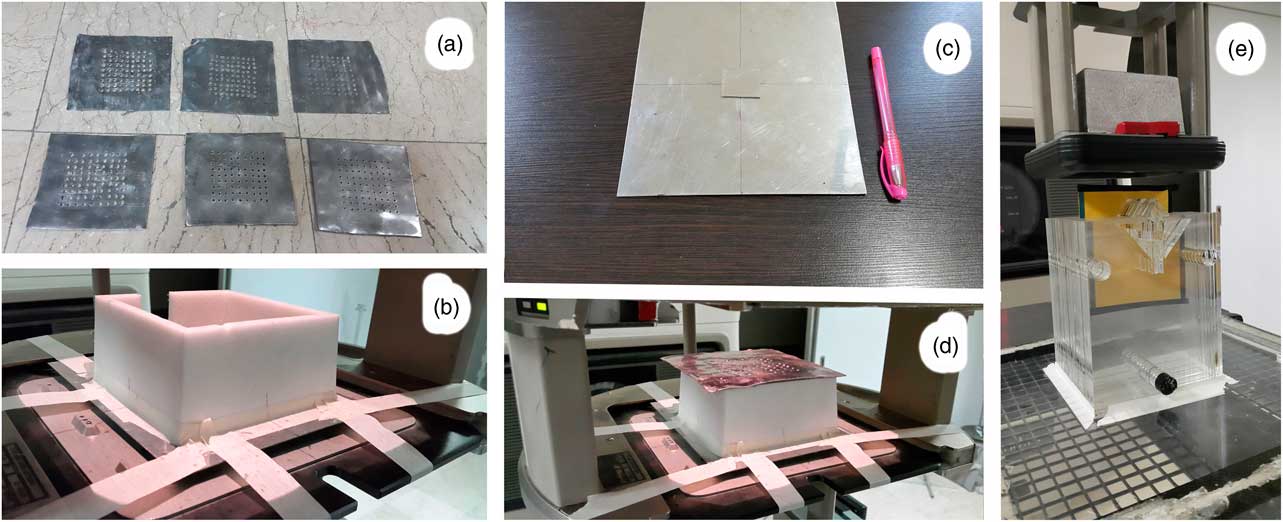
Figure 1 (a) Punched lead layers. (b) Spacer frame placed on the scattering layers. (c) Stuck together scattering layers. (d) Lead layer at the way of the exited electron beam from the linear accelerator. (e) Nasal phantom for film dosimetry, and the thick cut-out at the bottom of the applicator.
The mixed beam was produced using the lead layer. The X-ray part was caused by bremsstrahlung by colliding electrons to lead. The remaining part was to let accelerated electrons pass through the holes.
The ratio of open area (holes) to areas without holes for lead layers with holes diameters of 0·2, 0·3 and 0·5 cm were 3·9, 8·9 and 19·6%, respectively. It should be noted that a high fraction of electrons passes through the holes as well as passes through the lead target, and a smaller portion of them produce bremsstrahlung.
Due to the high-energy photons produced in the lead targets, it was necessary to increase the thickness of cut-outs of applicator to about 8·5 cm, which normally has a thickness of about 2 cm. The reason for choosing this thickness is that 1 half value layer (HVL)+1 tenth value layer (TVL) is generally used in shielding calculations. Because the highest possible energy in a Varian 2300 CD linear accelerator is equal to 18 MV and the amount of TVL and HVL for this energy in lead is 5·7 and 1·8 cm, respectively, as a result, the amount of the required lead is 7·5 cm. On the other hand, taking into account the mass density of lead (11·34 g/cm3) and Cerrobend (9·8 g/cm3), the Cerrobend cut-out thickness will be 8·5 cm.
A clinical target volume (CTV) with dimensions of 3×3·5 cm2 was considered in nasal region of the Plexiglas nasal phantom. The irradiation was performed under a field of 5×5 cm2 by placing each film among the middle slice of nasal phantom at SSD=100 cm.
Measurements
The PDD as well as dose profile in the plane perpendicular to the central axis (CAX) was obtained after producing the mixed photon–electron beam. Profiles were measured at three depths of 1, 3·5 and 7 cm. These are located before, close to, and after the depth of maximum dose (d max). The effective point of measurement by PinPoint has 1 mm difference for electrons and X-rays, but, due to the dominant percentage of electron beam, the effective point for the electron beam was considered.
Film dosimetry in nasal phantom
The Plexiglas phantom of the nasal area was manufactured with consideration to include lack of uniform density in areas with air holes (nasal cavities). After calibration by electron beam, dose distribution in the Plexiglas phantom, which is illustrated in Figure 1e, was obtained.
In order to calibrate the optical density and obtain the calibration curves, calibration films were irradiated with 10–150 cGy doses at intervals of 20 cGy in PTW RW3 water-equivalent solid sheets with a density of 1·05 g/cm3 at the depth of maximum by 9, 12, 16 and 20 MeV electron beams as well as 6 and 18 MV photons. Each of these calibration curves were used for film dosimetry of their respective beam quality. In like manner, the mixed beam film dosimetry calibration was done with 16 and 20 MeV electron beams. The dose distributions in different beam qualities were compared with the use of the γ-index. The amount of distance-to-agreement (DTA) and dose difference (DD) was chosen at 1 mm and 3%, respectively.
The dose homogeneity index (DHI) was computed for the CTV using the following formula:
 $${\rm DHI}{\equals}{{D_{{{\rm max}}} {\rm }-{\rm }D_{{{\rm min}}} } \over {D_{{{\rm pr}}} }}$$
where the D max and D min represent the dose to 1 and 99% of the CTV, respectively, and the D pr is the prescribed dose. The smaller DHI value corresponds to better dose homogeneity in CTV.
Output factor
First, outputs by film dosimetry and Advanced Markus ion chamber using RW3 slabs at the d max for each mixed beam were acquired. Next, the outputs compared with the reference electron field at 10×10 cm2. Due to the high amount of bremsstrahlung contribution, instead of reference depth (Zref), the d max has been used in dosimetry.
Treatment time
A simulation of treatment time, after a ten-fold increment of gun current in service mode, compared with separately mixing of the electron and photon beams. This simulation covered a treatment process including: lead and steel layers insertion, applicator placement and beam-on time, for the simultaneously mixed beam. Moreover, for the separately mixed beam the process composed of the X-ray beam-on time, personnel movement between the operatory room and treatment room, placement of the applicator, as well as the electron beam-on time. In both states, the exposed dose to the d max was 100 cGy. This treatment simulation was repeated ten times.
MC simulation
Because of the specificity of the clinical algorithms such as a pencil beam for calculation of the dose distribution for the purely photon or only electronReference Hogstrom, Mills and Eyer 22 , Reference Mah, Antolak, Scrimger and Battista 23 cases, MC codes can be good options for dosimetry.Reference Reynaert, Van Der Marck and Schaart 24 Accordingly, the CAX from the phantom surface to a depth of 15 cm was divided into cubes of 0·1×0·1×0·1 cm3 to simulate PDD. Also the depths of 1, 3·5 and 7 cm perpendicular to the CAX in the direction of cross plane were divided into cubes with the same dimensions to simulate profiles. Dose amount of each of these cubes make up the constituent points of PDDs and profiles. Mesh tally type 3 was used to estimate the dose in these cubes, which accounts for the energy deposited from all types of particles.
Full width at half maximum and the peak energy of the Gaussian spectrum of 16 MeV electron beam before hitting primary scattering foil were chosen at 0·42 and 17·5 MeV, respectively. Similarly, values of 0·61 and 23·2 MeV were chosen for the 20 MeV energy. These values have been achieved after compliance of measured and simulated PDD curves in a way that the difference of R 50 (the depth of 50% maximum dose) and R P in simulation and measurement in a water phantom was <2%. Furthermore, the lead and scattering layers alter the electron spectrum passing through them, and the peak of beam energy spectrum drops to a lower energy range. Hence, Tally number F2 in the MCNP code was used to get the fluence of electron and photon beams before and after each layer.
The reason for choosing 16 and 20 MeV electrons for this study arises from the initial simulation results, which were aimed at the treatment of semi-deep (about 3±1 cm) tumours. First, a 1 mm target with holes diameter of 0·3 cm was used for comparison of a produced mixed beam by 9, 12, 16 and 20 MeV primary electron beams. Finally, the depth of R 90 (therapeutic range, the depth of 90% dose) was greater than 3 cm only for energies of 16 and 20 MeV.
The lead and steel layers compounds in the simulation were obtained using atomic absorption spectroscopy analysis of these layers in measurement.
RESULTS
Impact on beam spectrum
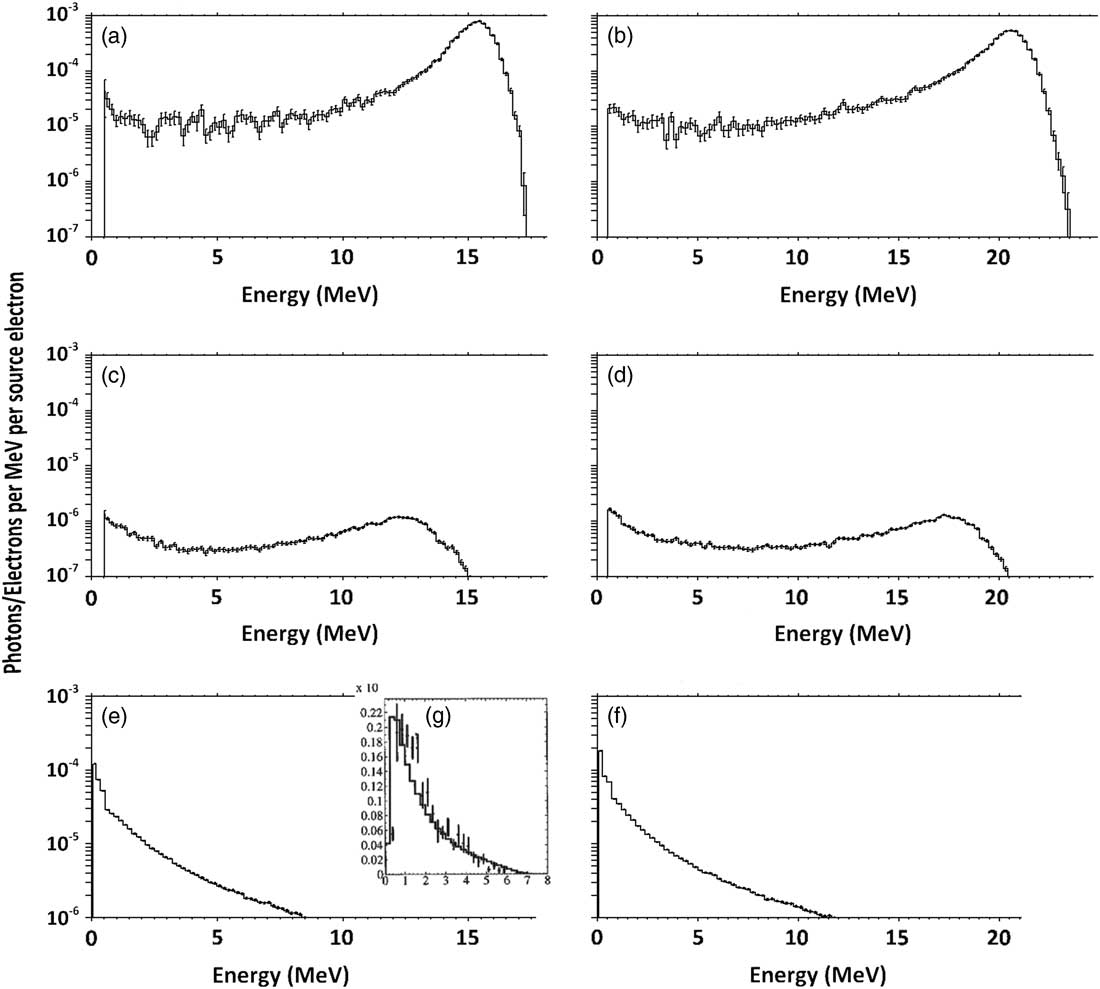
Figures 2a and 2b show the electron spectrum with nominal energy of 16 and 20 MeV before hitting the lead layer. As is determined, peak energy of the Gaussian spectrum is about 16 and 21 MeV, which corresponds to a nominal 16 and 20 MeV electron field’s most probable energy on the surface (E p0) (16·4 and 21·2 MeV, respectively). These spectrum peaks have an intensity of about 100 times higher than the plateau part of the spectrum.

Figure 2 Spectrum of primary (a) 16 MeV and (b) 20 MeV electrons before passing through the lead and scattering layers and spectrum of primary (c) 16 MeV and (d) 20 MeV electrons after passing through these layers. The fluence of produced bremsstrahlung X-ray by the layers, at the phantom surface for (e) 16 MeV and (f) 20 MeV electrons, compared with a sample (g) 6 MV photons.
Consequently, spectra of electrons that pass through the lead layer and scattering layer can be seen in Figures 2c and 2d, which show that the peak energies have been reduced to about 13 and 18 MeV for nominal 16 and 20 MeV electron beams, respectively. The peak also has an intensity of about five times higher than the plateau part of the spectrum. In addition, the spectrum of photons reached the phantom, as shown in Figures 2e and 2f, contains a peak of 0·6 MeV.
Dosimetry in water phantom
The measured and simulated PDDs and profiles for the mixed beams with a primary electron energy of 16 and 20 MeV had a maximum point-by-point difference of 4·6 and 4·9%, respectively. The photon percentage in the simulated mixed beam was higher than what was measured, which can be caused by a difference in the actual ingredients of used alloys in the applicator, cut-outs, and other components. The various lead layers showed a maximum difference of 1·4% between the measured profiles.
Figure 3 shows the measured PDDs for different pure and mixed beams. As was demonstrated in the previous study,Reference Khaledi, Arbabi, Sardari, Mohammadi and Ameri 19 the surface dose and dose gradient of the mixed beam is between the pure photon and electron beams. The X-ray tail of the mixed beams with 16 and 20 MeV primary electrons for the same lead target has only a 4% difference, although the dose difference in the gradient region (3–8 cm) is 23%. Their surface doses are equal but have a maximum 5% difference in comparison with 20 MeV pure electron beam.
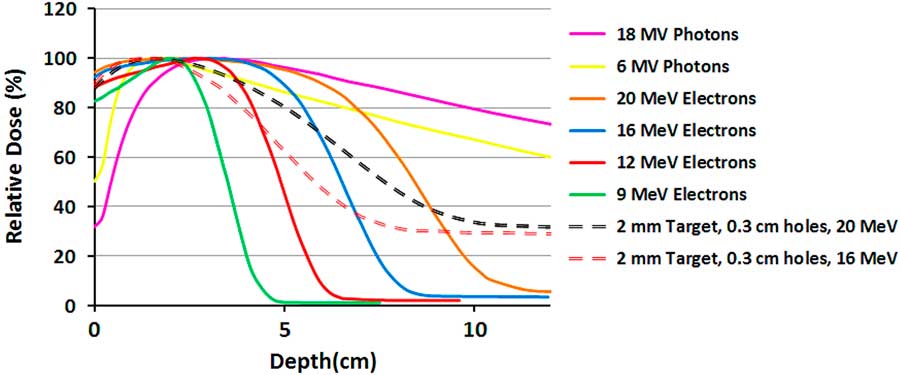
Figure 3 The measured percentage depth dose (PDD) curves of 10×10 cm2 field size for pure electron and photon beams and two mixed beams with different primary electron energies.
The measured and simulated PDDs and profiles for two specific field sizes are illustrated in Figures 4a and 4b. In Figure 4a, the PDDs of 10×10 cm2 field size for each energy, from the surface toward the R 50, a maximum difference of 1·7% is available between the measurement and simulation. Nevertheless, after the R 50, because of the different contribution of bremsstrahlung X-ray, the tails of the PDD curves have been separated and the difference between measurement and simulation raises to 2·9%. Also in Figure 4b, the measured and simulated mixed beam profiles of 4×4 cm2 field size for various depths and primary electron energies have 3·3–3·8% maximum difference. These differences have been observed in the off-axis distances greater than 3 cm.
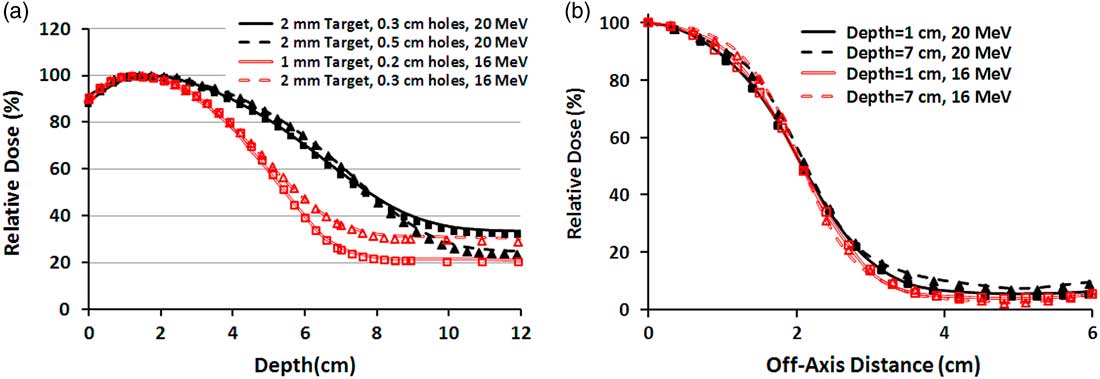
Figure 4 (a) Percentage depth dose (PDD) curves of four different mixed beams produced by 16 and 20 MeV electrons for 10×10 cm2 field size. The lines and markers correspond to Monte Carlo and measurement, respectively. (b) Beam profiles of 4×4 cm2 field size for two mixed beams produced by 16 and 20 MeV primary electrons. Both PDDs and profiles correspond to the mixed beam produced by lead layer with the thickness of 2 mm and holes diameter of 0·3 cm.
Film dosimetry
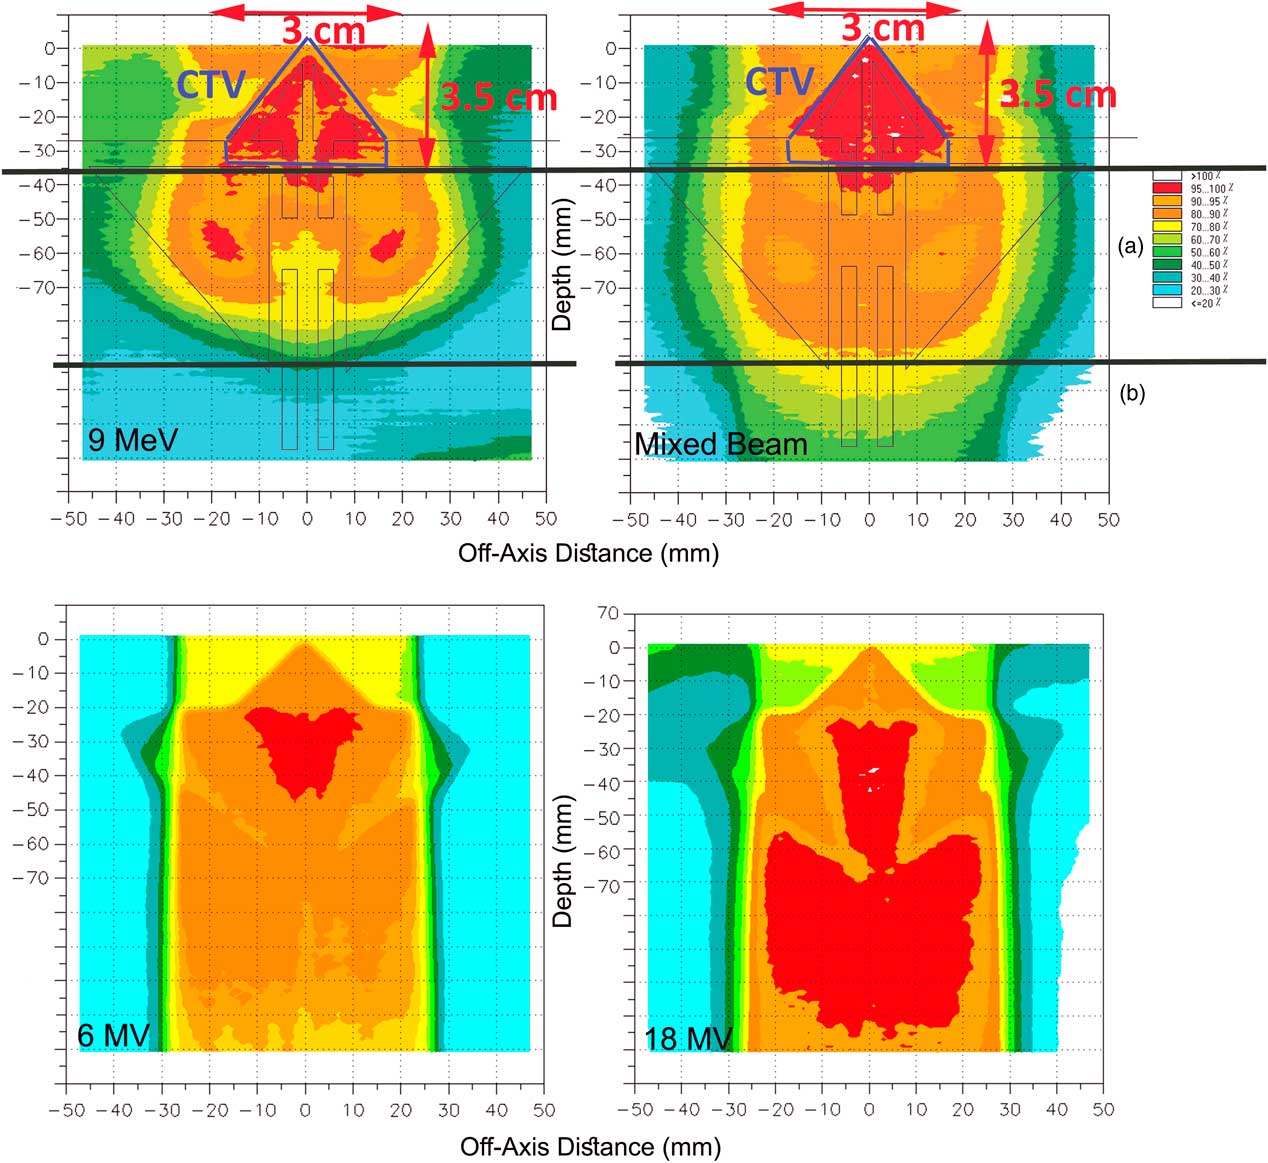
In Figure 5, the isodoses in CTV represent the coverage in therapeutic target area, and region a represents the dose received by the normal tissues (ethmoid sinus area), and region b represents the dose transmitted to the normal tissues beyond of ethmoid sinus.

Figure 5 (a) The assumed clinical target volume (CTV) in the nasal area and the isodoses in the regions of CTV and (b) for pure 9 MeV electron beam and the mixed beam produced by 16 MeV electron and target of 2-mm thickness and 0·3 cm of holes diameter. The poor coverage of CTV and high-dose delivery to outside of CTV is obvious for 6 MV and 18 MV photons.
According to the comparisons between the mixed beams produced by different lead layers, four combinations had the best 90–100% isodose coverage in the CTV. They are mixed beam with the initial electron energy of 16 MeV with a target thickness of 1 and 2 mm and holes diameters of 0·2 and 0·3 cm, respectively, and with the initial electron energy of 20 MeV with 2 mm target thickness and holes diameters of 0·3 and 0·5 cm.
As illustrated in Figure 5, the 9 MeV electrons has delivered 80–100% isodoses into the ethmoid sinus. Similarly for 6 and 18 MV photons, 90–100% isodoses have been available in the posterior of the ethmoid sinus (region b). Also the γ-index was out of the allowable range of 1 mm/3% DTA/DD with a 90% passing rate in the nasal septum in comparison with the mixed beam. Meanwhile, by normalisation of dose levels in the pure electron mode, to achieve a coverage of 95–100% isodoses in CTV, up to 110% dose increase appeared inside and outside of the CTV. Furthermore, in Figure 5, the DHI of CTV for a 9 MeV electron, mixed beam, 6 and 18 MV photons were 0·3, 0·07, 0·44 and 0·52, respectively.
The dose–area histogram (DAH) was achieved for three regions of CTV, a and b for quantitative analysis of coverage in the three desired areas by film dosimetry (Figure 6). The selected mixed beam had a 7% more coverage of CTV by 95% isodose, in comparison with 9 MeV electron beam. Moreover, for the selected mixed beam the 40 and 80% isodoses reached 7 and 9% lesser area of the region a. In the region b; the 40% isodose extension was same for the mixed beam and pure electron beam. Nevertheless, the 80% isodose by the mixed beam covered a 15% more area of this region.
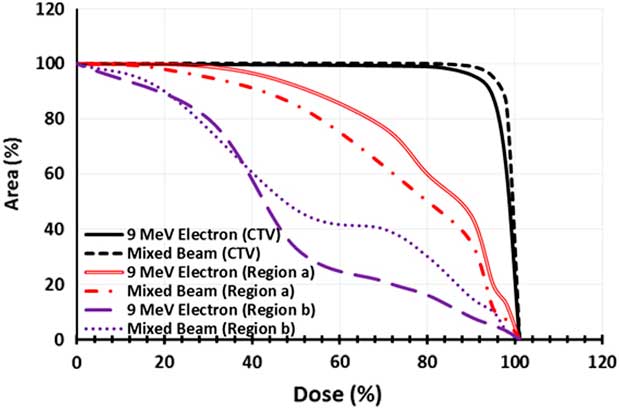
Figure 6 Dose–area histogram of the clinical target volume (CTV), region a and region b for pure 9 MeV electron beam and the mixed beam produced by 16 MeV electron and target of 2-mm thickness and 0·3 cm of holes diameter.
DISCUSSION
According to Figure 2g, the photon spectrum part of the mixed beam obtained in our study was similar to energy of 6 MV in the literature.Reference Sheikh-Bagheri and Rogers 25 Consequently, PDD curves obtained in the current study for the mixed beam were similar to energy of 6 MV in terms of d max of 1·5 cm.
As the simulated and measured PDDs and beam profiles showed in Figure 4a, the R 90, R 50 and R P have been increased, and R P′ (extended practical range) has been decreased by increase of the holes diameters (due to the reduction of the percentage of produced photons). At the same time, reduction of photon percentage in the mixed beam, produced by lead layers with larger holes diameters, has reduced the level of the PDD’s tail (the background X-ray) as well as the R P′. In addition, the slight percentage changes of profile parameters by depth is arisen from the effect of more photon percentage at the deeper depth, where the electron beam profile tends to bulge outward and widens.
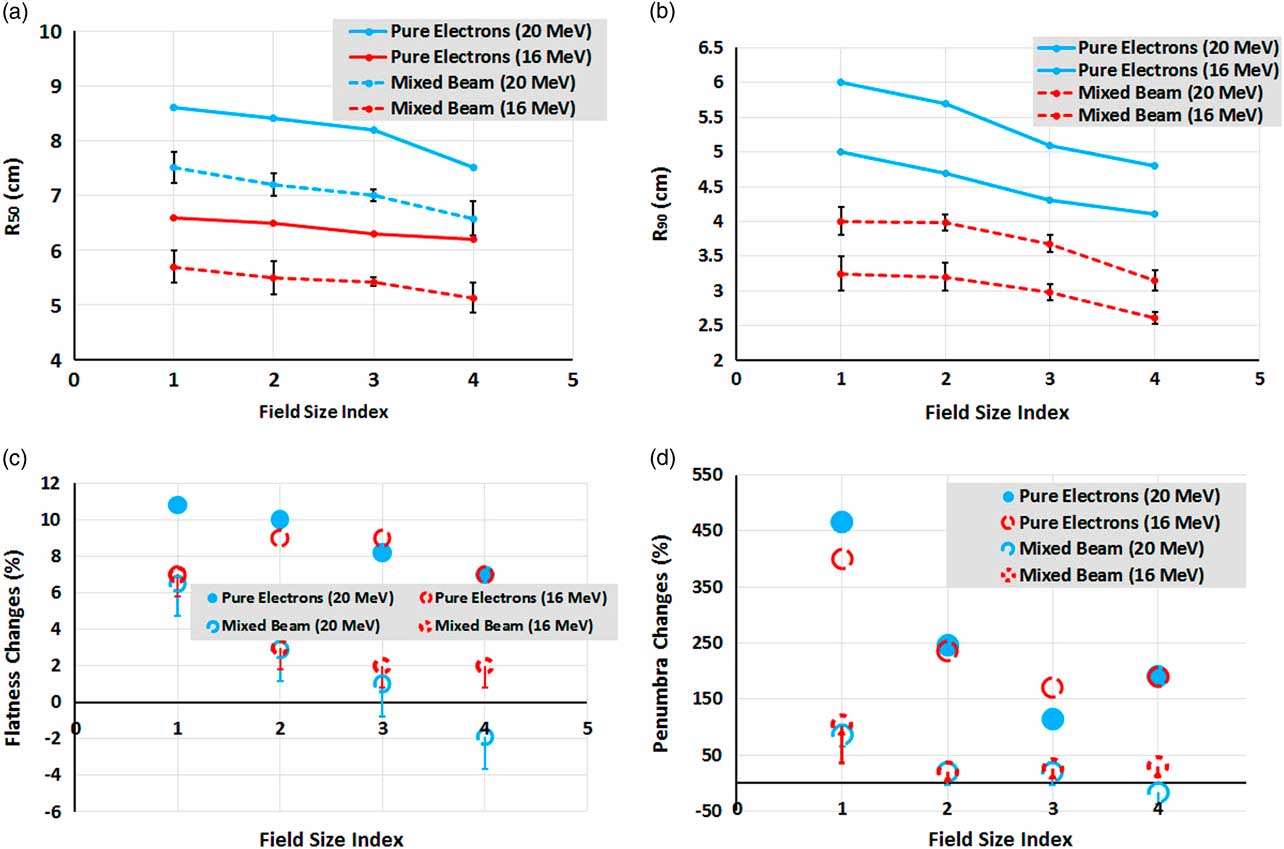
As can be seen in Figures 7a and 7b, the trend slope of R 50 and R 90 variations for the mixed beam and pure electron beam are similar for various field sizes. It means one can say that the effects of the mixed beam on PDD parameters changes for small fields are insignificant.

Figure 7 (a, b) Comparison between changes of mean R 50 and R 90 for mixed beam and pure electron beams, as a function of field size. (c) Flatness and (d) penumbra percentage changes between 1 and 7 cm depths’ profiles as a function of field size for mixed beam and pure electrons. The field size indexes of 1, 2, 3 and 4 correspond to 10×10, 6×6, 5×5 and 4×4 cm2, respectively.
As indicated in Figures 7c and 7d, the percentage changes of flatness and penumbra between 1 and 7 cm depths’ profiles as a function of field size for the mixed beam are far less than that of pure electrons. Flatness and penumbra have even been reduced in the energy of 20 MeV and field size of 4×4 cm2, implying the improvement of penumbra at the depth of 7 cm for the mixed beam. It should be noted that the brought values in Figures 7c and 7d are maximum possible values; therefore, the worst cases have been compared with those of pure electrons.
The long tails of mixed beam PDDs cause the expansion of 60–70% isodoses at the posterior of CTV region (Figure 5), but, regarding the CTV coverage, the prescribed dose, and phase of treatment (boost or regional phases) may be neglected at the cost of better CTV coverage.
The mixed beams with a primary electron energy of 20 MeV and a lead layers thickness of 2 mm and holes diameters of 0·3 and 0·5 cm had similar coverage in 98% of points of the nasal phantom. Furthermore, they failed to cover 90% of nasal septum by 95–100% isodose. In contrast, both of the mixed beams with 16 MeV primary electrons were done. The isodose of 60–70% by the mixed beam with 16 MeV primary electrons, a lead layer of 1 mm and holes diameter of 0·2 cm has covered 11 cm depth of nasal phantom, which was 11·5 cm for the mixed beam with a primary electron energy of 16 MeV and lead layer thickness of 2 mm and a holes diameter of 0·3 cm. However, this priority in sparing of the region b can be neglected due to the 18% higher γ-index passing rate in the area of CTV. Therefore, the mixed beam produced by 16 MeV primary electrons with a lead layer of 2 mm and holes diameter of 0·3 cm can be considered as the best mode due to the better coverage in CTV as well as the less delivered dose to outside of the CTV.
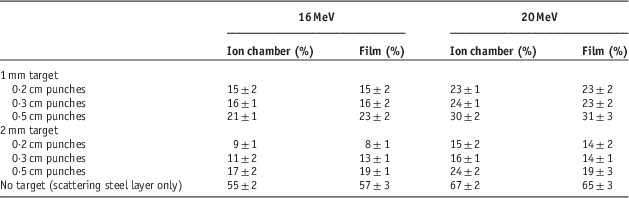
The results for output factors are shown in Table 1. As is clear from this table, mixed beam production layers (lead and steel layers) have reduced the output value to 8–67%. This reduction in output might be compensated by increase of the gun current. Because the LINAC’s gun current for electron mode is ten times of photon mode, the gun current is increasable when needed in service mode. After the increment of the gun current, the simulated treatment time for the simultaneous and separately mixed beams were 180±11 and 290±25 seconds, respectively. The overall shorter treatment time in each fraction leads to better intra-fractional tumour control.Reference Hu, Xu, Li, Zhang, Housley and Ye 26
Table 1 Output factor comparisons of a mixed beam by film dosimetry and ion chamber for 10×10 cm2 field relative to pure electron beam
As seen in Figures 5 and 6, the mixed beam is a better option in CTV coverage and sparing the Ethmoid sinus, but the isodose levels (>40%) that are reached to the posterior area of Ethmoid sinus (region b) were higher than in pure electrons. The CTV coverage of 95% isodose for the mixed beam was 7% greater than the pure electron, but the mixed beam showed better surface coverage. As a result, when using a mixed beam field, applying a bolus might not be necessary.
In a study by Mu et al.,Reference Mu, Olofsson, Karlsson, Sjögren and Zackrisson 8 most plans related to a mixed beam have more priority than IMRT in terms of dose reached to the spinal cord in treatment plans for parotid cancer. Although we cannot compare their research and the present study directly, the doses that reached the ethmoid sinus area for the mixed beam were less than that of pure electron.
In Korevaar et al.’s study,Reference Korevaar, Heijmen, Woudstra, Huizenga and Brahme 1 25 MV photons were used in combination with 40 MeV electrons at a ratio of 20 to 80% to improve the penumbra. The value of 90/50% penumbra in the range of 2–12 cm depth was equal to 0·75±0·05 cm, which is similar to 25 MV photon. The authors performed their measurements for two fields of 10×10 and 5×5 cm2. In another study, which was carried out by the same authors,Reference Korevaar, van Vliet, Woudstra, Heijmen and Huizenga 5 the penumbra at a depth of 10 cm was 2·5 times higher than what was obtained at the depth of 1 cm, which was about five times for a pure electron field. Despite the improvement in the penumbra, the flatness had become worse, so that an indentations had arisen on the edge of profiles. Also a hot spot of 106 and 110% appeared in the mixed beam, as reported by the authors. According to Figures 7c and 7d, we can perceive that the absolute amount and flatness percentage changes in the present study were lower than the mixed beam produced by Korevaar et al. As previously mentioned, because of different energies and techniques, direct quantitative comparison between our study and theirs is not suitable.
Mueller et al.,Reference Mueller, Fix and Joosten 17 found that the combination of electron and photon beams for a superficial tumour (squamous cell carcinoma) has superiority over the pure electron and photon beams. The mean dose delivered to ipsilateral cochlea, as an OAR, was 15·4 Gy for mixed beam which were 19·1 and 24 Gy for IMRT and VMAT in their research, respectively. Because of the adjacent place of ipsilateral cochlea related to the CTV, it can be compared with the region a in the current study, that receives 9% less dose than pure 9 MeV electrons. A similar study by Renaud et al.,Reference Renaud, Serban and Seuntjens 27 demonstrated that the combination of electron and photon beams spared high or similar to the IMRT plan with a lower cost function value, that was due to the lower apertures numbers.
Two methods of helical tomotherapy and IMRT are compared with a mixed beam of 6 MV photons and 16 MeV electrons by Blasi et al.Reference Blasi, Fontenot, Fields, Gibbons and Hogstrom 28 The authors used photons and electrons sequentially. In one of their plans (1:4 IMRT-electron weighting), the IMRT compensates for the heterogeneities in the dose obtained by the electron field (electron dose taken into account during IMRT optimisation). The main problem is obviously the precision of delivery, as the patient can move in between. This would not be the case when combining electrons and photons simultaneously. The DHI for our selected simultaneous mixed beam (16 MeV electron and target of 2-mm thickness and 0·3 cm of holes diameter) was equal to tomotherapy (0·07) in their study. The DHI of CTV for 1:4 IMRT-electron weighting in Blasi et al.’s study was 0·1. It means that using the photon complement in our study provides the same homogeneity as a tomotherapy and better than IMRT complement. This has been arisen from the less sensitivity of photons to heterogeneity and less dose uniformity in most IMRT plans.Reference Arbea, Ramos, Martínez-Monge, Moreno and Aristu 29 In their study, the dose of 25 Gy (38%) for the mixed beam was expanded to the posterior of the ethmoid sinus, and a dose of 5 Gy (8%) was close to the brain stem, which was about 20% for corresponding depth in our study. As the photon component adds an undesirable dose at larger depths, combining several directions should be considered. In the author’s research, the DVH of PTV coverage and left eye sparing showed the priority of a mixed beam. But, for the left eye lens, the priority was with the other methods. That is similar to our study in the manner that the mixed beam had created better coverage in CTV, and a lower dose was reached by mixed beam to the ethmoid sinus, but a higher dose had been delivered to the posterior area of the ethmoid sinus by the mixed beam. In addition, the authors used a bolus of 0·5 cm for this area to create better coverage to the target volume; this is due to a combination of a 6 MV photon and electron with low surface dose; thereupon, the mixed beam surface dose was less than the surface dose of our study’s mixed beam.
Because of the employment of electron beam as the initial radiation to produce the bremsstrahlung X-ray, there is a limitation in using of the presented simultaneous mixed beam for regions that need longer distance between body and the applicator (neck and shoulder, for instance). In these cases the short applicator may be used. In addition, as mentioned previously, to reduce to the out-field scattered photons to an acceptable amount, an 8·5 cut-out (block) was used. This block needs a mounting device to fix the block while the gantry is rotating. Moreover, although the mixed beam benefits from the associated photon part to overcome some pure electron beam’s disadvantages, but it leads to a long tail of the mixed beams PDDs as well, which its isodoses appeared in the region b.
CONCLUSION
The various mixed beams produced in this study were almost similar in terms of the profile differences such as the penumbra and flatness and overall shape of profile, but the main differences were in the percentage of their photon and PDD properties. The changes of PDD parameters compared for small fields did not show a significant capability. On the other hand, the profile parameters for small fields were even better than those of the reference field. Finally, a mixed beam with a primary electron energy of 16 MeV with a thickness of 2 mm and punches diameter of 0·3 cm showed a better result in terms of penumbra percentage changes by depth in comparison with other produced mixed beams. As the slight differences in the PDDs of pure electron energies make different applications in clinics for them; thus the mixed beam with new and different physical properties might be used in the other treatment cases and situations. In addition, as observed from DAHs, CTV coverage was better than in the conventional method for the case of a nasal cavity, and, compared with previous studies, the dose delivered to CTV and normal tissues was similar. At the same time, the isodoses’ bulges were lower than in conventional methods, which is considered a positive point due to the lower doses reached to the adjacent normal tissues (such as the optic nerve).
In the future generations of flattening filter-free LINACs, the mixed beam can be produced by using eMLC and perforating the target from the inspiration from this study. This makes an absolute reduction in the penumbra due to increased target distance to the phantom (or body surface), and shrinkage of the LINAC head target dimension. This causes decrease of setup error due to the elimination of add-on changes and replacements, such as the applicator, between the electron and photon modes. As a result, the treatment time will be shorter, and the risk of tumour cell recovery will be smaller than separately mixing the photons and electrons.
Acknowledgements
None.
Financial support
This work was supported by Clinical Research and Development Center, Imam Hossein Hospital, Shahid Beheshti University of Medical Science, Tehran, Iran (grant number 7481).