Introduction
In the long course of Earth's biological evolution, several astrophysical phenomena might have delivered important doses of high energy muons on the planet's surface (Dar et al. Reference Dar, Laor and Shaviv1998; Atri & Melott Reference Atri and Melott2011). Most studies acknowledge the high penetration power of these muons, quoting that they can travel hundreds of meters through the ocean water column. However, the investigation of biological damage of muons on ocean phytoplankton is yet to be conducted. Therefore, in this paper we present the diminution on phytoplankton photosynthesis that a flux of high energy muons would perform. We examine the scenario of the extragalactic shock model, according to which Earth receives an enhanced dose of high-energy cosmic rays when it is at the galactic north (Atri & Melott Reference Atri and Melott2011).
Materials and methods
The so called E model for photosynthesis (Fritz et al. Reference Fritz, Neale, Davis and Peloquin2008), which uses irradiances E instead of fluences H, allows calculating the photosynthesis rate P and depth z in the ocean, normalized to the maximum possible photosynthesis rate P S:
where E PAR(z) is the irradiance of photosynthetically active radiation (PAR) at depth z, ![]() $E_{{\rm UV}}^* (z)$ is the irradiance of (inhibitory) ultraviolet radiation at depth z, convolved with a biological spectrum (the reason for the asterisk), and E S is a parameter accounting for the efficiency of the species in the use of PAR. In this work, we do not consider the effect of enhanced solar ultraviolet irradiation due to potential depletion of the ozone layer when Earth is at the galactic north. Concerning radiation damage, this would be a minor effect compared with the influence of muons (Melott et al. Reference Melott, Atri, Thomas, Medvedev, Wilson and Murray2010). Thus, we assume current annual ground level average of solar irradiation at three different latitudes (0°, 30° and 60°) and then propagate this spectrum down the water column, using Lambert–Beer's law of Optics:
$E_{{\rm UV}}^* (z)$ is the irradiance of (inhibitory) ultraviolet radiation at depth z, convolved with a biological spectrum (the reason for the asterisk), and E S is a parameter accounting for the efficiency of the species in the use of PAR. In this work, we do not consider the effect of enhanced solar ultraviolet irradiation due to potential depletion of the ozone layer when Earth is at the galactic north. Concerning radiation damage, this would be a minor effect compared with the influence of muons (Melott et al. Reference Melott, Atri, Thomas, Medvedev, Wilson and Murray2010). Thus, we assume current annual ground level average of solar irradiation at three different latitudes (0°, 30° and 60°) and then propagate this spectrum down the water column, using Lambert–Beer's law of Optics:
In the above expression, the attenuation coefficients K(λ) define the optical ocean water type (Peñate et al. Reference Peñate, Martín, Cárdenas and Agustí2010). Irradiances E(λ,0−) just below the water surface are obtained after subtracting the reflected light:
where R is the reflection coefficient (calculated with the Fresnel formulae), and E(λ,0+) are spectral irradiances just above the water surface.
Total irradiances are obtained through:
with ε(λ) being the biological action spectrum for photosynthesis inhibition under the action of ultraviolet radiation. For the latitude 60°, we use the same action spectrum as in Cockell (Reference Cockell2000). For the latitudes 0° and 30°, we use a biological action spectrum more adequate for temperate phytoplankton (Avila et al. Reference Avila, Cardenas and Martin2013). In general, biological action spectra quantify the biological effects of electromagnetic radiation, giving more weight to more harmful wavelengths. In the case of the ultraviolet bands considered in this work (UV-B: from 280 to 320 nm, and UV-A: from 320 to 400 nm), the values of the spectrum are higher for the former, not only because of more energetic photons, but also due to increased quantum absorption probabilities.
The E model for photosynthesis (equation (1)) was developed and tested under the ordinary background of ionizing radiation on current Earth. To account for important fluctuations of ionizing radiations we modify it
where f ir (z) is some sort of normalized dose of absorbed ionizing radiation at ocean depth z. In this work, we focus on a scenario in which muons are the dominant contribution to biological damage, due to their high penetration power on ocean water. Studies on biological damage of muons on non-human samples are scarce (Atri & Melott Reference Atri and Melott2011). However, some studies suggest that doses are proportional to the overall muon flux, and that the fluence-to-dose factor has little variation with energy (Ferrari et al. Reference Ferrari, Pelliccioni and Pillon1997; Pelliccioni Reference Pelliccioni2000; Chen Reference Chen2006; Sato et al. Reference Sato, Endo and Niita2011). In particular, Fig. 2 of Sato et al. (Reference Sato, Endo and Niita2011) shows that effective dose conversion coefficients for high energy muons (energy range 102–105 MeV) have a very soft dependence with muon energy. References mentioned in this paragraph led us to accept, as in Atri & Melott (Reference Atri and Melott2011), the ansatz that for the case or irradiation with high energy muons, enhanced dose D enh at Earth's ground would be proportional to enhanced muon flux F enh:
The subscript n refers to respective magnitudes during the ordinary radiation regime. We then propose the normalized dose f ir(0) of ionizing radiation at ground level:
In this work, we consider f ir(z) constant down the water column. The reasons for this are that this function is a ratio rather than an absolute magnitude and that, due to light availability, photosynthesis is basically performed only in the first 200 m of the water column.
With the considerations above, the modified model for photosynthesis stands:
This is the first attempt to quantify the effects of muons in photosynthesis, which could be refined in future studies. On the other hand, note that when there is no deviation of the ionizing radiation flux from average radiation background, f ir(0)=1, we get the original E model (equation (1)).
In Atri & Melott (Reference Atri and Melott2011), two extreme cases are considered, when Earth is at galactic north:
(1) Minimum enhancement of ionizing radiation: f ir(0)=1.26.
(2) Maximum enhancement of ionizing radiation: f ir(0)=4.36.
Results and discussion
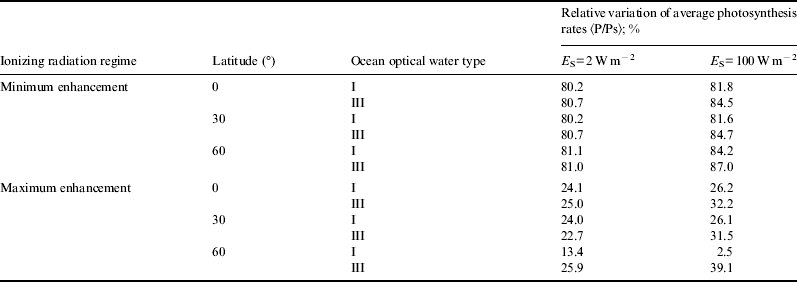
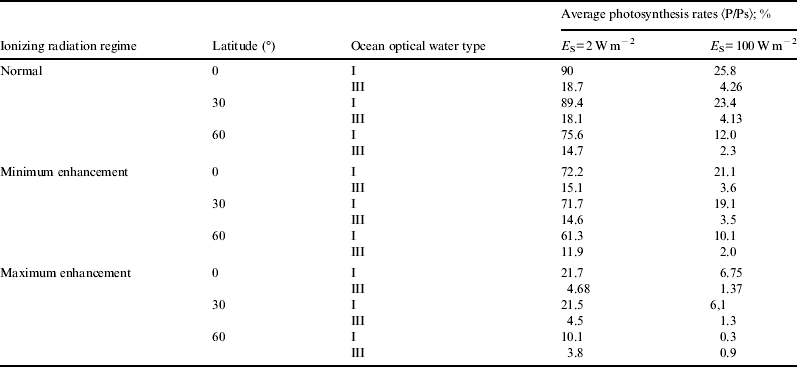
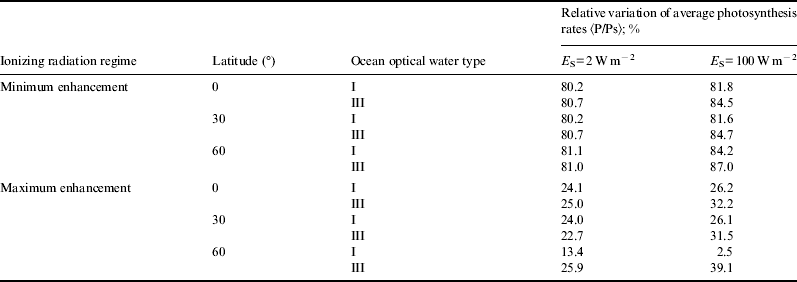
For the sake of brevity, in Figs. 1–6 we only show the photosynthesis rates for the case of maximum enhancement of radiation. Information on the scenario with minimum enhancement of radiation is compacted in Tables 1 and 2. Plots show great diminution of photosynthesis rates in all cases. However, to get a more quantitative idea , we show in Table 1 average photosynthesis rates in the photic zone (where light availability still allows for significant photosynthesis rates, here taken to be from the surface down to 200 m). Then, in Table 2, relative reduction of average photosynthesis rates in the photic zone, for both minimum and maximum enhancement of ionizing radiation is shown.

Fig. 1. The two lower (at the start) curves show the photosynthesis rates for maximum enhancement of ionizing radiation, for highly (E S=2 W m−2) and poorly (E S=100 W m−2) efficient organisms in the use of light. Latitude 0° and optical ocean water type I. Upper curves represent the rates for ordinary conditions, for the sake of comparison.

Fig. 2. The two lower (at the start) curves show the photosynthesis rates for maximum enhancement of ionizing radiation, for highly (E S=2 W m−2) and poorly (E S=100 W m−2) efficient organisms in the use of light. Latitude 0° and optical ocean water type III. Upper curves represent the rates for ordinary conditions, for the sake of comparison.

Fig. 3. The two lower (at the start) curves show the photosynthesis rates for maximum enhancement of ionizing radiation, for highly (E S=2 W m−2) and poorly (E S=100 W m−2) efficient organisms in the use of light. Latitude 30° and optical ocean water type I. Upper curves represent the rates for ordinary conditions, for the sake of comparison.

Fig. 4. The two lower (at the start) curves show the photosynthesis rates for maximum enhancement of ionizing radiation, for highly (E S=2 W m−2) and poorly (E S=100 W m−2) efficient organisms in the use of light. Latitude 30° and optical ocean water type III. Upper curves represent the rates for ordinary conditions, for the sake of comparison.

Fig. 5. The two lower (at the start) curves show the photosynthesis rates for maximum enhancement of ionizing radiation, for highly (E S=2 W m−2) and poorly (E S=100 W m−2) efficient organisms in the use of light. Latitude 60° and optical ocean water type I. Upper curves represent the rates for ordinary conditions, for the sake of comparison.

Fig. 6. The two lower (at the start) curves show the photosynthesis rates for maximum enhancement of ionizing radiation, for highly (E S=2 W m−2) and poorly (E S=100 W m−2) efficient organisms in the use of light. Latitude 60° and optical ocean water type III. Upper curves represent the rates for ordinary conditions, for the sake of comparison.
Table 1. Average photosynthesis rates for normal and radiation-enhanced scenario

Table 2. Relative reduction of average photosynthesis rates (as compared with normal radiation scenario)

In the case of minimum enhancement of radiation, for all latitudes the reduction in photosynthesis rates is around 20%. For the case of maximum enhancement, the reduction of photosynthesis rates is drastic: they drop from 4 to 5 times and in some cases even more. This could be a factor causing an important descent in biodiversity.
Conclusions
If the periodic position of Earth at the north of the galaxy implies enhancements of ionizing radiation as those presented in Atri & Melott (Reference Atri and Melott2011), then, a considerable drop of phytoplankton photosynthesis is to be expected, especially when enhancement is close to the maximum values shown in the above reference. Phytoplankton being the starting point of food assemblage, such a perturbation in its photosynthesis could cause a considerable drop in biodiversity, reinforcing the hypothesis in Atri & Melott (Reference Atri and Melott2011) on a periodicity of around 62 Myr in fossil biodiversity. However, we point out that our conclusions are based only on the influence of radiations on photosynthesis. Other environmental variables (especially temperature) could change with an increase of the flux of high-energy ionizing radiations on top of the atmosphere. Therefore, a more complete model of photosynthesis (in general, of habitability) is needed to improve the theoretical assessment for potential drops in biodiversity when Earth is near the north of our galaxy. This is the ongoing work in our group.


