1 Introduction
The landmark paper of Morton, Taylor & Turner (Reference Morton, Taylor and Turner1956) has formed the basis of many works on turbulent jets and plumes (in the present paper, jets are considered to result from a maintained source of mass and momentum, whereas plumes are considered to result from a maintained source of mass, momentum and buoyancy). The underlying assumption is that the rate of entrainment of ambient fluid due to turbulence in the jet or plume is proportional to a characteristic velocity within the jet or plume. The assumption that the entrainment coefficient is a constant has proved successful in a range of applications – see Turner (Reference Turner1986) for example – but even minor modifications to the source and/or ambient fluid can bring about drastic changes in behaviour that are difficult to model. One example where changes in conditions lead to anomalous results is cumulus clouds, where observations have raised questions about the effects of heat release on entrainment behaviour. Clouds form due to the condensation of water vapour carried by atmospheric plumes. This condensation is associated with a release of latent heat that enhances the buoyancy of the plume. Based on the entrainment hypothesis, the acceleration of fluid due to the buoyancy suggests that an increase in entrainment would follow (notwithstanding changes in radius, e.g. Hunt & Kaye (Reference Hunt and Kaye2005)). However, field observations suggest that a decrease in entrainment occurs, and Paluch (Reference Paluch1979) reports that it is reduced almost to zero. Squires & Turner (Reference Squires and Turner1962) and Warner (Reference Warner1970) have shown that plume models based on an assumption of constant entrainment cannot predict both the height of rise and the dilution of these clouds. By considering the effects of turbulent momentum flux, Hunt (Reference Hunt, Davies and Valente1994) proposed that an increase in the relative turbulent transport of streamwise momentum could lead to a decrease in entrainment.
Motivated by this anomalous entrainment problem, Bhat, Narasimha & Arakeri (Reference Bhat, Narasimha and Arakeri1989) pioneered an analogous laboratory experiment using electrodes to selectively heat an acidic jet to reproduce the off-source heating. In the paper presenting results that followed, Bhat & Narasimha (Reference Bhat and Narasimha1996) observed a dramatic change in structure of the jet, along with a drastic reduction in the spread rate and mass flux of the jet. It was concluded that the assumption of a constant entrainment coefficient was invalid for this flow, and consideration of the relative widths of the velocity and scalar profiles was also required. Furthermore, a decrease in the relative turbulent transport of streamwise momentum was observed, and so it was concluded that Hunt’s proposal was not verified by these results. More recent experiments and numerical simulations by Agrawal & Prasad (Reference Agrawal and Prasad2004) have provided a more detailed picture of the velocity and temperature fields, but did not address outstanding issues completely.
The first aim of the present paper is to readdress the theoretical aspects of Hunt (Reference Hunt, Davies and Valente1994) that were incorporated into Bhat & Narasimha (Reference Bhat and Narasimha1996) and Agrawal & Prasad (Reference Agrawal and Prasad2004); a more detailed discussion of the theoretical background and experimental results is presented in § 2. The second is to use implicit large-eddy simulations of a heated jet to investigate the reworked theory; an outline of the numerical code and the simulation configuration is given in § 3 followed by results in § 4. The paper concludes with a phenomenological summary and consolidates the numerical results with previous work in § 5.
2 Background
2.1 Idealised entrainment
Throughout the present paper, the discussion will be restricted to statistically stationary, vertically oriented axisymmetric jets in an unstratified incompressible fluid under the Boussinesq approximation. Following Morton et al. (Reference Morton, Taylor and Turner1956), the ambient fluid is assumed to be entrained at a rate proportional to some characteristic velocity within the jet, and contributions from fluctuations about the mean are neglected. By neglecting volumetric heating and assuming a ‘top-hat’ profile, conservation equations for mass, momentum and buoyancy can be written as
where
![]() $b(z)$
is the jet radius,
$b(z)$
is the jet radius,
![]() $u(z)$
is the characteristic velocity scale,
$u(z)$
is the characteristic velocity scale,
![]() $\unicode[STIX]{x1D6FC}_{\unicode[STIX]{x1D700}}$
is the entrainment coefficient (assumed at this stage to be a constant),
$\unicode[STIX]{x1D6FC}_{\unicode[STIX]{x1D700}}$
is the entrainment coefficient (assumed at this stage to be a constant),
![]() $g^{\prime }(z)=g(\unicode[STIX]{x1D70C}_{\infty }-\unicode[STIX]{x1D70C})/\unicode[STIX]{x1D70C}_{\infty }$
is the modified gravity for jet and ambient densities
$g^{\prime }(z)=g(\unicode[STIX]{x1D70C}_{\infty }-\unicode[STIX]{x1D70C})/\unicode[STIX]{x1D70C}_{\infty }$
is the modified gravity for jet and ambient densities
![]() $\unicode[STIX]{x1D70C}$
and
$\unicode[STIX]{x1D70C}$
and
![]() $\unicode[STIX]{x1D70C}_{\infty }$
, respectively, and
$\unicode[STIX]{x1D70C}_{\infty }$
, respectively, and
![]() $g$
is the acceleration due to gravity.
$g$
is the acceleration due to gravity.
2.2 Hunt’s proposal
Hunt (Reference Hunt, Davies and Valente1994) presented the following analysis in a discussion of atmospheric jets and plumes. The idea is that by accounting for the streamwise momentum flux due to turbulence, an increase in the relative turbulent transport of streamwise momentum could lead to a decrease in mass flux. Specifically, the square of the velocity in the mean specific momentum flux is modified to account for turbulent momentum flux by
![]() $\overline{u^{2}}=\bar{u}^{2}+\overline{{u^{\prime }}^{2}}$
, where the bar denotes an average that will be formalised below. The momentum equation (2.1) can be rewritten as
$\overline{u^{2}}=\bar{u}^{2}+\overline{{u^{\prime }}^{2}}$
, where the bar denotes an average that will be formalised below. The momentum equation (2.1) can be rewritten as
where
![]() $\bar{M}=b^{2}\bar{u}^{2}$
and
$\bar{M}=b^{2}\bar{u}^{2}$
and
![]() $M^{\prime }=b^{2}\overline{{u^{\prime }}^{2}}$
are the mean and turbulent momentum fluxes, respectively, and
$M^{\prime }=b^{2}\overline{{u^{\prime }}^{2}}$
are the mean and turbulent momentum fluxes, respectively, and
![]() $B=b^{2}\overline{g^{\prime }}$
is the buoyancy force (note that the original notation in Hunt (Reference Hunt, Davies and Valente1994) used
$B=b^{2}\overline{g^{\prime }}$
is the buoyancy force (note that the original notation in Hunt (Reference Hunt, Davies and Valente1994) used
![]() $F$
, but
$F$
, but
![]() $B$
is used here for convention).
$B$
is used here for convention).
Integrating (2.2) between two planes,
![]() $z_{1}$
and
$z_{1}$
and
![]() $z_{2}$
, gives
$z_{2}$
, gives
The specific mass flux
![]() $Q=b^{2}\bar{u}$
is related to the mean specific momentum flux through
$Q=b^{2}\bar{u}$
is related to the mean specific momentum flux through
![]() $Q^{2}=b^{2}\bar{M}$
, and so it is then possible to relate the change in mass flux through these two planes in terms of
$Q^{2}=b^{2}\bar{M}$
, and so it is then possible to relate the change in mass flux through these two planes in terms of
![]() $\unicode[STIX]{x1D706}$
,
$\unicode[STIX]{x1D706}$
,
From this, Hunt deduced that any positive forcing,
![]() $B$
, will lead to an increase in entrainment, whereas ‘a tendency for the jet to break up into individual eddies’, so that the relative turbulent transport of streamwise momentum increases, will result in a decrease in entrainment. As will be seen below, the second deduction needs careful interpretation; considering changes in relative turbulent transport of streamwise momentum is only valid under the assumption that the mean momentum flux is independent of
$B$
, will lead to an increase in entrainment, whereas ‘a tendency for the jet to break up into individual eddies’, so that the relative turbulent transport of streamwise momentum increases, will result in a decrease in entrainment. As will be seen below, the second deduction needs careful interpretation; considering changes in relative turbulent transport of streamwise momentum is only valid under the assumption that the mean momentum flux is independent of
![]() $z$
, which is not necessarily the case. Consequently, the deduction needs to be modified slightly: the mass flux can decrease if there is a relative increase in absolute turbulent momentum flux, rather than an increase in relative turbulent transport of streamwise momentum. This change of wording is better described symbolically, and involves considering the term
$z$
, which is not necessarily the case. Consequently, the deduction needs to be modified slightly: the mass flux can decrease if there is a relative increase in absolute turbulent momentum flux, rather than an increase in relative turbulent transport of streamwise momentum. This change of wording is better described symbolically, and involves considering the term
The two expressions are clearly equivalent if the mean momentum flux is constant, but may differ when it is not. An alternative approach to this analysis is presented in § 2.5 following a summary of the previous work in the literature.
2.3 Results of Narasimha and co-workers
The experiment pioneered by Bhat et al. (Reference Bhat, Narasimha and Arakeri1989) involved an aqueous jet, in which an acid was added to the jet fluid, and the ambient fluid was deionised. This allowed for the use of electrodes to inject heat into the system selectively. Since the jet fluid was acidic, it conducted, and so was heated as the fluid passed between the electrodes. The ambient fluid, however, did not conduct, and so was not heated. The domain in which heat was added is referred to here as the heat injection zone (HIZ), and the regions below and above are referred to as the pre-HIZ and post-HIZ, respectively. The selective heating process was designed to be analogous to the latent heat release associated with condensation in atmospheric plumes. Moreover, it was shown that the rate of heating was approximately proportional to tracer concentration.
Four papers presenting results followed. Elavarasan et al. (Reference Elavarasan, Bhat, Narasimha and Prabhu1995) and Bhat & Narasimha (Reference Bhat and Narasimha1996) looked at off-source heating in jets. Venkatakrishnan et al. (Reference Venkatakrishnan, Bhat, Prabhu and Narasimha1998) and Venkatakrishnan, Bhat & Narasimha (Reference Venkatakrishnan, Bhat and Narasimha1999) performed experiments in plumes. The focus here is on the results of Bhat & Narasimha (Reference Bhat and Narasimha1996), henceforth referred to as BN, and the main conclusions are summarised as follows. Upon heating, a visual narrowing of the radial extent of the jet was observed, the decay of the centreline streamwise velocity was arrested, and it can even be reversed. The mean streamwise velocity and scalar profiles remained close to Gaussian throughout. The mass flux at first increased more rapidly than in the unheated jet, but was nearly constant further downstream. The shape of the turbulent velocity distribution was modified by heating and was not recovered rapidly in the post-HIZ zone. The RMS streamwise fluctuations remained almost constant throughout the HIZ, and so the normalised values decreased. It was concluded that the original proposal of Hunt (Reference Hunt, Davies and Valente1994) was not verified by these data.
A comparison was made between the measured mass flux and the mass flux derived by assuming a constant entrainment coefficient. The former was significantly lower. It was concluded that ‘the assumption of constant entrainment coefficient was not at all realistic in the HIZ, and indeed that it suffers a drastic reduction at high values of the heating parameter’. This is, of course, in contrast to the intuitive idea that the entrainment coefficient would increase towards a plume-like value.
The scalar and velocity widths were also contrasted. It was observed that although the visual thinning was reflected in the scalar width, an increase in the velocity width occurs. This behaviour was taken into account when the integral model was compared with the experimental data. It was shown that by assuming a change in the ratio of velocity and scalar widths, the decay in velocity was more accurately predicted than by assuming the ratio to be constant. However, there was still disagreement with the experimental data. The conclusion was that the width ratio has to be taken into account but that further work was required before a convincing model could be formulated. This suggests that the mass flux data should be reassessed. Since velocities at the edge of the jet were difficult to measure, the profiles are assumed to be self-similar and the mass flux is derived from the centreline velocity and the jet width. However, using the scalar width naturally resulted in an underestimation of the mass flux. This issue will be readdressed below.
2.4 Results of Agrawal and Prasad
More recently, Agrawal and Prasad have investigated the heated jet both experimentally and numerically (Agrawal, Sreenivas & Prasad (Reference Agrawal, Sreenivas and Prasad2003), Agrawal & Prasad (Reference Agrawal and Prasad2004), Agrawal, Boersma & Prasad (Reference Agrawal, Boersma and Prasad2005); the collective work is henceforth referred to as AP). In the experiments, streamwise and radial velocities were measured in addition to temperature. The results were broadly consistent with BN, but additional observations were present; those observations and key differences are summarised below.
Experimentally, the profile of the radial velocity changed from that of an unheated jet below the HIZ to one that presented inflow at all radial locations in the lower HIZ, and in the upper half of the HIZ (induced by the acceleration). A growth in the width of the velocity profile was observed in the lower HIZ in contrast to the decrease observed in the width of the scalar profile. The mass flux was observed to increase in the lower HIZ, above which it became nearly constant. An off-centre peak in temperature was observed, which developed towards a flat-top Gaussian. It was proposed that the double-bump profile (as it was called) arises from a competition between the acid concentration and the residence time in the HIZ; the temperature increase was reported to be proportional to the acid concentration, and so a greater temperature rise would be expected at the axis, where the concentration is higher, but the fluid is moving at greater speed in the centre, so the residence time in the HIZ is lower. Radial profiles and centreline evolution of normalised fluctuating quantities were also presented. In the lower HIZ, centreline values of the streamwise velocity fluctuations were approximately 60 % higher than in the unheated case; they decreased with height, but always remained higher than in the unheated jet. The radial profiles were similar to the unheated jet (maximum at the centre and decreasing towards the edge), but at the top of the HIZ, the profile had changed shape and it was reported to be almost constant across the range measured.
Numerically, the results were also largely in agreement with the experimental work of BN. Again, radial velocity profiles showed that the heating leads to an inflow at all radial locations. An off-centre peak in streamwise velocity was also observed, but is likely due to particularly strong heating. The scalar and velocity widths grew approximately linearly in the pre-HIZ, with a ratio of about
![]() $1.2$
. A dramatic reduction in both the scalar and velocity widths was observed at the bottom of the HIZ, with the scalar width becoming narrower than the velocity. The streamwise velocity, tracer and temperature fluctuations were observed to increase in the HIZ, and all normalised centreline fluctuations were higher in the post-HIZ than in the pre-HIZ.
$1.2$
. A dramatic reduction in both the scalar and velocity widths was observed at the bottom of the HIZ, with the scalar width becoming narrower than the velocity. The streamwise velocity, tracer and temperature fluctuations were observed to increase in the HIZ, and all normalised centreline fluctuations were higher in the post-HIZ than in the pre-HIZ.
2.5 Entrainment decomposition
An alternative analysis is presented here that allows the different contributions to entrainment to be measured quantitatively. The approach incorporates turbulent fluctuations, as first suggested by Hunt (Reference Hunt, Davies and Valente1994), but more carefully accounts for changes in mean momentum flux. The analysis also includes the previously neglected pressure term.
Similar to Hunt, the mass and momentum conservation equations are used to derive an expression for entrainment, where entrainment is interpreted in terms of the entrainment coefficient, which is not assumed to be constant. The present treatment drops both the assumption of the ‘top-hat’ model (used for simplicity above) and the assumption of self-similarity (note that self-similarity is not prohibited).
Define the mean of a quantity
![]() $q$
in cylindrical polar coordinates
$q$
in cylindrical polar coordinates
![]() $(r,\unicode[STIX]{x1D703},z)$
as
$(r,\unicode[STIX]{x1D703},z)$
as
where
![]() $t$
denotes time and
$t$
denotes time and
![]() $\unicode[STIX]{x0394}t$
the averaging period, and the fluctuation about the mean as
$\unicode[STIX]{x0394}t$
the averaging period, and the fluctuation about the mean as
![]() $q^{\prime }=q-\bar{q}$
. The general axisymmetric statistically stationary conservation equations for mass and momentum for an incompressible buoyant jet under the Boussinesq approximation can be written as
$q^{\prime }=q-\bar{q}$
. The general axisymmetric statistically stationary conservation equations for mass and momentum for an incompressible buoyant jet under the Boussinesq approximation can be written as
where
![]() $\bar{u}_{r}$
and
$\bar{u}_{r}$
and
![]() $\bar{u}_{z}$
are the mean radial and streamwise velocities, respectively,
$\bar{u}_{z}$
are the mean radial and streamwise velocities, respectively,
![]() $\bar{T}$
is the mean temperature perturbation from ambient,
$\bar{T}$
is the mean temperature perturbation from ambient,
![]() $\unicode[STIX]{x1D6FC}_{T}=g\unicode[STIX]{x1D6FD}_{T}$
is the product of the gravitational constant
$\unicode[STIX]{x1D6FC}_{T}=g\unicode[STIX]{x1D6FD}_{T}$
is the product of the gravitational constant
![]() $g$
and thermal expansion coefficient
$g$
and thermal expansion coefficient
![]() $\unicode[STIX]{x1D6FD}_{T}$
, and the pressure term has been approximated following Hussein, Capp & George (Reference Hussein, Capp and George1994), specifically
$\unicode[STIX]{x1D6FD}_{T}$
, and the pressure term has been approximated following Hussein, Capp & George (Reference Hussein, Capp and George1994), specifically
![]() $\unicode[STIX]{x2202}_{z}\bar{p}\approx -\unicode[STIX]{x2202}_{z}\overline{{u_{r}^{\prime }}^{2}}$
.
$\unicode[STIX]{x2202}_{z}\bar{p}\approx -\unicode[STIX]{x2202}_{z}\overline{{u_{r}^{\prime }}^{2}}$
.
Integrating (2.7) over
![]() $r$
gives an expression for entrainment,
$r$
gives an expression for entrainment,
where
![]() $Q=2\unicode[STIX]{x03C0}\int _{0}^{\infty }u_{z}r\,\text{d}r$
is the specific mass flux,
$Q=2\unicode[STIX]{x03C0}\int _{0}^{\infty }u_{z}r\,\text{d}r$
is the specific mass flux,
![]() $\bar{u}_{\unicode[STIX]{x1D700}}=\lim _{\unicode[STIX]{x1D702}\rightarrow \infty }(-\unicode[STIX]{x1D702}\bar{u}_{r})$
is the entrainment velocity and
$\bar{u}_{\unicode[STIX]{x1D700}}=\lim _{\unicode[STIX]{x1D702}\rightarrow \infty }(-\unicode[STIX]{x1D702}\bar{u}_{r})$
is the entrainment velocity and
![]() $\unicode[STIX]{x1D702}(z)=r/b_{u}(z)$
is the radial coordinate normalised by the velocity width
$\unicode[STIX]{x1D702}(z)=r/b_{u}(z)$
is the radial coordinate normalised by the velocity width
![]() $b_{u}(z)$
. Here, the entrainment coefficient is taken to be the entrainment velocity normalised by the characteristic streamwise velocity scale
$b_{u}(z)$
. Here, the entrainment coefficient is taken to be the entrainment velocity normalised by the characteristic streamwise velocity scale
![]() $\bar{u}_{0}$
, specifically
$\bar{u}_{0}$
, specifically
![]() $\unicode[STIX]{x1D6FC}_{\unicode[STIX]{x1D700}}(z)=\bar{u}_{\unicode[STIX]{x1D700}}/\bar{u}_{0}$
.
$\unicode[STIX]{x1D6FC}_{\unicode[STIX]{x1D700}}(z)=\bar{u}_{\unicode[STIX]{x1D700}}/\bar{u}_{0}$
.
Similarly, integrating (2.8) over
![]() $r$
gives
$r$
gives
where
![]() $\bar{M}=2\unicode[STIX]{x03C0}\int _{0}^{\infty }\bar{u}_{z}^{2}\,r\,\text{d}r$
is the mean momentum flux,
$\bar{M}=2\unicode[STIX]{x03C0}\int _{0}^{\infty }\bar{u}_{z}^{2}\,r\,\text{d}r$
is the mean momentum flux,
![]() $M^{\prime }=2\unicode[STIX]{x03C0}\int _{0}^{\infty }\overline{{u_{z}^{\prime }}^{2}}\,r\,\text{d}r$
is the momentum flux due to the turbulence,
$M^{\prime }=2\unicode[STIX]{x03C0}\int _{0}^{\infty }\overline{{u_{z}^{\prime }}^{2}}\,r\,\text{d}r$
is the momentum flux due to the turbulence,
![]() $B=2\unicode[STIX]{x03C0}\unicode[STIX]{x1D6FC}_{T}\int _{0}^{\infty }\bar{T}\,r\,\text{d}r$
is the buoyancy force and
$B=2\unicode[STIX]{x03C0}\unicode[STIX]{x1D6FC}_{T}\int _{0}^{\infty }\bar{T}\,r\,\text{d}r$
is the buoyancy force and
![]() $P^{\prime }=2\unicode[STIX]{x03C0}\int _{0}^{\infty }\overline{{u_{r}^{\prime }}^{2}}\,r\,\text{d}r$
is the pressure term.
$P^{\prime }=2\unicode[STIX]{x03C0}\int _{0}^{\infty }\overline{{u_{r}^{\prime }}^{2}}\,r\,\text{d}r$
is the pressure term.
To follow Hunt (Reference Hunt, Davies and Valente1994), it is necessary to replace the velocity on the right-hand side of (2.9) with the mean momentum flux. This can be achieved by normalising the mean streamwise velocity according to
![]() $\bar{u}_{z}(r,z)=\bar{u}_{0}(z)f(\unicode[STIX]{x1D702},z)$
, for a dimensionless shape profile
$\bar{u}_{z}(r,z)=\bar{u}_{0}(z)f(\unicode[STIX]{x1D702},z)$
, for a dimensionless shape profile
![]() $f(\unicode[STIX]{x1D702},z)$
. Note that self-similarity is not assumed, because the shape profile can vary with
$f(\unicode[STIX]{x1D702},z)$
. Note that self-similarity is not assumed, because the shape profile can vary with
![]() $z$
. Then the mean momentum flux can be written as
$z$
. Then the mean momentum flux can be written as
![]() $\bar{M}=b_{u}^{2}\bar{u}_{0}^{2}I$
, where
$\bar{M}=b_{u}^{2}\bar{u}_{0}^{2}I$
, where
![]() $I(z)=2\unicode[STIX]{x03C0}\int _{0}^{\infty }f(\unicode[STIX]{x1D702},z)^{2}\unicode[STIX]{x1D702}\,\text{d}\unicode[STIX]{x1D702}$
. An expression for the entrainment coefficient can then be derived by combining (2.9) and (2.10):
$I(z)=2\unicode[STIX]{x03C0}\int _{0}^{\infty }f(\unicode[STIX]{x1D702},z)^{2}\unicode[STIX]{x1D702}\,\text{d}\unicode[STIX]{x1D702}$
. An expression for the entrainment coefficient can then be derived by combining (2.9) and (2.10):
The first term on the right-hand side of (2.11) is a measure of the growth of the width (spread rate) of the jet, the second term is the contribution from buoyancy and the final term is the rate of change of turbulent momentum fluxes. This final term is the term that Hunt predicted could explain a decrease in entrainment. Note that the derivative of the absolute turbulent momentum flux is present, not the derivative of the relative turbulent fluxes. Kaminski, Tait & Carazzo (Reference Kaminski, Tait and Carazzo2005) suggested that the entrainment behaviour observed in BN could be explained by a change in the similarity structure due to heating; changes in self-similarity are included implicitly in (2.11), and a method that unifies the Kaminski approach with that taken here is a subject of future work. The present treatment preserves the essence of Hunt’s proposal (specifically that a positive forcing can lead to an increase in entrainment and that an increase in turbulent fluctuations can lead to a decrease), but highlights the different interpretation required for the application to the heated jet.
3 Simulations
The numerical algorithm employed here is IAMR, a three-dimensional incompressible variable-density Navier–Stokes solver, written at the Center for Computational Sciences and Engineering at the Lawrence Berkeley National Laboratory. IAMR employs a non-oscillatory finite-volume approach with a two-step predictor–corrector method based on the unsplit second-order Godunov methodology. An approximate projection is used to enforce the divergence-free constraint in the updated velocity field. The overall algorithm is second-order in both space and time, parallelised and capable of adaptive mesh refinement (AMR). For further details, see Almgren et al. (Reference Almgren, Bell, Colella, Howell and Welcome1998) and the references therein.
The non-oscillatory finite-volume scheme employed here permits the use of implicit large-eddy simulation (ILES). This technique captures the inviscid cascade of kinetic energy through the inertial range, while numerical dissipation emulates the physical effects of the dynamics at the grid scale, without the expense of resolving the entire dissipation subrange; a comprehensive overview of the technique can be found in Grinstein, Margolin & Rider (Reference Grinstein, Margolin and Rider2007). Aspden et al. (Reference Aspden, Nikiforakis, Dalziel and Bell2008) presented a detailed study of the technique using the present numerical scheme, including a characterisation that allowed for an effective viscosity to be derived. Ultimately, it was shown that the approach leads to an effective Kolmogorov length scale approximately equal to
![]() $0.3\unicode[STIX]{x0394}x$
. For the turbulent jets of interest in the present work, the details of viscous dissipation of kinetic energy and molecular diffusion of scalars are of little consequence to the main flow features, and so ILES is a suitable approach. Also note that no diffusion terms are included explicitly; this is expected to result in effective Prandtl and Schmidt numbers close to unity, a comprehensive study of which is beyond the scope of this paper. Moreover, the underlying algorithm has been used successfully in previous entrainment studies of turbulent jets in Scase, Aspden & Caulfield (Reference Scase, Aspden and Caulfield2009) and thermals in Aspden et al. (Reference Aspden, Bell, Dong and Woosley2011).
$0.3\unicode[STIX]{x0394}x$
. For the turbulent jets of interest in the present work, the details of viscous dissipation of kinetic energy and molecular diffusion of scalars are of little consequence to the main flow features, and so ILES is a suitable approach. Also note that no diffusion terms are included explicitly; this is expected to result in effective Prandtl and Schmidt numbers close to unity, a comprehensive study of which is beyond the scope of this paper. Moreover, the underlying algorithm has been used successfully in previous entrainment studies of turbulent jets in Scase, Aspden & Caulfield (Reference Scase, Aspden and Caulfield2009) and thermals in Aspden et al. (Reference Aspden, Bell, Dong and Woosley2011).
The equations of motion used to describe the heated jet are
where
![]() $\boldsymbol{u}$
is the velocity (with components
$\boldsymbol{u}$
is the velocity (with components
![]() $u_{i}$
),
$u_{i}$
),
![]() $p$
,
$p$
,
![]() $T$
and
$T$
and
![]() $c$
are the pressure, temperature and scalar (acid) concentration, respectively,
$c$
are the pressure, temperature and scalar (acid) concentration, respectively,
![]() $\unicode[STIX]{x1D6FC}_{T}=g\unicode[STIX]{x1D6FD}_{T}$
is the product of acceleration due to gravity
$\unicode[STIX]{x1D6FC}_{T}=g\unicode[STIX]{x1D6FD}_{T}$
is the product of acceleration due to gravity
![]() $g$
and thermal expansion
$g$
and thermal expansion
![]() $\unicode[STIX]{x1D6FD}_{T}$
,
$\unicode[STIX]{x1D6FD}_{T}$
,
![]() $\unicode[STIX]{x1D6FC}_{c}$
is the heating rate (a non-zero constant in the HIZ and zero otherwise) and
$\unicode[STIX]{x1D6FC}_{c}$
is the heating rate (a non-zero constant in the HIZ and zero otherwise) and
![]() $\unicode[STIX]{x1D6FF}_{iz}$
is the Kronecker delta.
$\unicode[STIX]{x1D6FF}_{iz}$
is the Kronecker delta.
The domain size was
![]() $32d\times 32d\times 48d$
, where
$32d\times 32d\times 48d$
, where
![]() $d$
is the jet diameter, and it was discretised with a base grid of
$d$
is the jet diameter, and it was discretised with a base grid of
![]() $128\times 128\times 192$
computational cells, with two levels of refinement of factor 2, giving an effective resolution of
$128\times 128\times 192$
computational cells, with two levels of refinement of factor 2, giving an effective resolution of
![]() $512\times 512\times 768$
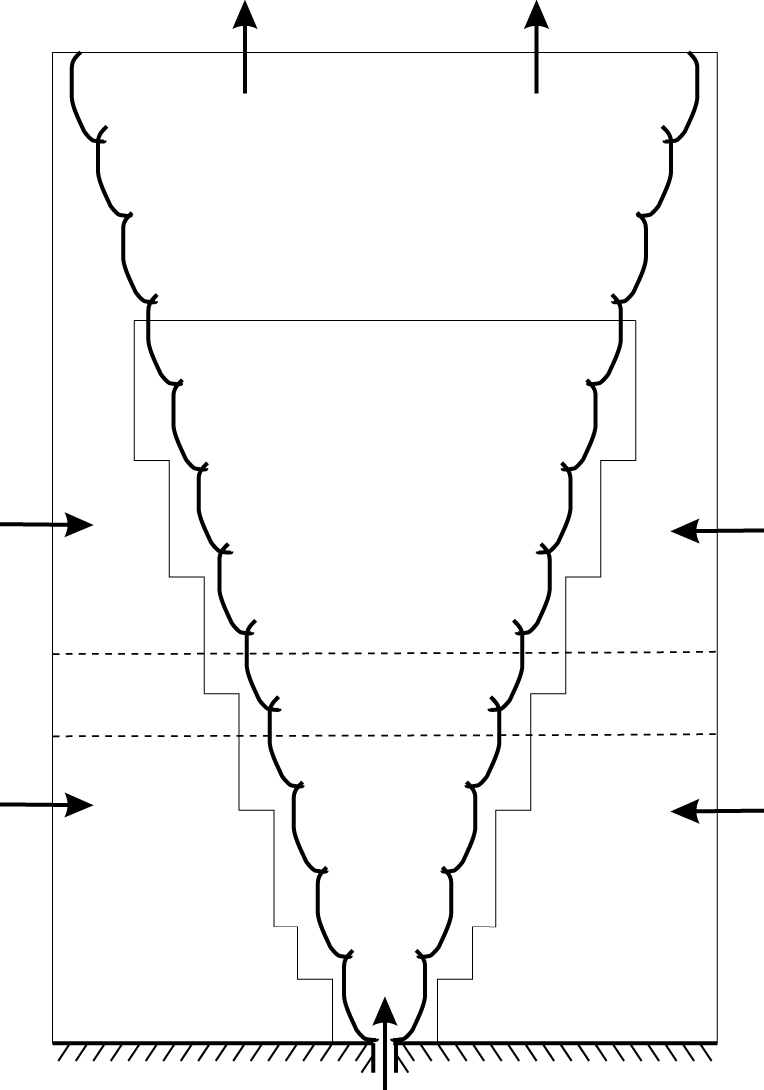
computational cells. The AMR was set up to follow the advected tracer injected at the source; this ensures that the jet fluid (where the velocity gradients are greatest) is resolved at the finest level and the ambient fluid is not; the dynamic (de)allocation of grids is a particular benefit during the initial transient stage of the flow development. A solid free-slip base was used with inflow at the source, where a narrow hyperbolic tangent was used to remove the discontinuity at the edge of the jet and a small-amplitude perturbation to break symmetry. Horizontal inflow was permitted (but not prescribed) at the lateral boundaries (in the ghost cells, vertical velocity was set to zero and horizontal velocity matched to the interior), and the upper boundary consisted of an outflow boundary condition. Standard outflow boundary conditions (matching the velocity in the ghost cell to the first interior cell) can lead to spurious and persistent inflow, polluting the simulation, so two steps were taken to help prevent this happening. Firstly, any negative velocities were set to zero, and secondly, a buffer region near the top of the domain was used (i.e. simply a region without AMR) so that the solution became more diffuse. Note that this is exactly the same approach used previously in Scase et al. (Reference Scase, Aspden and Caulfield2009). A schematic of the simulation configuration is shown in figure 1.
$512\times 512\times 768$
computational cells. The AMR was set up to follow the advected tracer injected at the source; this ensures that the jet fluid (where the velocity gradients are greatest) is resolved at the finest level and the ambient fluid is not; the dynamic (de)allocation of grids is a particular benefit during the initial transient stage of the flow development. A solid free-slip base was used with inflow at the source, where a narrow hyperbolic tangent was used to remove the discontinuity at the edge of the jet and a small-amplitude perturbation to break symmetry. Horizontal inflow was permitted (but not prescribed) at the lateral boundaries (in the ghost cells, vertical velocity was set to zero and horizontal velocity matched to the interior), and the upper boundary consisted of an outflow boundary condition. Standard outflow boundary conditions (matching the velocity in the ghost cell to the first interior cell) can lead to spurious and persistent inflow, polluting the simulation, so two steps were taken to help prevent this happening. Firstly, any negative velocities were set to zero, and secondly, a buffer region near the top of the domain was used (i.e. simply a region without AMR) so that the solution became more diffuse. Note that this is exactly the same approach used previously in Scase et al. (Reference Scase, Aspden and Caulfield2009). A schematic of the simulation configuration is shown in figure 1.
A simulation was run without heating to establish a base case (referred to as Jet), along with three cases with different magnitudes of heating (referred to as Low, Medium and High). The heating was applied between 10 and 14 jet diameters from the source. All simulations were run until they had become statistically stationary before taking averages. The advective time scale in the Jet case increases with the square of the distance from the source, so statistical quality decreases downstream. The time scale in the heated cases does not suffer from the same problem, so the Jet can be considered the worst-case scenario in terms of statistical convergence.
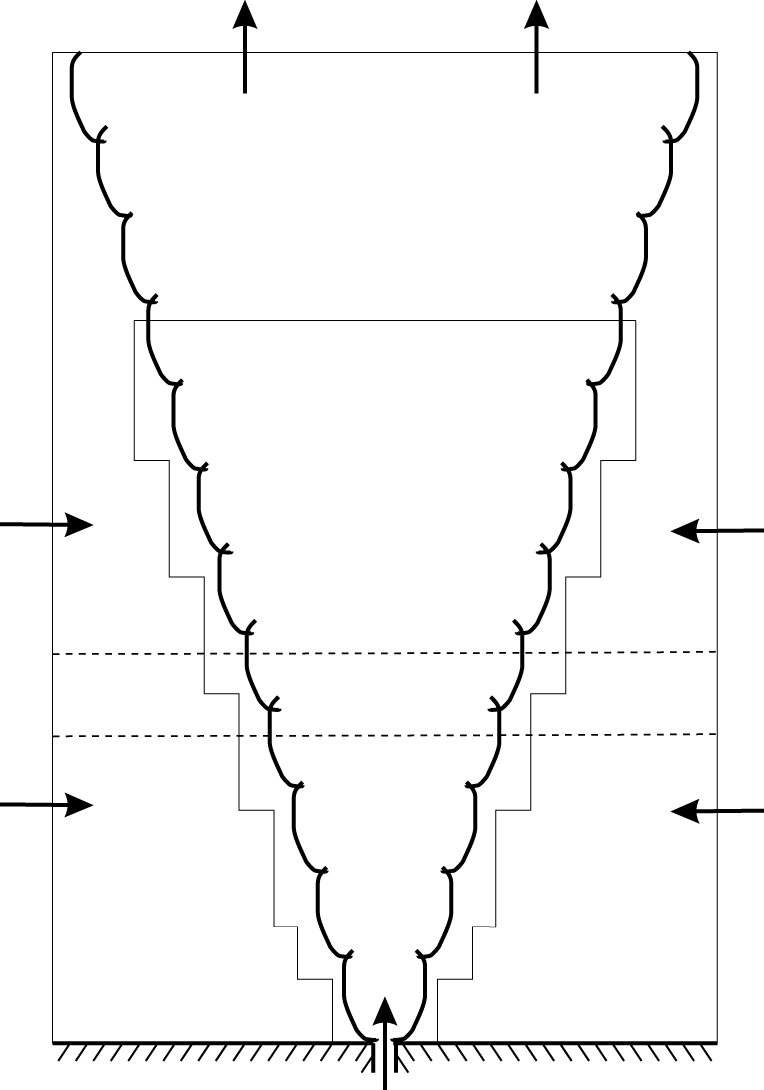
Figure 1. Schematic of the numerical configuration of a turbulent jet with off-source heating. The horizontal dashed lines bound the heat injection zone, and the black outline inside the domain gives an idea of the AMR region.
The heating was characterised by BN using the non-dimensional group
where
![]() $C_{p}$
is the heat capacity, the suffix
$C_{p}$
is the heat capacity, the suffix
![]() $b$
denotes the bottom of the HIZ,
$b$
denotes the bottom of the HIZ,
![]() $H$
is the total heating rate (watts) and
$H$
is the total heating rate (watts) and
![]() $d$
and
$d$
and
![]() $u_{in}$
are the diameter and velocity at the jet nozzle, respectively. Values of
$u_{in}$
are the diameter and velocity at the jet nozzle, respectively. Values of
![]() $G$
in the range 0.25–4.7 were presented by BN. In the experimental work of AP, a Richardson number was preferred,
$G$
in the range 0.25–4.7 were presented by BN. In the experimental work of AP, a Richardson number was preferred,
where
![]() $b_{b}$
and
$b_{b}$
and
![]() $u_{b}$
are the characteristic diameter and velocity at the bottom of the HIZ, and it was noted that
$u_{b}$
are the characteristic diameter and velocity at the bottom of the HIZ, and it was noted that
![]() $G=12.5Ri_{AP}$
for that experiment. Most of the discussion from AP was for
$G=12.5Ri_{AP}$
for that experiment. Most of the discussion from AP was for
![]() $Ri_{AP}=0.36$
(
$Ri_{AP}=0.36$
(
![]() $G=4.3$
). For simulations, the Richardson number (or equivalent) cannot be determined a priori because the total heating depends on the scalar concentration in the HIZ,
$G=4.3$
). For simulations, the Richardson number (or equivalent) cannot be determined a priori because the total heating depends on the scalar concentration in the HIZ,
where
![]() $z_{b}$
and
$z_{b}$
and
![]() $z_{t}$
denote the bottom and top of the HIZ. The numerical work of AP followed this approach, and used a much higher value of approximately 12 to reduce computational expense. In the present paper, the three cases Low, Medium and High were found to have values of
$z_{t}$
denote the bottom and top of the HIZ. The numerical work of AP followed this approach, and used a much higher value of approximately 12 to reduce computational expense. In the present paper, the three cases Low, Medium and High were found to have values of
![]() $Ri=0.075$
, 0.25 and 0.80, respectively, more consistent with the experimental studies.
$Ri=0.075$
, 0.25 and 0.80, respectively, more consistent with the experimental studies.
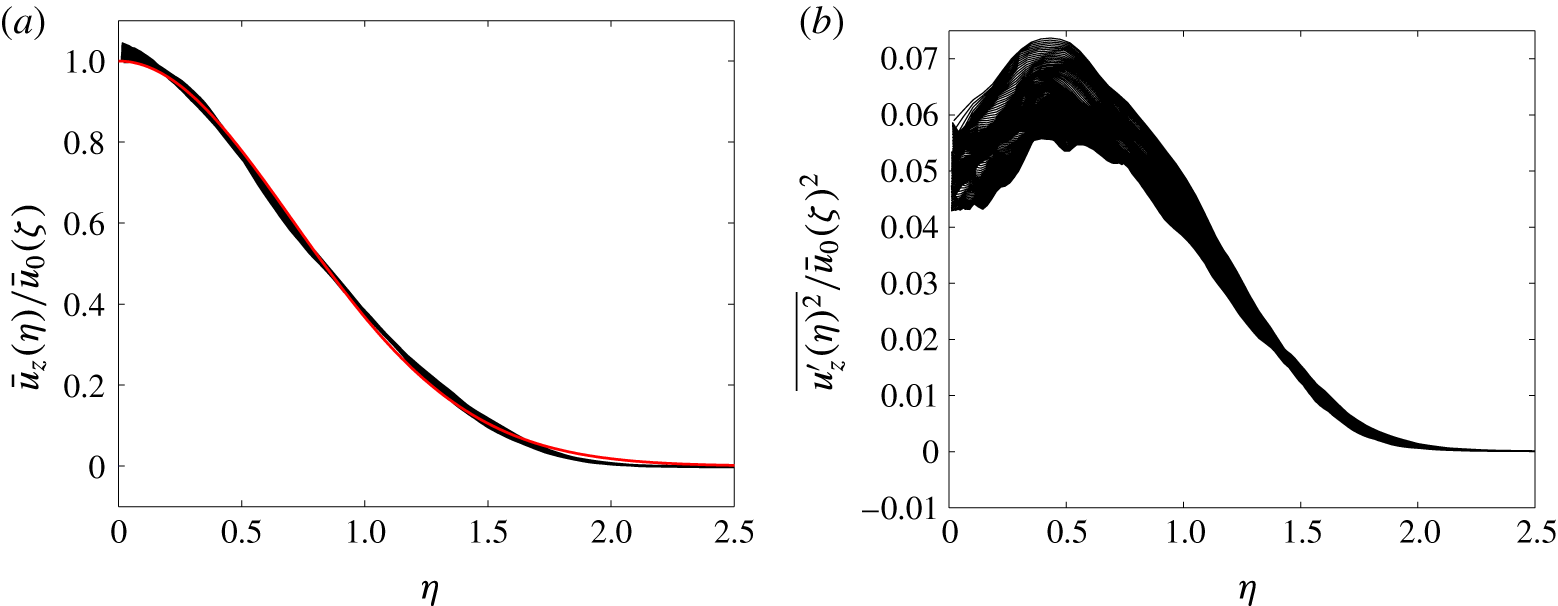
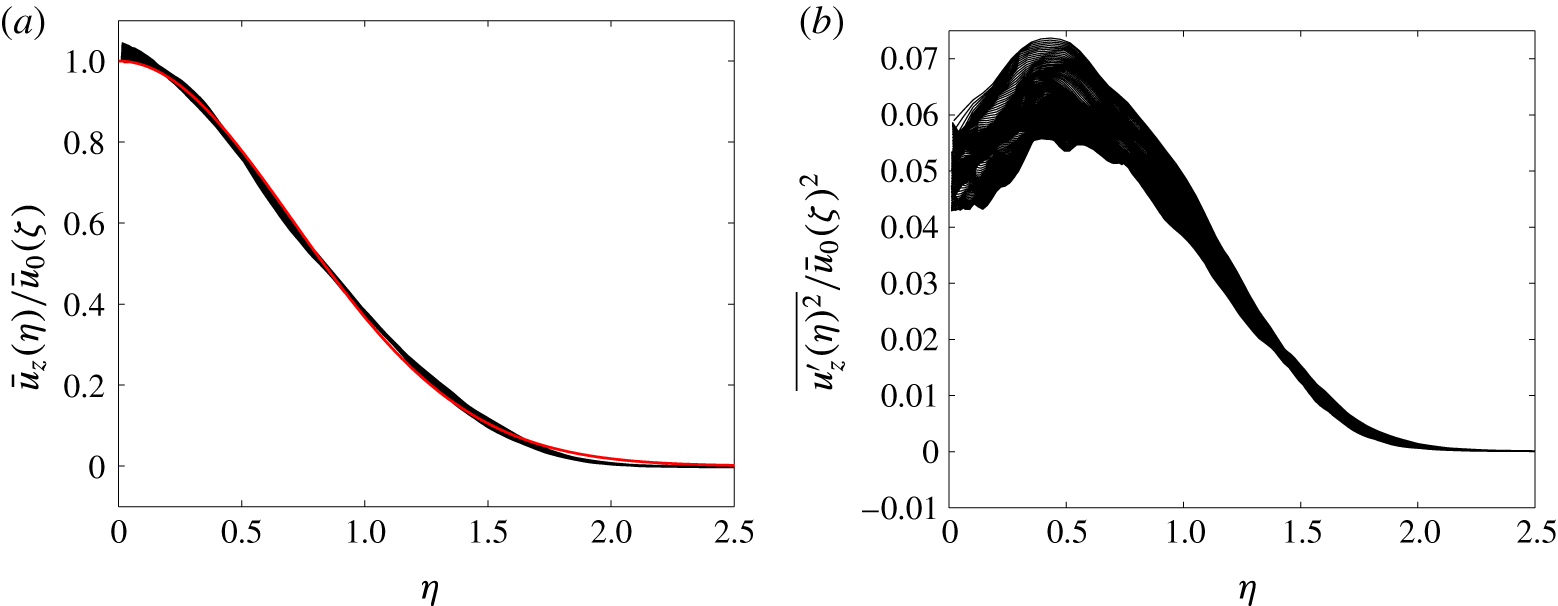
Figure 2. Self-similarity in the unheated jet. The profiles are taken from 10 to 26 jet diameters downstream of the source. (a) Normalised streamwise velocity; (b) normalised streamwise velocity fluctuation. The red line (colour online) shows a Gaussian profile.
Figure 2 shows normalised profiles of (a) streamwise velocity
![]() $\bar{u}_{z}(\unicode[STIX]{x1D702})/\bar{u}_{0}(\unicode[STIX]{x1D701})$
and (b) streamwise velocity fluctuation
$\bar{u}_{z}(\unicode[STIX]{x1D702})/\bar{u}_{0}(\unicode[STIX]{x1D701})$
and (b) streamwise velocity fluctuation
![]() $\overline{{u_{z}^{\prime }(\unicode[STIX]{x1D702})}^{2}}/\bar{u}_{0}(\unicode[STIX]{x1D701})^{2}$
. The normalised radius is
$\overline{{u_{z}^{\prime }(\unicode[STIX]{x1D702})}^{2}}/\bar{u}_{0}(\unicode[STIX]{x1D701})^{2}$
. The normalised radius is
![]() $\unicode[STIX]{x1D702}=r/b_{u}(z)$
, where
$\unicode[STIX]{x1D702}=r/b_{u}(z)$
, where
![]() $b_{u}(z)$
is the local width, and the characteristic velocity scale is
$b_{u}(z)$
is the local width, and the characteristic velocity scale is
![]() $\bar{u}_{0}(z)$
, both of which are evaluated using a best fit to a Gaussian distribution
$\bar{u}_{0}(z)$
, both of which are evaluated using a best fit to a Gaussian distribution
![]() $\bar{u}_{0}\exp (-r^{2}/b_{u}^{2})$
. All profiles are shown between 10 and 26 jet diameters downstream from the source. The streamwise velocity shows a self-similar collapse close to a Gaussian distribution (shown in red; colour online), and the velocity fluctuations also present a satisfactory collapse for a second-order quantity. Note that the Jet case requires the longest averaging period, because the time scales in the heated cases are shorter due to the acceleration, providing more rapid convergence of the statistics.
$\bar{u}_{0}\exp (-r^{2}/b_{u}^{2})$
. All profiles are shown between 10 and 26 jet diameters downstream from the source. The streamwise velocity shows a self-similar collapse close to a Gaussian distribution (shown in red; colour online), and the velocity fluctuations also present a satisfactory collapse for a second-order quantity. Note that the Jet case requires the longest averaging period, because the time scales in the heated cases are shorter due to the acceleration, providing more rapid convergence of the statistics.
4 Results
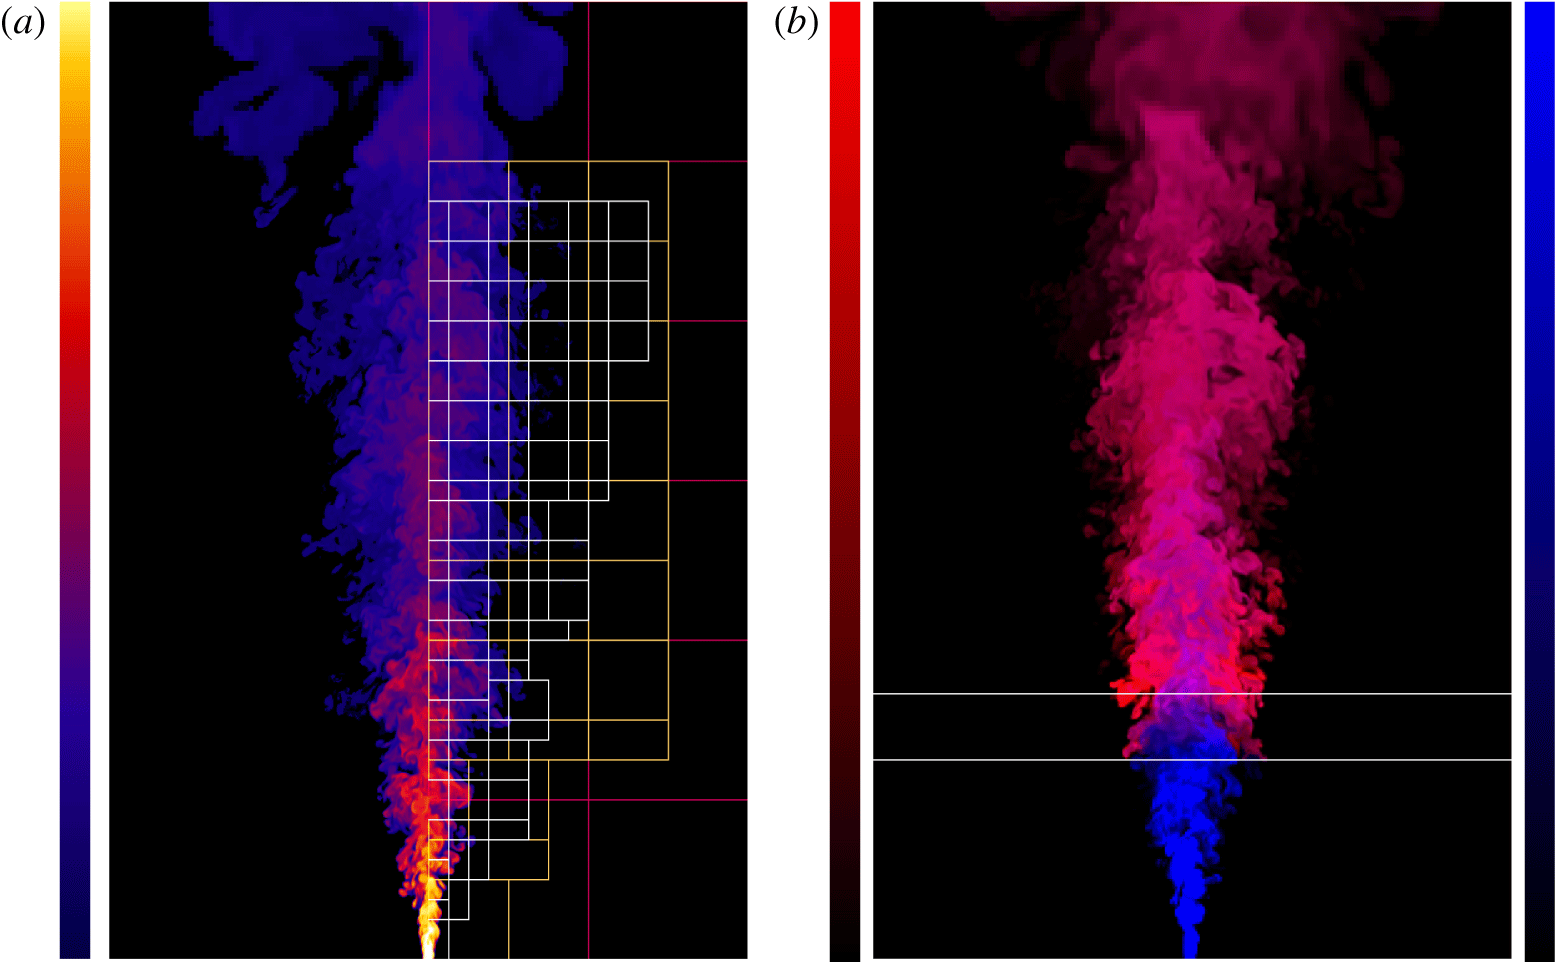
Figure 3. Two-dimensional slice through the Jet (a) and Medium (b) cases; the slices show the full extent of the domain. The colouring on the left-hand panel uses a broad range to highlight the different levels of dilution. The grids from the AMR are shown on the right-hand half of the image (red, yellow and white correspond to the base grid, and the first and second levels of refinement, respectively); it is clear that the finest level covers the region of interest, and highlights the buffer region at the top of the domain to aid the outflow boundary condition. The colouring on the right-hand panel is a composite (i.e. superposition) of the tracer in blue and temperature in red; the horizontal white lines bound the HIZ.
Two-dimensional slices of the Jet and Medium cases are presented in figure 3. The jet image is taken at the beginning of the temporal averaging window, and the colouring uses a broad range to highlight the different levels of dilution of the passive scalar. The grids from the adaptive mesh refinement are shown on the right-hand half of the image (note these are the grids, not the mesh itself), where it is clear that the finest level (white) covers the region of interest, and highlights the buffer region at the top of the domain to aid the outflow boundary condition. The colouring in the right-hand panel is a composite of the tracer in blue and temperature in red; specifically, the tracer (normalised between 0 and 1) shown in blue and the temperature (normalised by the peak value) in red are superimposed. Note how the sides of the heated jet are almost vertical above the HIZ, as originally reported in BN. Also note how the hottest region occurs away from the centreline (near the end of the HIZ); this can be attributed to the competition between heating intensity and residence time, as previously observed by AP.

Figure 4. Comparison of characteristic velocity (a) and tracer (b) scales in all four cases. The vertical dashed lines denote the HIZ. Note how heating arrests the decay in velocity and can lead to an acceleration, and also leads to enhanced dilution of the scalar.
The streamwise evolution of the characteristic velocity and tracer scales in all four cases is shown in figure 4; the characteristic velocity scale
![]() $\bar{u}_{0}(\unicode[STIX]{x1D701})$
and tracer concentration scale
$\bar{u}_{0}(\unicode[STIX]{x1D701})$
and tracer concentration scale
![]() $c_{0}(\unicode[STIX]{x1D701})$
, along with corresponding profile widths
$c_{0}(\unicode[STIX]{x1D701})$
, along with corresponding profile widths
![]() $b_{u}(\unicode[STIX]{x1D701})$
and
$b_{u}(\unicode[STIX]{x1D701})$
and
![]() $b_{c}(\unicode[STIX]{x1D701})$
, were found from the best fit of each profile to a Gaussian distribution, with
$b_{c}(\unicode[STIX]{x1D701})$
, were found from the best fit of each profile to a Gaussian distribution, with
![]() $\unicode[STIX]{x1D701}=z/d$
. The inverse of each quantity is plotted because this is expected to be linear in the Jet case, a feature that is reproduced quite well. Upon heating, the decay in velocity is arrested and the flow is even observed to accelerate in the two cases with the strongest heating. The effect of heating on the tracer concentration is to increase the level of dilution, indicative of enhanced entrainment. These observations are consistent with both BN and AP.
$\unicode[STIX]{x1D701}=z/d$
. The inverse of each quantity is plotted because this is expected to be linear in the Jet case, a feature that is reproduced quite well. Upon heating, the decay in velocity is arrested and the flow is even observed to accelerate in the two cases with the strongest heating. The effect of heating on the tracer concentration is to increase the level of dilution, indicative of enhanced entrainment. These observations are consistent with both BN and AP.
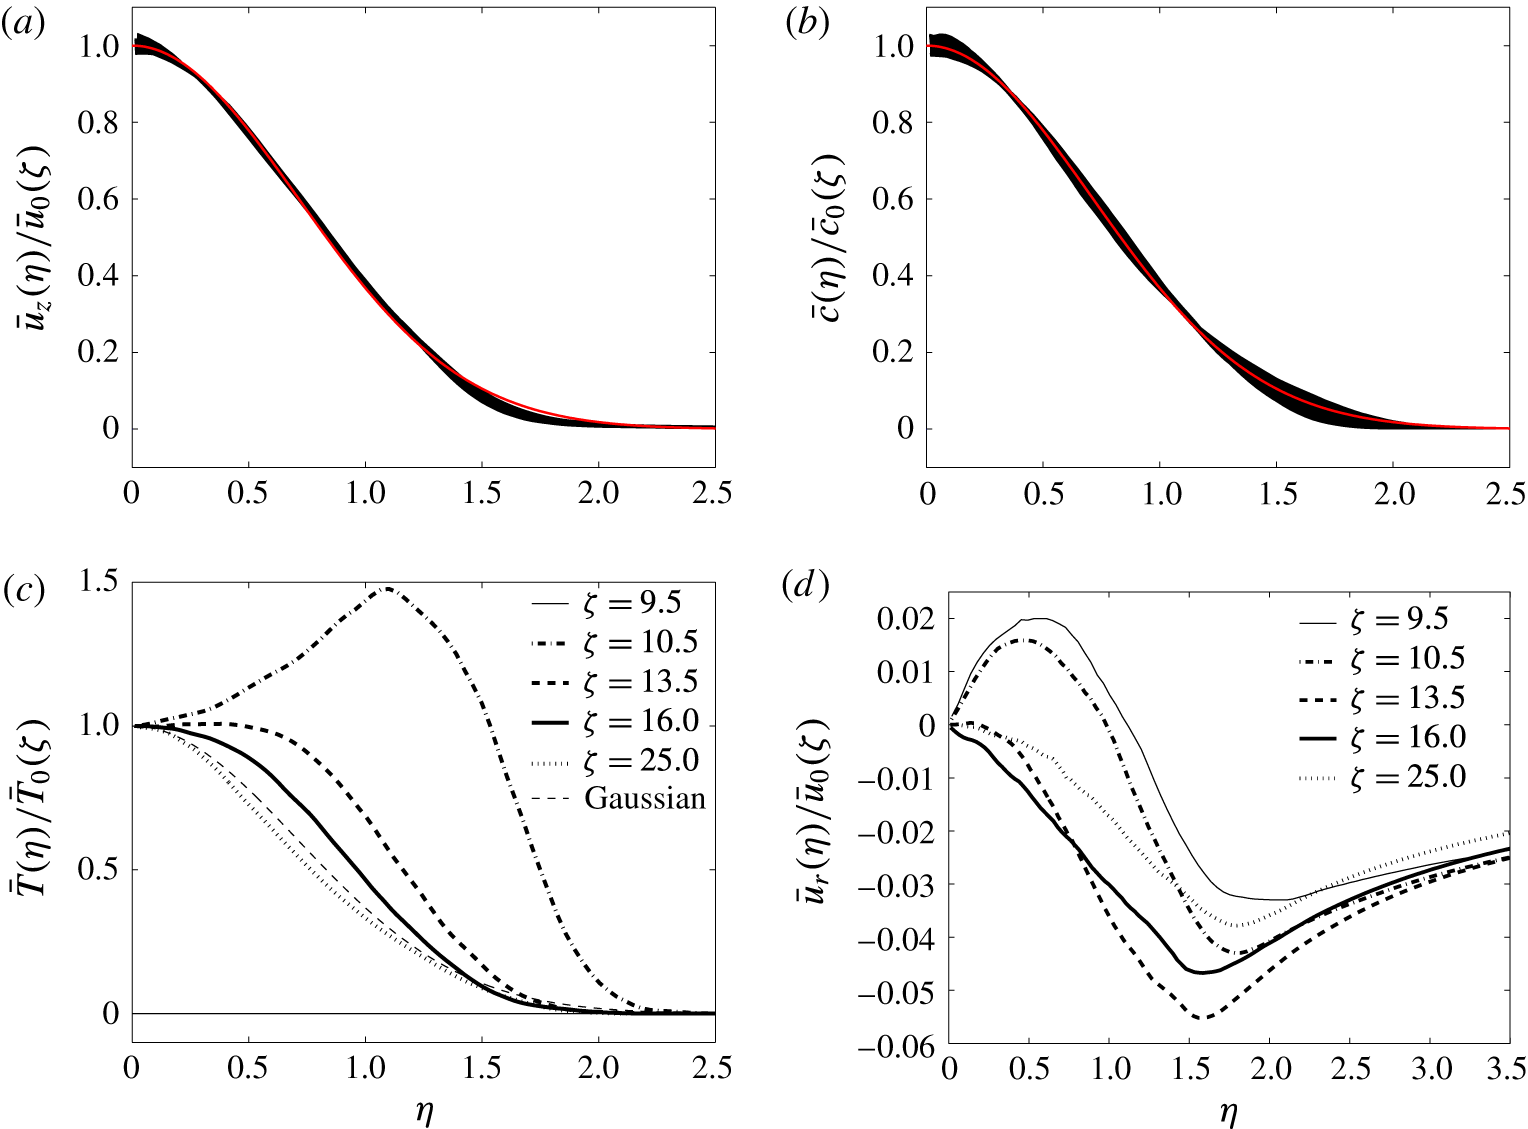
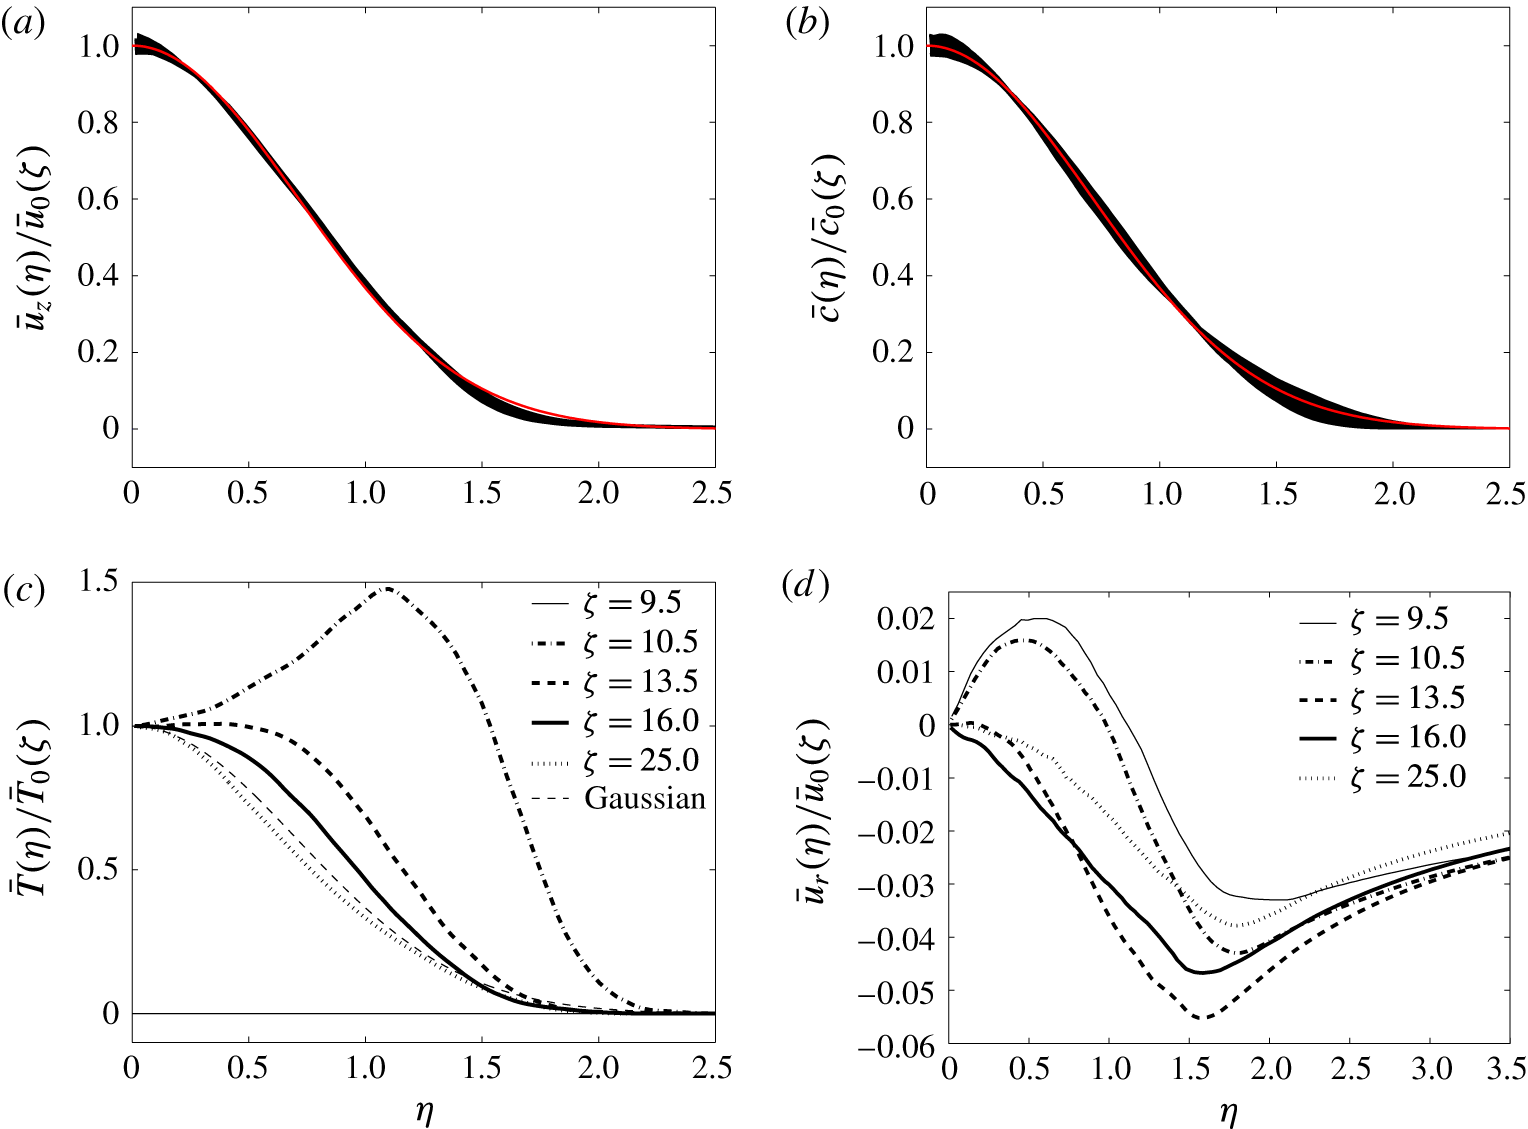
Figure 5. Normalised profiles in the Medium case. (a) Streamwise velocity, (b) tracer, (c) temperature and (d) radial velocity. Velocity and scalar profiles have been normalised by corresponding characteristic scales and widths, and the temperature has been normalised by the centreline value and the velocity width.
Normalised profiles of streamwise velocity, tracer concentration, temperature and radial velocity from the Medium case are presented in figure 5; for temperature, fitting to a Gaussian is not appropriate, so the characteristic temperature scale has been taken as the centreline value, and the velocity width has been used for normalisation. All 320 profiles within the averaging window are shown for the streamwise velocity (figure 5
a) and tracer concentration (figure 5
b), demonstrating that both quantities do indeed remain close to Gaussian throughout the evolution, consistent with BN. Selected profiles are presented for the temperature and radial velocity because self-similarity is not preserved in these cases; specifically, profiles are located half a jet diameter below the HIZ (
![]() $\unicode[STIX]{x1D701}=9.5$
), half a jet diameter above the bottom (
$\unicode[STIX]{x1D701}=9.5$
), half a jet diameter above the bottom (
![]() $\unicode[STIX]{x1D701}=10.5$
) and below the top (
$\unicode[STIX]{x1D701}=10.5$
) and below the top (
![]() $\unicode[STIX]{x1D701}=13.5$
) of the HIZ, one just above the HIZ (
$\unicode[STIX]{x1D701}=13.5$
) of the HIZ, one just above the HIZ (
![]() $\unicode[STIX]{x1D701}=16$
) and a final one a jet diameter below the top of the averaging window (
$\unicode[STIX]{x1D701}=16$
) and a final one a jet diameter below the top of the averaging window (
![]() $\unicode[STIX]{x1D701}=25$
). The temperature profile shows a clear off-centre peak just inside the HIZ (
$\unicode[STIX]{x1D701}=25$
). The temperature profile shows a clear off-centre peak just inside the HIZ (
![]() $\unicode[STIX]{x1D701}=10.5$
), with a broad distribution at the end of the HIZ (
$\unicode[STIX]{x1D701}=10.5$
), with a broad distribution at the end of the HIZ (
![]() $\unicode[STIX]{x1D701}=13.5$
), consistent with BN and AP. Further from the source (
$\unicode[STIX]{x1D701}=13.5$
), consistent with BN and AP. Further from the source (
![]() $\unicode[STIX]{x1D701}=16,25$
), the profile becomes more Gaussian, although it is apparently narrower than the velocity profile. Upon heating, the radial velocity transitions from the characteristic jet profile (
$\unicode[STIX]{x1D701}=16,25$
), the profile becomes more Gaussian, although it is apparently narrower than the velocity profile. Upon heating, the radial velocity transitions from the characteristic jet profile (
![]() $\unicode[STIX]{x1D701}=9.5$
), and by the end of the HIZ (
$\unicode[STIX]{x1D701}=9.5$
), and by the end of the HIZ (
![]() $\unicode[STIX]{x1D701}=13.5$
) it has become negative (i.e. inflow) at all radial positions, again indicative of enhanced entrainment.
$\unicode[STIX]{x1D701}=13.5$
) it has become negative (i.e. inflow) at all radial positions, again indicative of enhanced entrainment.
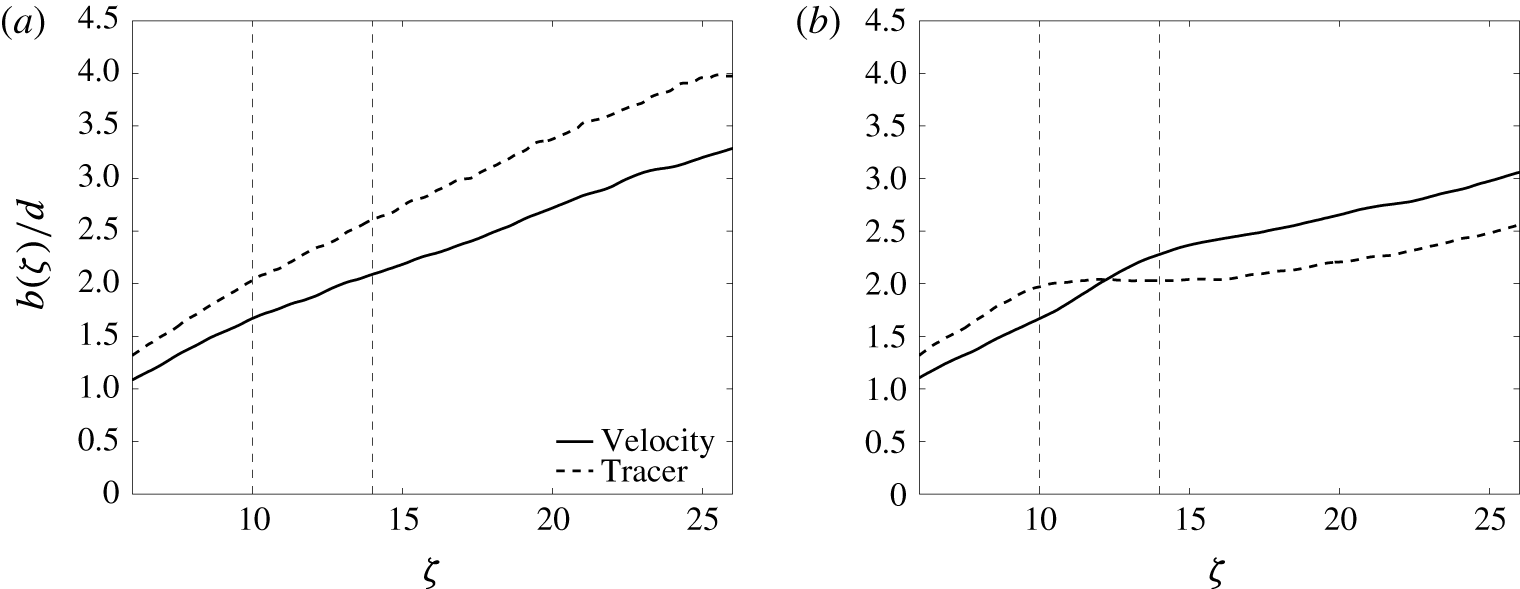
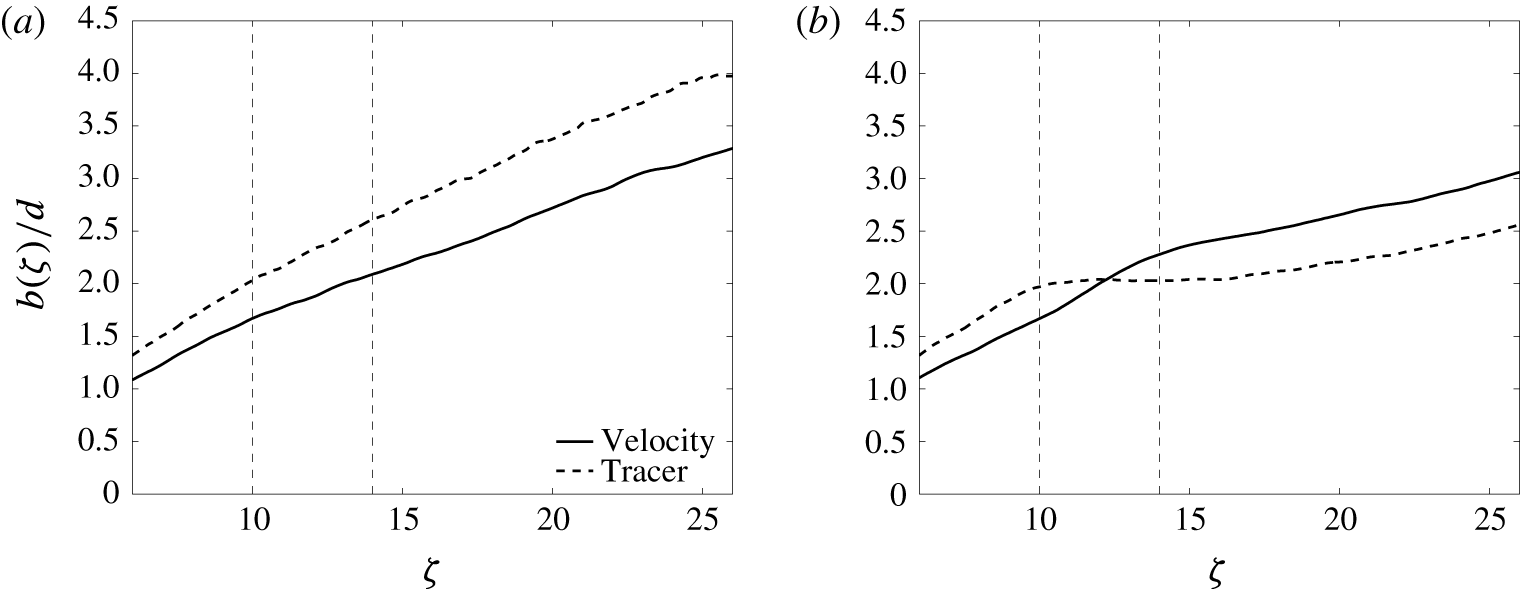
Figure 6. Profile widths in (a) the Jet case and (b) the Medium cases; all widths are evaluated for a best fit to a Gaussian distribution.
The streamwise evolutions of the velocity and tracer widths are contrasted in figure 6. In the Jet case (figure 6 a), the tracer width is consistently approximately 20 % greater than the velocity width, as expected. In the Medium case (figure 6 b), the tracer width is again greater than the velocity width below the HIZ, but heating produces a particularly interesting change. The tracer width becomes constant, or even decreases slightly, before eventually beginning to grow again in the post-HIZ. Conversely, the velocity width appears to grow more quickly in the HIZ. Heating accelerates the jet, resulting in a greater radial inflow that sweeps the tracer towards the axis; however, the off-centre temperature peak appears to be strong enough to prevent the velocity profile from being narrowed to the same extent. It will be shown below that it is this contrasting width behaviour that demands more careful interpretation of experimental data when comparing with analytical predictions.
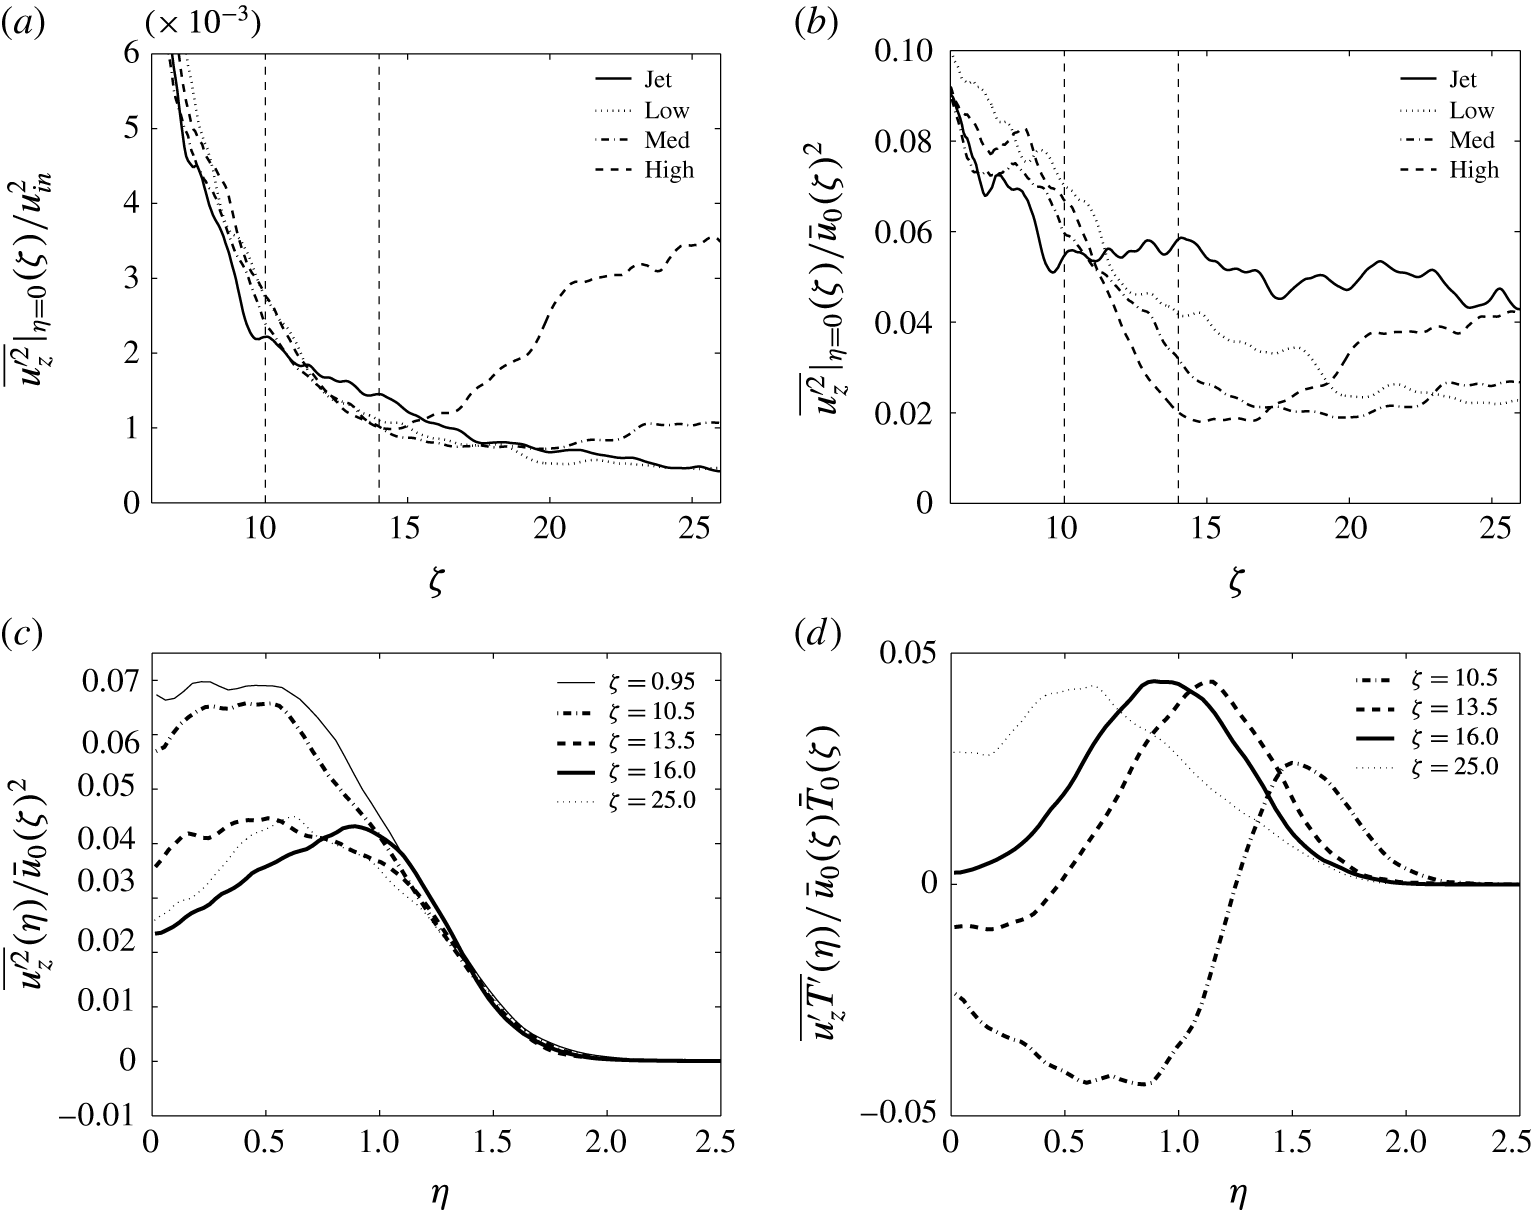
Figure 7. Turbulent fluctuations from the Medium case. (a) Streamwise velocity fluctuation normalised by the inflow velocity
![]() $u_{in}$
, (b) streamwise velocity fluctuation normalised by the characteristic velocity
$u_{in}$
, (b) streamwise velocity fluctuation normalised by the characteristic velocity
![]() $\bar{u}_{0}(\unicode[STIX]{x1D701})$
, (c) profiles of normalised streamwise velocity fluctuations and (d) profiles of normalised streamwise velocity–temperature correlation.
$\bar{u}_{0}(\unicode[STIX]{x1D701})$
, (c) profiles of normalised streamwise velocity fluctuations and (d) profiles of normalised streamwise velocity–temperature correlation.
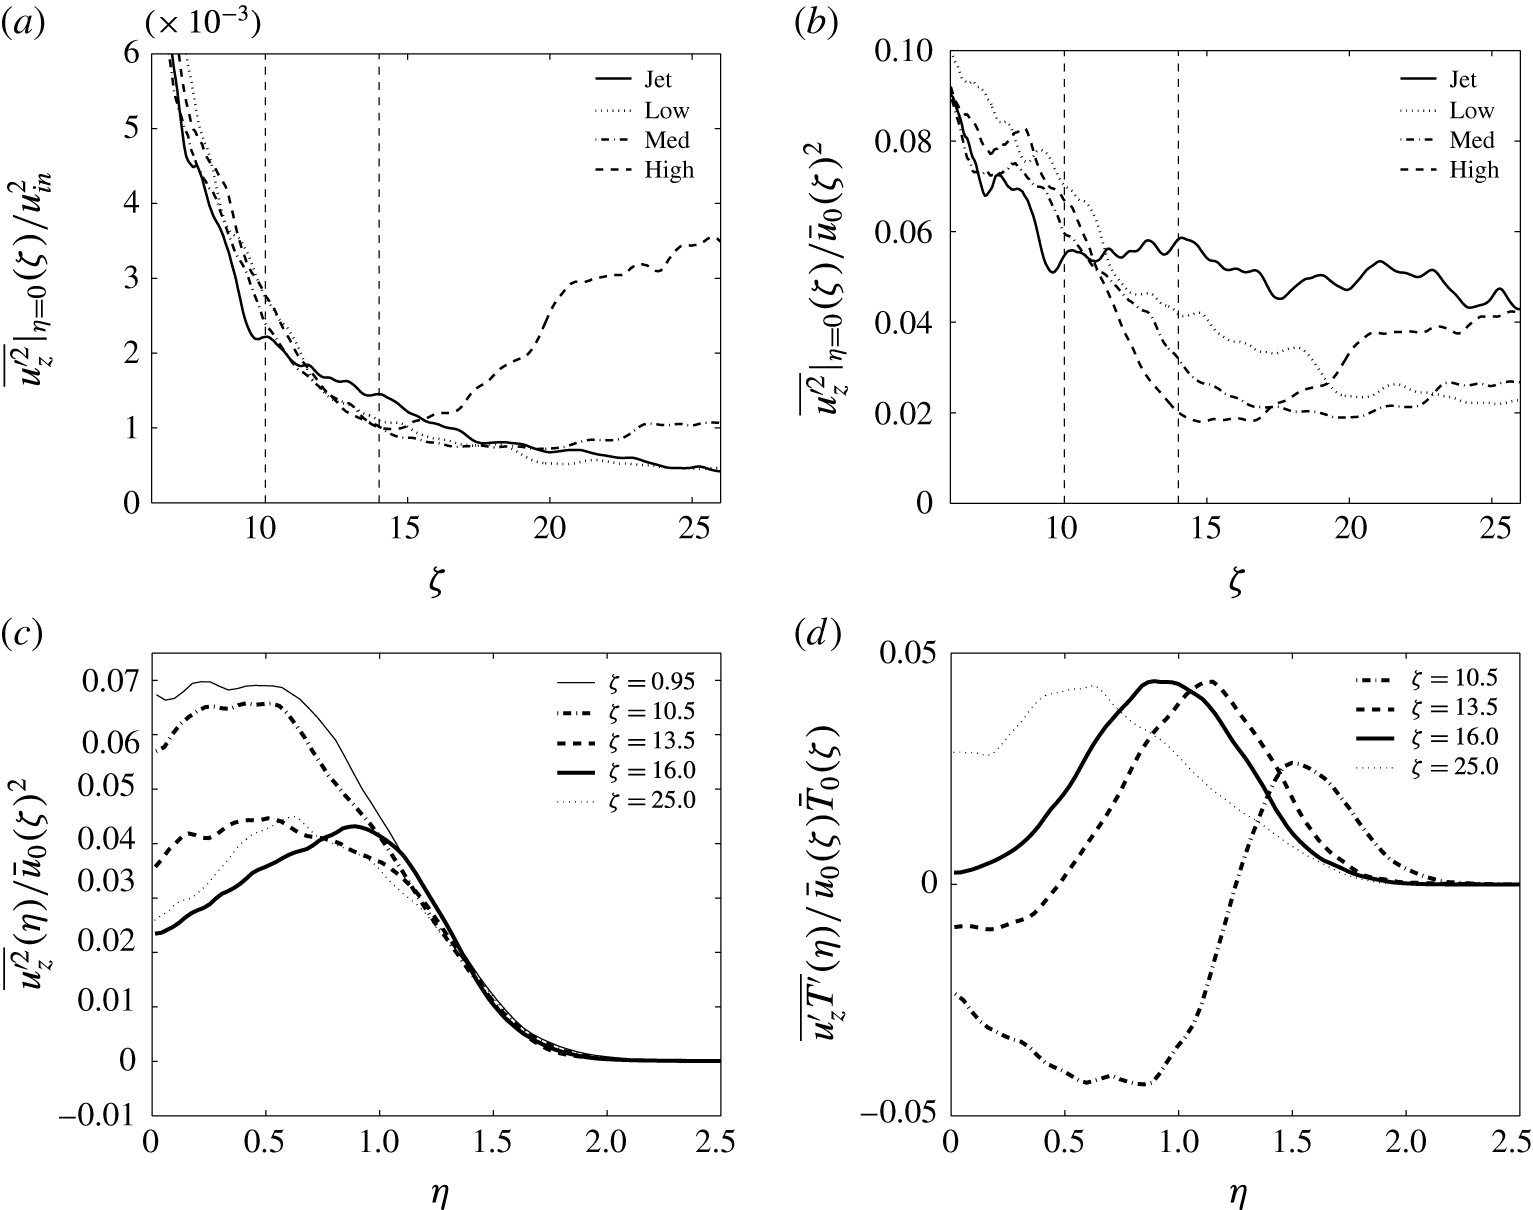
To examine Hunt’s proposal (Hunt Reference Hunt, Davies and Valente1994), the streamwise evolution of the centreline streamwise velocity fluctuation is presented in figure 7(a), normalised by the (constant) inflow velocity; the evolution is expected to follow the square of the inverse distance from the source in the Jet case. Note that statistical convergence is weaker here because the quantity is a second-order correlation compounded by evaluation at the centreline (rather than integrating). It is difficult to identify any clear response to heating, but the strongest heating rate appears to lead to an increase in the velocity fluctuations downstream from the HIZ. Figure 7(b) presents the same data normalised by the position-dependent characteristic velocity, which is expected to be a constant in the unperturbed jet. Here, there is a much clearer response to heating. Specifically, there is a decrease in the normalised turbulent transport of streamwise momentum with heating, increasingly so for stronger heating, and this results primarily from the acceleration of the mean streamwise velocity (i.e. the normalisation). These streamwise fluctuation data are consistent with BN and suggest that Hunt’s original proposal is not confirmed by the data. However, the reworked analysis presented in § 2.5 suggests that it is not the relative turbulent transport of streamwise momentum that should be considered, but the absolute turbulent transport of streamwise momentum; this is considered in more detail below.
Consideration of the radial profiles of streamwise velocity fluctuations, as in figure 7(c), reveals that the situation is more complicated still. Upon heating, there is a strong departure from self-similarity whereby the profile develops a strong off-centre peak; turbulent momentum fluxes inferred from centreline fluctuation values are grossly misleading, and the profiles should be integrated properly. Furthermore, the cause of the off-centre peak can be explained by the velocity–temperature correlation (figure 7 d), which appears as a source term in the transport equation for the streamwise velocity fluctuation. It would appear that the competition between heating and residence time in the HIZ leads to a significant departure from self-similarity, manifest in profiles of mean temperature, radial velocities and streamwise velocity fluctuations.
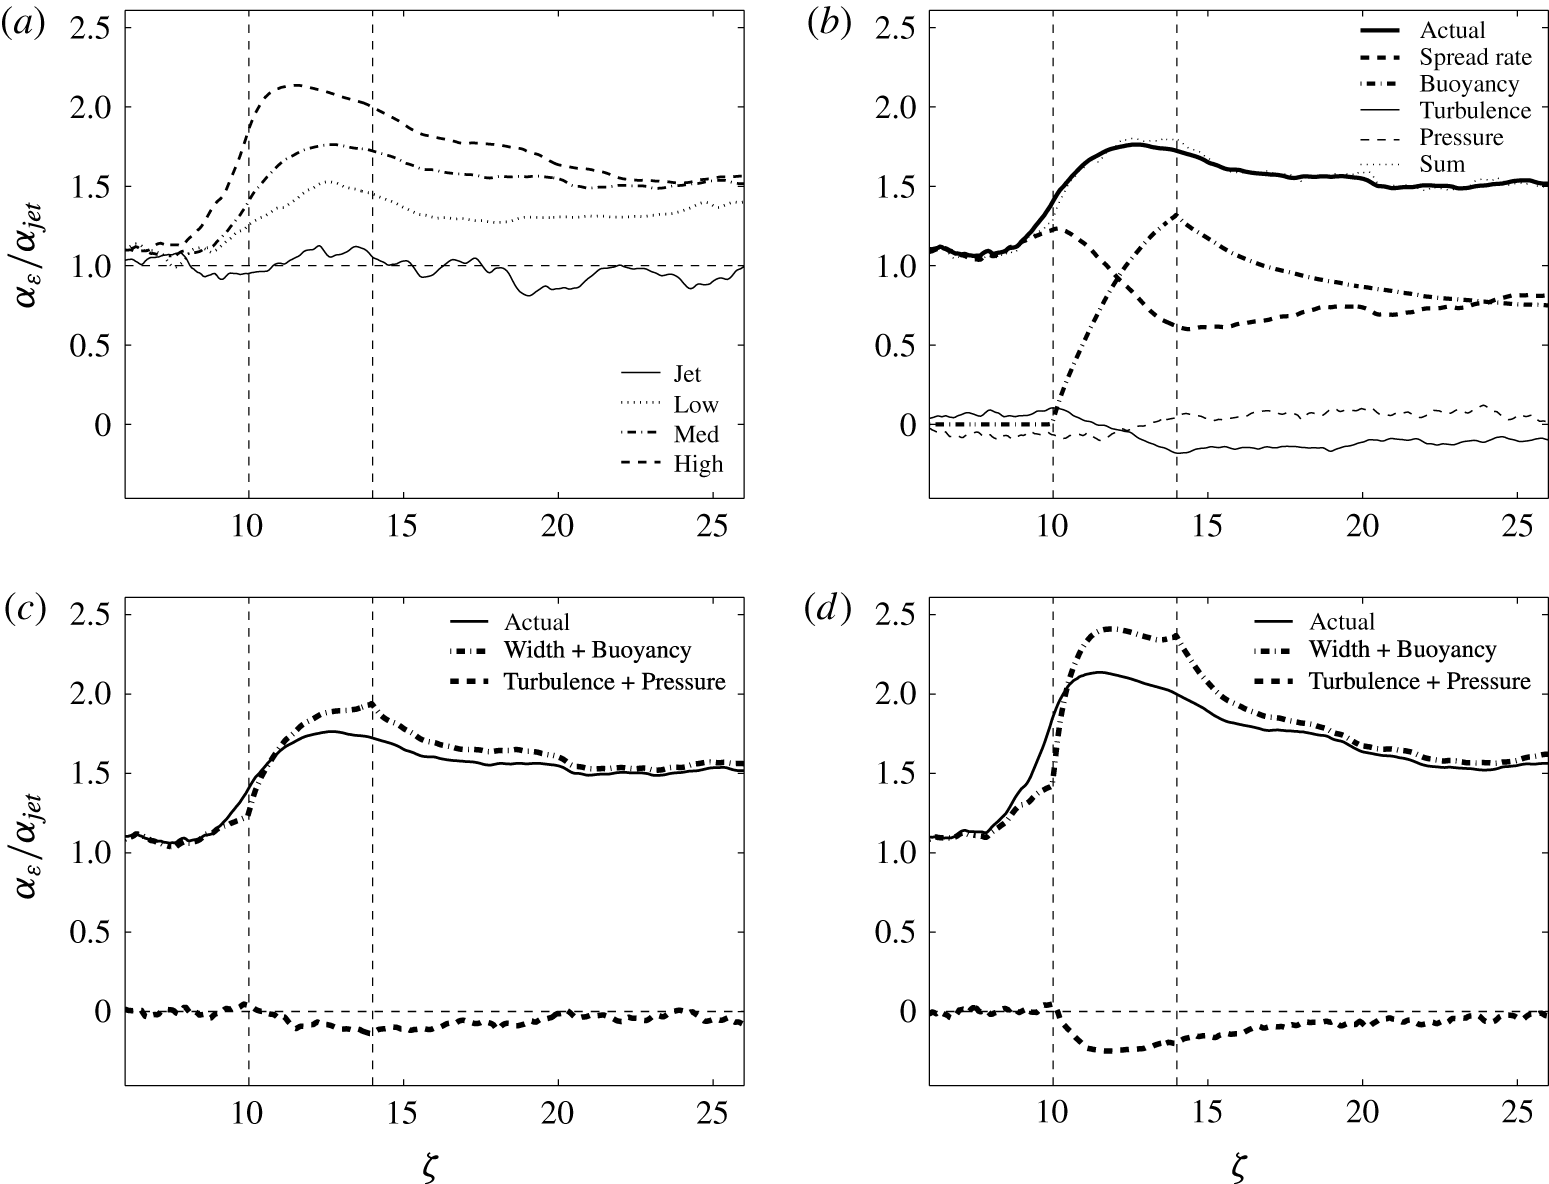
Figure 8. (a) Streamwise evolution of the entrainment coefficient for all four cases. (b) Entrainment decomposition following (2.11) for the Medium case (right). (c,d) Streamwise evolution of the decomposed entrainment coefficient for the Medium and High cases, respectively, with the codependent terms combined (i.e. spread rate plus buoyancy and turbulence plus pressure).
The effects of heating on the entrainment coefficient are compared in figure 8(a), which presents the streamwise evolution of the entrainment coefficient for all four cases; the values have been normalised by a fit to the jet profile to account for development in the near field (refer to the Appendix for further details of the numerical integration approach). In the strongest heating case, the peak value of the entrainment coefficient is twice that observed in the jet. In the post-HIZ, all three values tend towards a value about 50 % greater than that of a jet, more consistent with that of a plume.
The decomposition of the entrainment coefficient (following (2.11)) for the Medium case is presented in figure 8(b). Note how the sum of the components agrees well with the directly measured value, suggesting that the decomposition is consistent; the only noticeable difference is just below the HIZ, where there is an underprediction, which may be a consequence of non-lateral entrainment. Upon heating, the contribution from buoyancy grows to be about 75 % of the total, which contrasts with a significant decrease in the width term. There is an increase in turbulent momentum flux, which leads to a decrease in the contribution to the entrainment coefficient, but it is moderated somewhat by the pressure term, perhaps with a slight lag.
There is an apparent codependence between the spread rate and buoyancy terms as well as between the turbulent and pressure terms; figure 8(c,d) present the streamwise evolution of the entrainment rate decomposition, with the codependent terms combined (both the Medium (c) and High (d) cases are presented). The combined terms give a clearer picture of the two effects (particularly in the High case), and it appears that, as predicted by Hunt, there is indeed an increase in the entrainment coefficient from the buoyancy term, and a decrease from an increase in turbulent momentum flux. There are clear disparities near the boundaries of the HIZ, which may be a result of non-lateral entrainment or approximations in the decomposition.
5 Discussion and conclusions
5.1 Phenomenological summary
Off-source volumetric heating of a turbulent jet arrests the decay in velocity in the HIZ. At the heating rates considered here, the profiles of the mean streamwise velocity and tracer concentration remain essentially self-similar, with distributions that are close to Gaussian, but the acceleration of the jet leads to an increased radial inflow at all radial locations. The increased radial inflow leads to a visual thinning of the jet. There is a competition between heating rate and residence time of the fluid in the HIZ. Near the axis, heating is strong due to high tracer concentration, but the residence time is low due to high velocities. In contrast, towards the edge of the jet, heating is weak because of low concentration, but the residence time is high because of low velocities. The competition between heating and residence time results in an off-centre peak of temperature, possibly because the tracer width is initially broader than the velocity width. Contrasting behaviour is observed between the profile widths of streamwise velocity and the tracer; the increased radial inflow sweeps the tracer towards the axis, but the off-centre temperature peak produces sufficient buoyancy that the velocity profile does not narrow, and may even broaden slightly.
The decomposition of the entrainment coefficient showed that there was also a local increase due to enhanced buoyancy, and a decrease due to an increase in turbulence. The decomposition was found to be inaccurate near the boundaries of the HIZ, which may be a consequence of non-lateral entrainment.
5.2 Discrepancies with the literature?
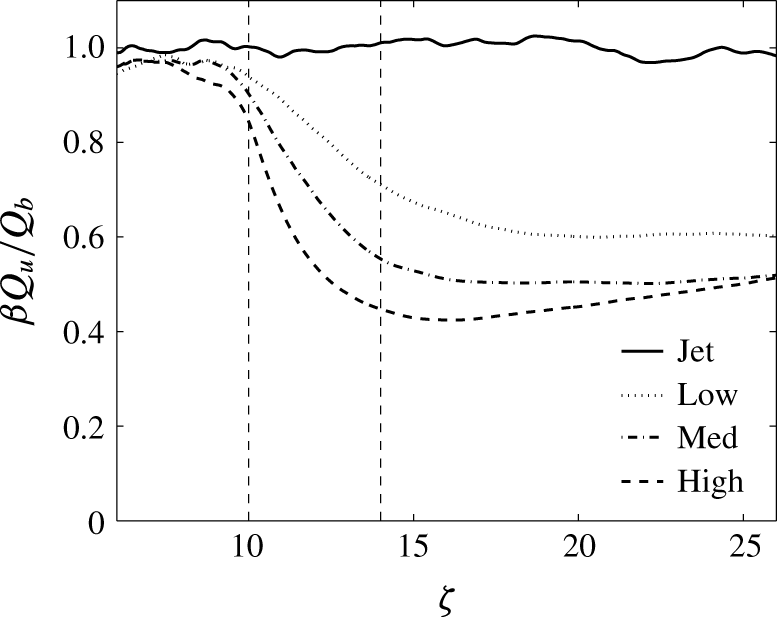
Figure 9. Ratio of mass fluxes based on measurements of velocity and scalar width.
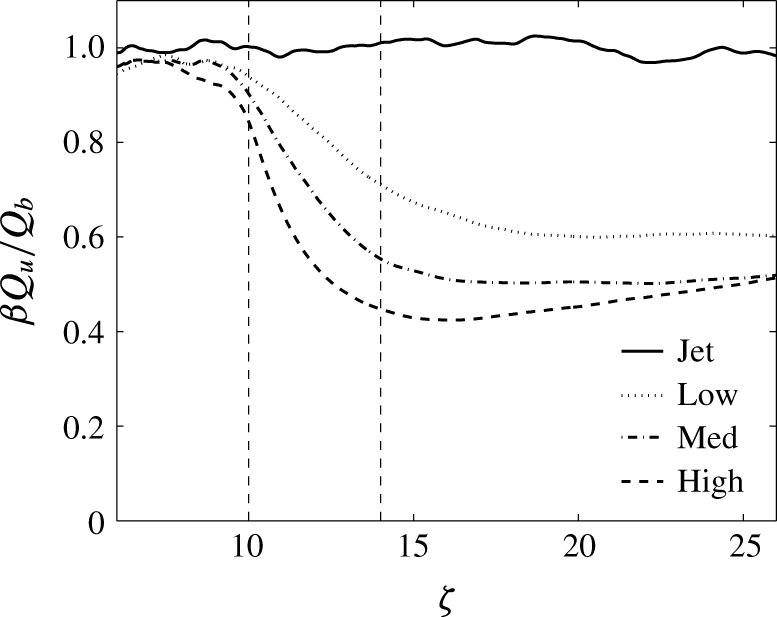
All of the data presented above are consistent with the data in the literature, but there are, however, differences in the interpretation. The key difference is that BN reported a slowing in the rate of increase in mass flux. Experimentally, BN concluded that heating produced a decrease in the growth rate of mass flux. The present simulations show a strong increase in growth. Experimentally, the mass flux was inferred from centreline measurements of velocity and the width of the tracer concentration profile. An interesting observation in the present study (figure 6) is the contrasting behaviour in velocity and scalar widths; a similar observation was alluded to in BN, and was reported by AP, but not taken into account in the analysis. Importantly, this observation has a significant effect on the mass flux measurements. To demonstrate this further, figure 9 compares the ratio of mass fluxes constructed using the velocity and scalar widths; specifically,
![]() $\unicode[STIX]{x1D6FD}Q_{u}/Q_{b}$
, where
$\unicode[STIX]{x1D6FD}Q_{u}/Q_{b}$
, where
![]() $Q_{u}$
and
$Q_{u}$
and
![]() $Q_{b}$
are the mass flux measurements based of velocity and scalar, respectively, and
$Q_{b}$
are the mass flux measurements based of velocity and scalar, respectively, and
![]() $\unicode[STIX]{x1D6FD}$
is a shape constant that normalises the ratio in the jet. It is clear that using the scalar width to infer the mass flux in the heated cases leads to a significant underestimation, potentially exceeding 50 %.
$\unicode[STIX]{x1D6FD}$
is a shape constant that normalises the ratio in the jet. It is clear that using the scalar width to infer the mass flux in the heated cases leads to a significant underestimation, potentially exceeding 50 %.
The decomposition of the entrainment coefficient presented in (2.11) is motivated by Hunt (Reference Hunt, Davies and Valente1994), and so differs from the recent work by van Reeuwijk & Craske (Reference van Reeuwijk and Craske2015), which uses the kinetic energy equation following the approach of Priestley & Ball (Reference Priestley and Ball1955); reconciliation of the two approaches will be considered in future work.
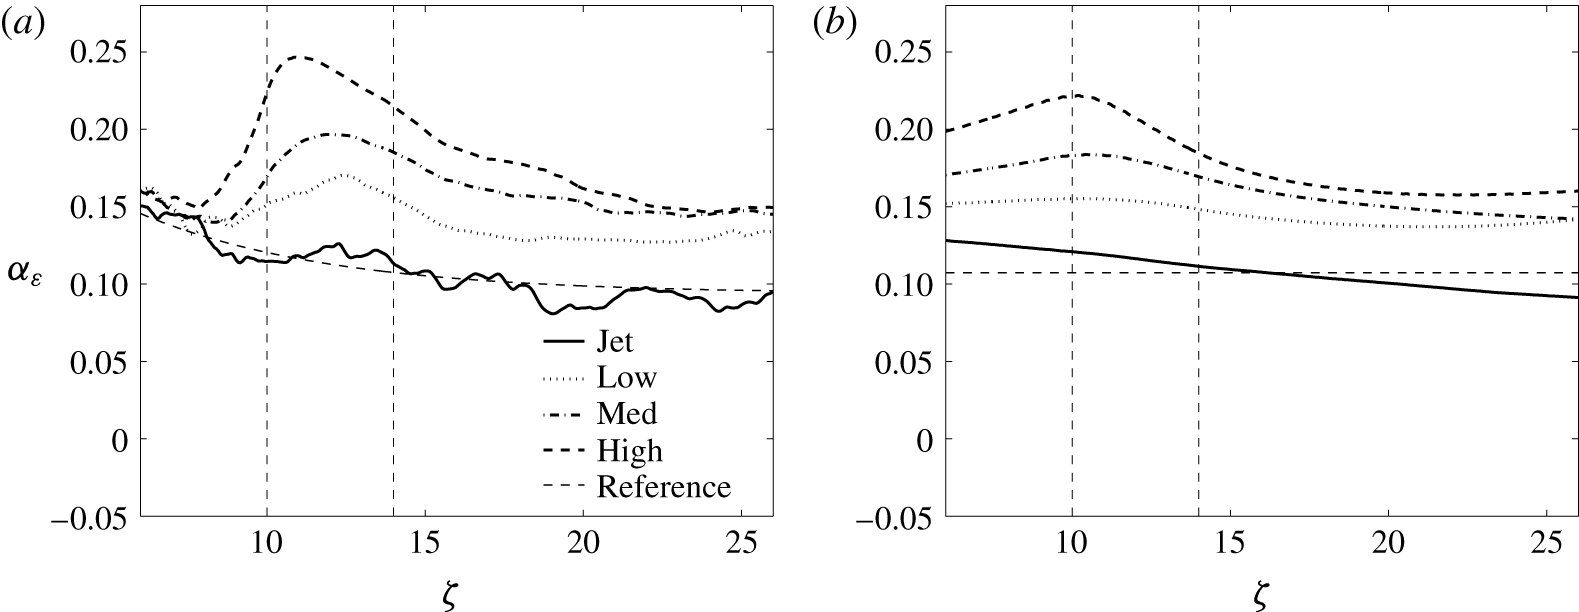
Figure 10. Comparison of entrainment coefficient resulting from radial integration to (a)
![]() $r=2.15b_{u}$
and (b) the edge of the computational domain.
$r=2.15b_{u}$
and (b) the edge of the computational domain.
5.3 Conclusions
A set of numerical simulations of turbulent jets has been presented that examine the effects of off-source heating on entrainment behaviour. Discrepancies with the literature have been reconciled by accounting for changes in self-similarity, differences between scalar and velocity evolution, and a reworking of previous analysis to derive a new decomposition of the factors contributing to entrainment. Off-source heating produces a local increase in the entrainment coefficient due to buoyancy, and a decrease due to an increase in turbulent transport of streamwise momentum, confirming the essence of the proposal of Hunt (Reference Hunt, Davies and Valente1994).
Acknowledgements
A.J.A. was first supported by a CASE Fellowship from the EPSRC and AWE, and then a Glenn T. Seaborg Fellowship from LBNL, and would consequently like to thank D. Youngs and R. Williams for support and computational resources. A.J.A. would also like to thank J. Hunt for motivating this work, along with C. Caulfield, M. Andrews and A. Almgren. J.B.B. was supported by the DOE Applied Mathematics Research Program of the DOE Office of Advanced Scientific Computing Research under the U.S. Department of Energy Contract no. DE-AC02-05CH11231, which included computational resources at the National Energy Research Scientific Computing Center (NERSC).
Appendix
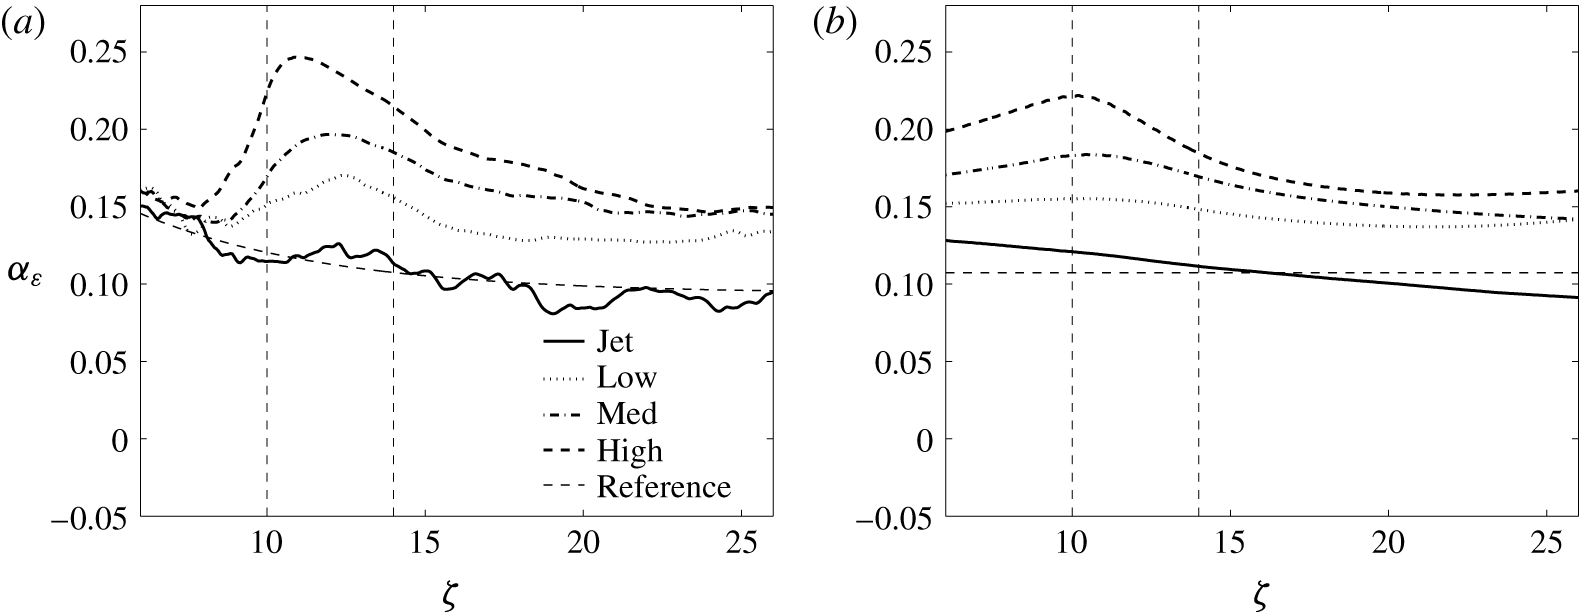
This appendix describes the numerical approach used to evaluate the fluxes when deriving the entrainment coefficient. The results presented in § 4 use fluxes that integrate velocity profiles to a radius of 2.15 times the characteristic width, corresponding to approximately 1 % of the centreline value of a Gaussian distribution (consistent with Craske & van Reeuwijk (Reference Craske and van Reeuwijk2016), for example). Figure 10 compares the entrainment coefficient (i.e.
![]() $\unicode[STIX]{x1D6FC}_{\unicode[STIX]{x1D700}}=(2\unicode[STIX]{x03C0}b_{u}\bar{u}_{0})^{-1}\text{d}Q/\text{d}z$
) that results from this approach (a) with that from integrating over the whole plane in the computational domain (b). The former approach presents more noise, but it is argued to be more representative of entrainment into the jet. The jets are clearly still developing at low heights (something that cannot be avoided in simulations of this scale), and so a reference profile was established by best fit to a decaying exponential profile, which was used for normalisation purposes in the main body of the paper. An interesting observation is that the increase in entrainment below the HIZ is smeared out with the second strategy, anomalously suggesting a global increase in entrainment.
$\unicode[STIX]{x1D6FC}_{\unicode[STIX]{x1D700}}=(2\unicode[STIX]{x03C0}b_{u}\bar{u}_{0})^{-1}\text{d}Q/\text{d}z$
) that results from this approach (a) with that from integrating over the whole plane in the computational domain (b). The former approach presents more noise, but it is argued to be more representative of entrainment into the jet. The jets are clearly still developing at low heights (something that cannot be avoided in simulations of this scale), and so a reference profile was established by best fit to a decaying exponential profile, which was used for normalisation purposes in the main body of the paper. An interesting observation is that the increase in entrainment below the HIZ is smeared out with the second strategy, anomalously suggesting a global increase in entrainment.


