The use of test-day (TD) milk yield records to model the lactation curve is important in dairy cattle systems since it helps dairy producers to make decisions on feeding and reproductive management, culling of animals and selection programmes. Knowledge of two attributes of the lactation curve is important in taking these decisions, i.e. the lactation peak and lactation persistency. Compared with cows' milk, buffalo milk has a higher percentage of all components, such as protein and fat, and lower cholesterol content (Rosati & Van Vleck, Reference Rosati and Van Vleck2002; Zicarelli, Reference Zicarelli2004). Despite these advantages, buffalo milk yield is still much lower than that of cows and short lactation length is common in buffaloes (Tonhati et al. Reference Tonhati, Cerón-Muñoz, Oliveira, El Faro, Lima and Albuquerque2008).
Several definitions and approaches to describe lactation curves are reported in the literature. One widely used method is the modelling of lactation curves using mathematical functions, such as the Wilmink and Ali & Schaeffer functions (Wilmink, Reference Wilmink1987a; Ali & Schaeffer, Reference Ali and Schaeffer1987). In this sense, Macciotta et al. (Reference Macciotta, Vicario, Dimauro and Cappio-Borlino2004) applied the Wilmink function to model TD records of milk yield of Italian river buffaloes. These parametric functions allow the estimation of the rate of milk yield increase until lactation peak, as well as the rate of decline after the lactation peak, with the measurement of persistency being based on milk production.
Another method proposed to study lactation curves is based on the combination of TD milk yield records obtained at different stages of lactation and the analysis of the relationships between cumulative yields or measures of TD milk yield variation (Swalve, Reference Swalve1995). However, this method does not characterize persistency in a unique manner because it is not invariant in terms of the time period chosen (Rekaya et al. Reference Rekaya, Weigel and Gianola2001). The main disadvantage of this method is that it attributes arbitrary relative values to weighted TD milk yield records obtained at different stages of lactation (Haile-Mariam et al. Reference Haile-Mariam, Bowman and Goddard2003). Another problem encountered is that a large number of parameters have to be estimated, and problems of modelling the records at the extremes of the lactation curve are common (Jamrozik et al. Reference Jamrozik, Schaeffer and Dekkers1997).
The application of multivariate methods, such as principal component analysis or factor analysis, have been proposed by Wilmink (Reference Wilmink1987b), Pool et al. (Reference Pool, Janss and Meuwissen2000), Macciotta et al. (Reference Macciotta, Vicario, Dimauro and Cappio-Borlino2004) and Macciotta et al. (Reference Macciotta, Vicario and Cappio-Borlino2006) to obtain latent variables that describe the shape of the lactation. Factor analysis can be applied to explain all covariances or correlations using few unobserved variables, called common latent factors. In this model, each variable is represented by a linear function of unobserved factorial variables (common factors) and by a single specific latent variable, which contribute only to the variances of variables included in the model. Although there are some studies on using factor analysis for breeding purposes in dairy cattle (Macciotta et al. Reference Macciotta, Vicario and Cappio-Borlino2006; Yilmaz et al. Reference Yilmaz, Eyduran, Kaygisiz and Javed2011), published reports using this approach to describe the shape of the lactation curve in other species such as buffaloes are scarce. The objective of the present study was to apply multivariate factor analysis to extract new variables that describe the shape of lactation curves in dairy buffaloes, based on the phenotypic correlation matrix of monthly TD milk yield records. In addition, the genetic association between these new variables and cumulated 270-d milk yield was evaluated using Bayesian inference.
Materials and Methods
Data and database consistency
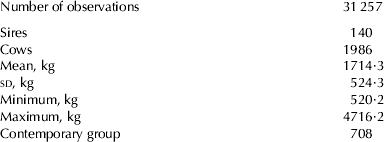
A total of 31 257 monthly TD milk yield records obtained from 3798 lactations of Murrah buffaloes, daughters of 140 bulls, belonging to 12 herds located in the state of São Paulo, whose calving records comprised the period from 1998 to 2007, were analysed. It was considered that the first TD milk yield record was measured from 5th to 45th day after calving. Cow age varied from 2 to 7 years. There were 1052, 906, 751, 622 and 467 lactations of first, second, third, fourth and fifth parities, respectively. The TD milk yield records were divided into monthly classes of days in lactation (classes 1 to 10).
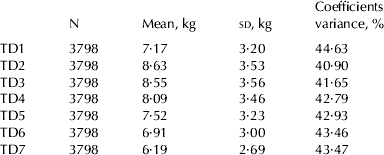
The first seven monthly TD records were considered for the factor analyses, since the number of TD records decreased after the 7th lactation month (Table 2). Only animals that had the first seven TD records were included in the analysis, since this is a basic requirements of multivariate analysis. The general structure of the data is shown in Table 1. To obtain the cumulated 270-d milk yield, the lactations were adjusted using the method proposed by Tonhati et al. (Reference Tonhati, Muñoz, Duarte, Reichert, Oliveira and Lima2004), and lactations with a length above 270-d were truncated at this point. Lactations shorter than 90 d were deleted.
Table 1. Structure and descriptive statistics of the milk yield records

Factor analysis and latent variables
Considering each monthly TD milk yield record to be a distinct trait, the model of common factors can be expressed in matrix form as follows:
where y, f and ε are p-dimensional vectors corresponding to TD milk yield records, a vector (m×1) of latent common factors, and a vector of errors, respectively, and Λ is a matrix (p×m) of coefficients known as factor loadings. Using orthogonal factors, the following assumptions were established:
Where, Σ=(co)variance matrix between TD milk yield records and Ψ=identity matrix of residual (co)variance. Statistica software (2007) was used for the extraction of latent factors by the maximum likelihood method and rotation was performed by the varimax technique. The factors are represented in a Cartesian coordinate system with two axes. In the present study, two factors were chosen as proposed in the studies of Macciotta et al. (Reference Macciotta, Vicario, Dimauro and Cappio-Borlino2004, Reference Macciotta, Vicario and Cappio-Borlino2006).
Quantitative genetic analysis
The (co)variance components for two common latent factors and cumulated 270-d milk yield were estimated by Bayesian multi-trait analysis using the GIBBS2F90 program (Misztal, Reference Misztal2007). The contemporary group for studied traits was defined as animals that calved in the same herd, year and season (season=1 from April to September and season=2 from October to March). The CG with less than 5 lactations (animals) were deleted from the analyses. The animal model included the following fixed effects: contemporary group, number of milkings per day (two levels), and age of buffalo cow at calving (linear and quadratic effect), ranging from 2 to 6 years, as covariate. The additive genetic, permanent environmental and residual effects were included as random effects in the model. The matrix form of the complete model can be written as follows:
where y, β, a, p, and e are vectors of observations, fixed, direct additive genetic, permanent environmental and residual effects, respectively, and X, Z and W are incidence matrices of fixed effects and direct additive genetic and permanent environmental random effects, respectively. A uniform distribution was defined a priori for the fixed effects (β), which reflects vague prior knowledge about this vector. Gaussian distributions were used for random effects and an inverse Wishart distribution for the (co)variance components:
![$$\openup4\matrix{ {b \propto constant}\hfill & {a|G\sim MVN[0,(G \otimes A)]}\hfill \cr {p|P\sim MVN[0,(P \otimes I_n )]}\hfill & {G|S_g, v_g \sim IW[S_g v_g, v_g ]{\rm}}\hfill \cr {P|S_p, v_p \sim IW[S_p v_p, v_p ]}\hfill & {R|S_r, v_r \sim IW[S_r v_r, v_r ]}\hfill \cr} $$](https://static.cambridge.org/binary/version/id/urn:cambridge.org:id:binary:20160920232449650-0246:S0022029911000823:S0022029911000823_eqnU4.gif?pub-status=live)
where A, G, P, R, and I n correspond to (co)variance matrices of direct additive genetic, permanent environmental and residual effects, relationship matrix, and identity matrix, respectively; ⊗ is the Kronecker direct product operator, and Sg and vg, Sp and vp, and S r and v r are a priori values and the degrees of freedom for additive genetic, permanent environmental and residual (co)variances, respectively.
After a burn-in period of 100 000 cycles, 2 000 000 samples were generated using a sampling interval of 50 cycles. Next, the Gibanal program (Van Kaam, Reference Van Kaam1997) was used for the analysis of convergence and to obtain estimates derived from independent samples. For the description of posterior distributions, the mean was used as a point estimate and the highest posterior density interval as a measure of dispersion.
Results and Discussion
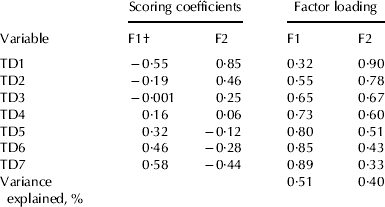
The scoring coefficients and factor loading of the two factors after rotation are shown in Table 3. The factor loadings are coefficients of correlation between each factor and each TD milk yield record. Factor loadings higher than 0·65, in absolute values, pointed out the strongest indicators associated with each factor. The results show that factor analysis was able to extract two latent factors from the phenotypic correlation matrix of TD milk yield records, which explain 91% of the original variance of the data (Table 3). Similar results were reported by Macciota et al. (Reference Macciotta, Vicario and Cappio-Borlino2006) and Yilmaz et al. (Reference Yilmaz, Eyduran, Kaygisiz and Javed2011), who reported that two factors explained 80·0% and 82·8% of variance data, using the same approach applied in the present study for 7 TD and 10 TD milk yield records, in Simmental and Brown Swiss cattle, respectively.
The first latent factor (F1) was positively and strongly correlated with the last three TD, indicating a relationship with the rate of milk yield decline after lactation peak. In milking buffaloes, the lactation peak normally occurs 2 months after calving (Tonhati et al. Reference Tonhati, Cerón-Muñoz, Oliveira, El Faro, Lima and Albuquerque2008; Aspilcueta et al. Reference Aspilcueta-Borquis, Bignardi, Seno, Camargo, Muñoz-Berrocal, Albuquerque, Di Palo and Tonhati2010). Thus, it can be stated that the second latent factor (F2) was associated with the rate of milk yield increase to the peak of lactation, since this factor was strongly associated with the first two monthly TD (TD1 and TD2). The association was stronger with TD1 (0·90), and slightly weaker with TD2 (0·78). Given that the within-variance for TD1 and TD2 is approximately the same (Table 2), an increase in F2 is expected to lead to a similar increase in the 2 monthly test-day associations, just a little stronger for TD1. This means that an increase in F2 involves a greater increase in pre-peak milk yield (level of production in early lactation) and a smaller increase in peak milk yield. Furthermore, the scoring coefficients confirm these results (Table 3).
Table 2. Descriptive statistics and number (N) of the test-day milk yield records (TD)

Table 3. Scoring coefficients and factor loading between test-day (TD) milk yield records and latent variables and variance explained by the factors

† F1: latent factor related to lactation persistency; F2: latent factor related to lactation peak
Similar results have been reported in dairy cattle by Macciotta et al. (Reference Macciotta, Vicario and Cappio-Borlino2006) and Yilmaz et al. (Reference Yilmaz, Eyduran, Kaygisiz and Javed2011), who identified two latent factors at the phenotypic level, the first associated with lactation peak and the second one related with persistency of lactation. Although Macciotta et al. (Reference Macciotta, Vicario and Cappio-Borlino2006) reported heritability estimate for the factor associated with lactation peak, the factors estimated in the present study could not express the same thing, owing to different correlations between common latent factors and the first three TDs. There are several differences between the lactation curve in buffaloes and the lactation curve dairy cattle. In buffaloes, the lactation peak is less noticeable or accentuated and short-length lactations are common. Probably these aspects affect the results obtained in the present study with factor analyses as well as the comparisons between factor analyses results between dairy cattle and buffaloes.
The genetic parameter estimates for cumulated 270-d milk yield and the latent factors (F1 and F2) are shown in Table 4. The heritability estimate for cumulated 270-d milk yield was moderate, indicating that this trait should respond to selection. Studies on Murrah buffaloes conducted in Brazil have reported heritability estimates for cumulated 305-d milk yield close to that found in the present investigation (0·22) (Tonhati et al. Reference Tonhati, Cerón-Muñoz, Oliveira, El Faro, Lima and Albuquerque2008). In contrast, lower estimates have been reported by Rosati & Van Vleck (Reference Rosati and Van Vleck2002) (0·14) for an Italian buffalo breed, and by Thevamanohar et al. (Reference Thevamanoharan, Vandepitte, Mohiuddin and Shafique2000) (0·17) for Pakistani Nili-Ravi buffaloes.
Table 4. Estimates of variance components and genetic parameters for cumulative milk yield and common factors (F1 and F2)

† Parameters: σa2=additive genetic variance; σap2=variance attributed to permanent environmental effects; σr2=residual variance; σp2=phenotypic variance; h2=heritability; c2=proportion of total variance due to permanent environmental effects; HPD=highest posterior density interval; LL=lower limit; UL=upper limit
The heritability estimate for F1 was low, suggesting that the lactation curve after the lactation peak can be modified, in the long term, by selection. Studies estimating heritabilities for lactation persistency in buffaloes are scarce. In this respect, Chaves et al. (Reference Chaves, Daher, Schierholt, Araújo, Dib Taxi, Silva, Brito, Oliveira, Torres and Tonhati2010) using random regression models and various measures of persistency obtained between 30 and 280 d of lactation, obtained heritability estimates ranging from 0·16 and 0·37 in dairy buffaloes. Applying a multivariate approach, similar to that proposed in the present study, Macciotta et al. (Reference Macciotta, Vicario and Cappio-Borlino2006), using factor and principal component analysis related to persistency, reported heritability estimates for persistency of 0·13 (factor analysis) and 0·07 (principal component analysis) in Italian Simmental cows. Also, Yilmaz et al. (Reference Yilmaz, Eyduran, Kaygisiz and Javed2011) obtained a similar heritability estimate for persistency (0·15), from factor analysis defining latent variables for lactation curves, in Brown Swiss cattle. In dairy cattle, Van der Linde et al. (Reference Van der Linde, Groen and de Jong2000) and Muir et al. (Reference Muir, Fatehi and Schaeffer2004) defined lactation persistency as the Wilmink b parameter for milk yield, and obtained heritability estimates for persistency, ranging from 0·15 to 0·18. Applying random regression models using various measures of persistency, Cobuci et al. (Reference Cobuci, Euclydes, Costa, Lopes, Torres and Pereira2004) and Dorneles et al. (Reference Dorneles, Rorato, Cobuci, Lopes, Weber and Oliveira2009) obtained heritability estimates for persistency ranging from 0·05 to 0·27, in dairy cattle.
The heritability estimated for latent factor F2 was low, suggesting that selection response to modify the rate of milk yield increase until lactation peak, would be slow. No heritability estimates for this trait have been reported in the literature for dairy buffaloes. In dairy cattle, Macciotta et al. (Reference Macciotta, Vicario and Cappio-Borlino2006) and Yilmaz et al. (Reference Yilmaz, Eyduran, Kaygisiz and Javed2011) using factor analyses to describe the lactation curve, reported low heritability estimates, 0·13 and 0·13, respectively, for the common latent factor related to level of production in early lactation.
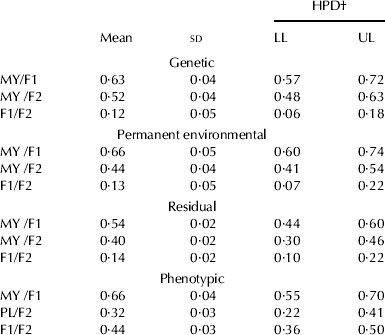
The estimates of genetic and phenotypic correlations between the two factors (F1 and F2) and cumulated 270-d milk yield are shown in Table 5. The genetic correlation between milk yield and F1 was moderate and similar to that reported by Macciotta et al. (Reference Macciotta, Vicario and Cappio-Borlino2006) for dairy cattle (0·61). However, Yilmaz et al. (Reference Yilmaz, Eyduran, Kaygisiz and Javed2011) with a small data set, reported higher genetic correlation estimate (1·0) between lactation persistency (second latent factor) with 305-d milk yield in Brown Swiss cattle. Applying other approaches to assess lactation persistency, a wide variation in the genetic correlation estimates between milk yield and persistency has been reported in the literature (0·0 to 0·60) (Rekaya et al. Reference Rekaya, Carabano and Toro2000; Van der Linde et al. Reference Van der Linde, Groen and de Jong2000; Muir et al. Reference Muir, Fatehi and Schaeffer2004). The results obtained in the present study suggest that selection for higher cumulated 270-d milk yield should result in an increase of lactation persistency.
Table 5. Estimates of genetic, permanent, residual and phenotypic correlations between cumulative milk yield (MY) and common factors (F1 and F2)

† HPD=highest posterior density interval; LL=lower limit; UL=upper limit
The genetic correlation between cumulated 270-d milk yield and F2 was moderate, indicating that selection for cumulated 270-d milk yield should raise the rate of milk yield increase to the lactation peak. Higher genetic correlations between milk yield and latent factors associated with lactation peak have been reported in dairy cattle by Macciotta et al. (Reference Macciotta, Vicario and Cappio-Borlino2006) (0·67) and Yilmaz et al. (Reference Yilmaz, Eyduran, Kaygisiz and Javed2011) (0·66). The genetic correlation between the latent factors (F1 and F2) was low and lower than those observed by Macciotta et al. (Reference Macciotta, Vicario and Cappio-Borlino2006) (0·26). The low correlation between the two lactation traits indicates that it may be possible, to a certain extent, to independently modify specific aspects of the lactation curve. The results of the present study are relevant since, compared with cattle, total milk yield of buffaloes is lower, the lactation length is shorter and the lactation peak is less accentuated, thus selection on the basis of total milk yield would modify components of the lactation curve as a correlated response. The present results will bring support to dairy producers to select animals in order to modify the lactation curve of dairy buffaloes through factors describing this curve.
Conclusion
Multivariate statistics employing factor analysis allowed the extraction of two variables (latent factors) that described the shape of the lactation curve. It is expected that the response to selection to increase lactation persistency is higher than the response obtained to selecting animals to increase lactation peak. Selection for higher total milk yield would result in a favourable correlated response to increase the level of production in early lactation and the lactation persistency.