


INTRODUCTION
The NIHTB for the Assessment of Neurological Behavior and Function Cognition is designed to be comprised of sensitive measures to evaluate cognitive, social, emotional and motor functioning across the lifespan (Gershon et al., Reference Gershon, Cella, Fox, Havlik, Hendrie and Wagster2010). In particular, the NIHTB Cognition Battery (NIHTB-CB) was designed to evaluate Processing Speed (PS), Executive Function, Episodic Memory, Working Memory, and Language, in less than 30 min. This manuscript focuses on the NIHTB Pattern Comparison Processing Speed Test, as well as preliminary work creating a composite index of processing speed using both this test and other measures of processing speed from within the NIHTB-CB. We discuss the theoretical rationale for the development of the NIHTB Pattern Comparison Processing Speed Test, beginning with a definition of PS and a brief discussion of its various forms. We provide a review of the literature of this construct across the lifespan (including the relationship with other cognitive domains and its relevance in clinical populations), and then highlight the relationship between PS and brain structure and function.
PS can be defined as either the amount of time it takes to process a specific quantity of information, or the quantity of information that can be processed within a specified unit of time (Kalmar & Chiaravalloti, Reference Kalmar and Chiaravalloti2008). Processing speed has been recognized as a major factor of intelligence and individual abilities since the late 1800s (see Coyle, Pillow, Snyder, & Kochunov, Reference Coyle, Pillow, Snyder and Kochunov2011; O’Brien & Tulsky, Reference O’Brien and Tulsky2008) with substantial evidence that PS plays an important role in other aspects of cognition (DeLuca, Chelune, Tulsky, Lengenfelder, & Chiaravalloti, Reference DeLuca, Chelune, Tulsky, Lengenfelder and Chiaravalloti2004; Dempster, Reference Dempster1981; Siegel, Reference Siegel1994).
The traditional study of PS fosters a conceptualization of PS as a unitary construct. However, evidence exists indicating that PS, in fact, is not a unitary construct and can be divided into separate “simple” and “complex” factors, with measures of each having very little shared variance (Chiaravalloti, Christodoulou, Demaree, & DeLuca, Reference Chiaravalloti, Christodoulou, Demaree and DeLuca2003). Measures of simple PS, such as reaction time, assess basic elements of attention and concentration requiring the recognition of a stimulus and a simple motor response. Measures of complex PS in contrast require more complex processes of attention and concentration, as well as mental manipulation.
The cognitive “skill” PS is evident from a very young age. PS can be considered a basic aspect of the child’s developing cognitive architecture, one that is partially based on biological processes (Kail, Reference Kail2008). Importantly, PS is believed to underlie development in other cognitive domains as well (Flavell, Reference Flavell1992) and is important to the development of other cognitive abilities (Dempster, Reference Dempster1981; Siegel, Reference Siegel1994). Research has shown that age improves PS independent of task type from childhood through young adulthood (Hale, Reference Hale1990; Kail, Reference Kail1991). However, performance on PS tasks has been found to deteriorate after young adulthood (Cerella & Hale, Reference Cerella and Hale1994; Chaytor & Schmitter-Edgecombe, Reference Chaytor and Schmitter-Edgecombe2004) and even more so in advanced age (Salthouse, Reference Salthouse1985, Reference Salthouse1990, Reference Salthouse1993; Schaie, Reference Schaie1989, Reference Schaie1994). Slowed PS has been associated with “normal aging” (as opposed to disease conditions), with decreases in PS being a significant contributor to an age-related decline in test scores in other cognitive domains (Finkel et al., Reference Finkel, Mintzer, Dysken, Krishnan, Burt and McRae2004; Salthouse & Coon, Reference Salthouse and Coon1993; Sliwinski & Buschke, Reference Sliwinski and Buschke1997; Zimprich & Martin, Reference Zimprich and Martin2002). PS declines have also been found to impact several aspects of mobility in older age groups including driving skills and gait.
PS has been shown to be highly vulnerable to brain damage;multiple clinical populations demonstrate diminished PS. These populations include traumatic brain injury, Multiple Sclerosis, Parkinson’s disease, symptomatic HIV, Chronic Fatigue Syndrome, dementia, sickle cell anemia, and schizophrenia (Chiaravalloti et al., Reference Chiaravalloti, Christodoulou, Demaree and DeLuca2003; DeLuca, Christodoulou et al., Reference DeLuca, Christodoulou, Diamond, Rosenstein, Kramer and Natelson2004; Demaree, DeLuca, Gaudino, & Diamond, Reference Demaree, DeLuca, Gaudino and Diamond1999; Gronwall & Wrightson, Reference Gronwall and Wrightson1981; Lengenfelder et al., Reference Lengenfelder, Bryant, Diamond, Kalmar, Moore and DeLuca2006; Lezak, Reference Lezak1995; Llorente et al., Reference Llorente, Miller, D’EliaD’Elia, Selnes, Wesch, Becker and Satz1998; Madigan, DeLuca, Diamond, Tramontano, & Averill, Reference Madigan, DeLuca, Diamond, Tramontano and Averill2000; Martin, Donders, & Thompson, Reference Martin, Donders and Thompson2000; Sawamoto, Honda, Hanakawa, Fukuyama, & Shibasaki, Reference Sawamoto, Honda, Hanakawa, Fukuyama and Shibasaki2002; Tiersky, Johnson, Lange, Natelson, & DeLuca, Reference Tiersky, Johnson, Lange, Natelson and DeLuca1998; Vichinsky et al., Reference Vichinsky, Neumayr, Gold, Weiner, Rule and Truran2010). PS measures are the most sensitive of neuropsychological tests, typically able to differentiate between clinical groups and healthy groups (Donders, Tulsky, & Zhu, Reference Donders, Tulsky and Zhu2001; Martin et al., Reference Martin, Donders and Thompson2000). However, PS deficits do not present in isolation. Slowed PS can negatively affect other cognitive test scores such as those for general intelligence (Coyle et al., Reference Coyle, Pillow, Snyder and Kochunov2011), verbal abilities (Sherman, Strauss, & Spellacy, Reference Sherman, Strauss and Spellacy1997), long long-term memory (DeLuca, Barbieri-Berger, & Johnson, Reference DeLuca, Barbieri-Berger and Johnson1994; DeLuca, Gaudino, Diamond, Christodoulou, & Engel, Reference DeLuca, Gaudino, Diamond, Christodoulou and Engel1998; Gaudino, Chiaravalloti, DeLuca, & Diamond, Reference Gaudino, Chiaravalloti, DeLuca and Diamond2001), visuospatial skills, and working memory (Chiaravalloti et al., Reference Chiaravalloti, Christodoulou, Demaree and DeLuca2003; Demaree et al., Reference Demaree, DeLuca, Gaudino and Diamond1999). In everyday life, there is clearly a cost for slowed PS, such as safety risks or occupational hazards due to real-world demands. Additionally, there is research that supports the notion that PS impairment is significantly correlated with decreased quality of life in clinical populations (Barker-Collo, Reference Barker-Collo2006) and to the ability to perform tasks of daily living (Ball & Vance, Reference Ball and Vance2008). Thus deficits in PS have wide-reaching effects that have a direct influence on an individual’s well-being.
Differences in PS are thought to depend on structural aspects of neural wiring, such as nerve diameter, integrity of myelin-sheathing, the number of ion-channels, and the efficiency of synaptic neurotransmission (Posthuma & de Geus, Reference Posthuma and de Geus2008). Research using diffusion tensor imaging has linked white matter change to more rapid processing (Mabbott, Laughlin, Rockel, & Bouffet, Reference Mabbott, Laughlin, Rockel and Bouffet2005). During childhood and adolescence, there are age-related changes in the number of transient connections in the central nervous system (Huttenlocher, Reference Huttenlocher1979) as well as age-related increases in myelinization (Yakovlev & Lecours, Reference Yakovlev and Lecours1967) which lead to faster PS.
Although a fair amount of research has been conducted investigating the neural processes associated with PS, we are only beginning to understand its potential biological substrate (DeLuca, Reference DeLuca2008). Diminished PS has been associated with neurotransmitter activity (e.g., diminished cholinergic function, reduced D2 receptor sites for dopamine and altered glutamate activity), white matter integrity (e.g., increased number of white matter intensities on MRI structural neuroimaging), diminished glucose metabolism, and decreased nerve conduction velocities (e.g., evoked potentials, event-related potentials or ERPs, electroencephalogram or EEG). The most advanced and well accepted theoretical model of the biological substrates of PS is the “neural efficiency model”, most often associated with the study of intelligence (Jensen, Reference Jensen1982; Vernon, Reference Vernon1983, Reference Vernon1987). This model states that a faster central nervous system allows for more rapid processing of information and is related to more efficient processing and higher intelligence. Faster PS allows more information to be processed before it is lost through decay or interference and is therefore more efficient (Jensen, Reference Jensen1993).
Neuroimaging techniques have recently been applied in both healthy individuals and clinical populations to elucidate the relationships between PS and functional brain activity. For example, research using functional magnetic resonance imaging (fMRI) has found a positive relationship between processing speed performance and the activation of the fronto-parietal networks (Forn et al., Reference Forn, Ripolles, Cruz-Gomez, Belenguer, Gonzalez-Torre and Avila2013). Furthermore, increased processing speed demands are associated with greater patterns of connectivity within the fronto-partietal and occipital regions, as well as an increase in the number of functional networks involved. FMRI research has also suggested that processing speed training can improve functional connectivity in healthy controls (Takeuchi et al., Reference Takeuchi, Taki, Hashizume, Sassa, Nagase, Nouchi and Kawashima2011), and that processing speed is related to fiber integrity between the superior putamen and the left motor cortex (Ystad et al., Reference Ystad, Hodneland, Adolfsdottir, Haasz, Lundervold, Eichele and Lundervold2011).
Additional studies of functional connectivity in clinical populations have also afforded us a window to understanding PS deficits. For example, several studies have examined the relationship of PS to functional connectivity in MS. Genova, Hillary, Wylie, Rypma, and colleagues Deluca (Reference Genova, Hillary, Wylie, Rypma and Deluca2009) compared the functional brain activity of individuals with MS to healthy controls during performance of a PS task using BOLD fMRI and found that although there were no differences in performance accuracy, the MS group was significantly slower than the healthy group. While both groups showed similar activation involving the precentral gyrus and occipital cortex, the MS group showed significantly less activity in bilateral frontal and parietal regions, similar to that which has been noted in aging samples. The data indicated that the neural networks involved in processing speed differ between healthy control participants and MS participants, with HCs activating more frontal and parietal regions and person with MS activating insula, thalamus and anterior cingulate regions. Kochunov and colleagues (Reference Kochunov, Coyle, Lancaster, Robin, Hardies, Kochunov and Fox2010) explored the relationship between slowed PS and changes in the cerebral integrity of the frontal lobe via MRI/MRS in 38 healthy adults (age 57–90 years). Two components of PS were extracted from factor analysis of neuropsychological test data: psychomotor (PM) and psychophysical (PP). A substantial fraction of the variance in the PM-PS (58%) was attributed to atrophic changes in frontal white matter, while a smaller proportion (20%) of variance in the PP-PS could be explained by changes in frontal white matter. Smith and colleagues (Reference Smith, Walker, Freedman, Berrigan, Pierre, Hogan and Cameron2012) similarly found a compensatory increase in activation in MS participants compared to healthy controls in the prefrontal cortex and right temporal gyri, with additional areas of decreased activity in MS participants in the left temporal gyri.
A more recent study using functional connectivity to examine neural circuitry during a PS task showed that, while there was a great deal of overlap in the connections relied upon by both persons with MS and healthy controls, the MS group showed significantly more connections from multiple regions to frontal cortices bilaterally relative to healthy controls (Leavitt, Wylie, Genova, Chiaravalloti, & Deluca, Reference Leavitt, Wylie, Genova, Chiaravalloti and Deluca2012). This greater neural recruitment by the MS group relative to healthy controls was interpreted to be consistent with the neural efficiency hypothesis, further supporting the belief that more connections must be recruited to maintain performance in the presence of brain pathology. Similarly, Ready and colleagues (Reference Ready, Baran, Chaudhry, Schatz, Gordon and Spencer2011) noted decreased white matter volume to be significantly correlated with slower processing speed in a sample of healthy midlife children of a parent with Alzheimer's disease. The authors concluded PS and changes in white matter volume to be potential indicators of preclinical decline in Alzheimer’s disease. Using Diffusion Tensor Imaging (DTI), Sasson, Doniger, Pasternak, Tarrasch, and colleagues Assaf (Reference Sasson, Doniger, Pasternak, Tarrasch and Assaf2012) found information processing speed to be correlated with DTI parameters in the cingulum, corona radiata, inferior longitudinal fasciculus, parietal white matter and thalamus.
Other clinical populations have also demonstrated support for similar functional relationships including individuals with ageness of the corpus callosium, individuals with type 1 diabetes mellitus, and individuals with mild cognitive impairment (MCI). For example, individuals with agenesis of the corpus callosium (relative to controls) had significant correlations between processing speed tasks with resting functional connectivity of the left medial and superior temporal lobe (using magnetoencephalographic imaging; Hinkley et al., Reference Hinkley, Marco, Findlay, Honma, Jeremy, Strominger and Sherr2012). In addition, research in individuals with type 1 diabetes mellitus (relative to controls) using resting state fMRI indicated that better processing speed is related to increased connectivity (van Duinkerken et al., Reference van Duinkerken, Klein, Schoonenboom, Hoogma, Moll, Snoek and Diamant2009; van Duinkerken et al., Reference van Duinkerken, Schoonheim, Sanz-Arigita, IJzerman, Moll, Snoek and Barkhof2012). Similar work using fMRI in individuals with MCI (relative to controls) indicated that MCI participants showed less functional connectivity between the posterior cingulate cortex and the right inferior frontal, left fusiform, left rectal, and left precentral regions (Han et al., Reference Han, Arfanakis, Fleischman, Leurgans, Tuminello, Edmonds and Bennett2012). Taken together, these studies indicate that impairments in PS commonly seen in clinical populations are related to changes in brain structure and brain function. This line of research is only beginning to shed light on the intricate relationship between cerebral integrity and processing speed.
Given the complexity of PS development, its intricate relationships with other cognitive domains, and the fact that PS is not a unitary construct, the development of a valid and reliable measure of PS for use in the NIHTB-CB was not a simple task. The NIHTB PS measure was developed to be similar to other traditional processing speed tests (Salthouse, Babcock, & Shaw, Reference Salthouse, Babcock and Shaw1991; Wechsler, Reference Wechsler2008). The task is an extensively researched test of choice reaction time that was able to be easily adapted for computerized administration. Two visual patterns are presented on a computer screen and the examinee is asked to judge if the patterns are the “same” (“Yes” button response) or “not the same” (“No” button response). A slight adaptation made the task completely non-verbal for children under the age of 8, who are asked to indicate these choices with a “smiley” or “frowny” face button. Adequate variability of performance across the full age range of the sample (ages 3–85 years) was assured by altering the type, complexity, and number of stimuli.
Development of the NIHTB Pattern Comparison Processing Speed Test
As mentioned above, the NIHTB Pattern Comparison Processing Speed Test was developed to be similar to other traditional processing speed tests (Salthouse et al., Reference Salthouse, Babcock and Shaw1991; Wechsler, Reference Wechsler2008). Development occurred over three different phases of data collection. During the initial phase of development, eight 3-year-old children and 10 adults (ages 21 to 30) were administered a set of items that varied on one of three dimensions: adding/taking something away, one versus many, or changing positions. Scores reflected the number of correct items (out of a possible 251) completed in 3 min. Children received an average score of 44.4 (SD=12.3; range, 25–59) and made an average of 9.5 errors (SD=12.3; range, 3–13); adults received an average score of 110.8 (SD 18.9) and made an average of 2.4 errors (SD=3.6). Findings from this study also indicated that eight items were potentially problematic for children (i.e., where >50% of participants made errors) the majority of which involved changes in position; therefore, the task was revised to exclude items along this dimension. The task was also revised to include new items that varied on an additional dimension, color.
The second phase of development was conducted on the revised, 2 min version of the task (now including patterns for the following three dimensions: color, adding/taking something away, or one vs. many) in n=138 participants: n=54 children ages 3 to 6, n=39 adults ages 18 to 50, and n=45 older adults ages 65–85. A subset of participants (n=49) also completed a retest within 1 to 3 weeks (n=22 children, n=20 adults, n=7 older adults). We used three different time cut-offs (60, 90, or 120 s) to determine optimal test administration time; performance was comparable regardless of the test administration time. We decided to move ahead using the 90-s version of the test. For this 90-s version, children completed an average of 55.33 items (SD=28.3), young adults completed 129.1 (SD=32.4) and older adults completed an average of 93.7 items (SD=29.3). Test–retest correlations were .81 across the sample, indicating good reliability. In addition, items with less than 75% correct response rates were dropped, and findings provided support for deleting the one versus many discrimination for children ages 3–7 years.
For the third phase of development n=137 participants completed this task (n=26 participants ages 3–4 years, n=24 ages 5–7 years, n=26 ages 8–14 years, n=31 ages 23–35 years, and n=30 ages 65–85 years). Furthermore, 125 individuals completed a retest within one 1 to three 3 weeks (n=25 participants’ ages 3–4 years, n=24 ages 5–7 years, n=15 ages 8–14 years, n=24 ages 23–35 years, and n=20 ages 65–85 years). Test–retest reliability ranged from .46 (for ages 3–4) to .74 (for the older adults). Items with less than 75% correct response rates were dropped for the final version of the measure.
This manuscript presents data supporting the validity and reliability of the final version of this test in the adult sample. In addition, we present preliminary work for a composite measure of processing speed using the NIHTB Pattern Comparison Processing Speed test, as well as the processing speed components of two other NIHTB measures (the Flanker Inhibitory Control Test and the Dimensional Change Card Sort Test). Similar information is provided in another source for the pediatric and child samples (Carlozzi, Tulsky, Kail, & Beaumont, Reference Carlozzi, Tulsky, Kail and Beaumont2013).
METHOD
Participants
The participants in the validation phase are described in detail in Weintraub et al. (this issue). Briefly, the sample consisted of 268 participants ages 20 to 85 years (n=159 ages 20–60 and n=109 ages 65 to 85). Sample recruitment was distributed across age, gender, race, and education strata. A subset of 89 participants (approximately 33%) completed a retest 7 to 21 days later to assess test–retest reliability. All study sites received approval from their local Institutional Review Board before participation in this study.
NIHTB-CB Measures
The NIHTB Pattern Comparison Processing Speed Test requires participants to identify whether two visual patterns are the “same” or “not the same” (responses were made by pressing a “yes” or “no” button). Patterns were either identical or varied on one of three dimensions: color (all ages), adding/taking something away (all ages), or one versus many (only ages 8–15 years; see Figure 1). Scores reflected the number of correct items (of a possible 130) completed in 90 s; as described above, items were designed to minimize the number of errors that were made (i.e., items with less than 75% accuracy during development were not included in the final version of this task). This test takes approximately 3 min to administer.

Fig. 1 Examples of types of discrimination on the NIHTB Pattern Comparison Processing Speed Test.
The NIHTB Flanker Inhibitory Control Test
This test examines the ability to select a visual stimulus and to inhibit responses to distractors and is also described in detail in Zelazo et al. (Reference Zelazo, Anderson, Richler, Wallner-Allen, Beaumont, Conway and Weintraubthis issue). For the composite measure, we examined the mean RT for all Flanker trials (congruent and incongruent).
The NIHTB Dimensional Change Card Sort (DCCS) Test
This test examines cognitive flexibility (i.e., task switching/set shifting) and is also described in detail in Zelazo et al. (Reference Zelazo, Anderson, Richler, Wallner-Allen, Beaumont, Conway and Weintraubthis issue). For the composite measure, we examined the mean RT for all DCCS trials (congruent and incongruent).
The Processing Speed Composite
Processing Speed Composite was derived from two the NIHTB Dimensional Change Card Sort (DCCS) and the NIHTB Flanker Inhibitory Control Test (mentioned above). For the composite measure, we extracted mean RT for all congruent and incongruent trials.
Validation Measures
WAIS-IV Coding (Wechsler, Reference Wechsler2008)
This test requires the participant to associate numbers and symbols using a key. This measure is sensitive to motor coordination, short-term memory deficits, and visuoperceptual problems in addition to processing speed (Tulsky, Saklofske, & Zhu, Reference Tulsky, Saklofske and Zhu2003). The score is the number of items completed correctly in 120 s (maximum 135 s).
WAIS-IV Symbol Search (Wechsler, Reference Wechsler2008)
In this task, participants are presented with a two target symbols (designs) followed by a test series of symbols that either include or do not include the target designs. The participant must search the test series to identify whether either target symbol is part of the search series. There are successive rows of target and search series and the participant is allowed 120 s to complete as many as possible as quickly as possible. Scores reflect number correct, minus number incorrect in 120 s (maximum 60).
WAIS-IV Processing Speed Index (PSI) (Wechsler, Reference Wechsler2008)
The PSI is a composite score that combines performance on WAIS-IV coding and WAIS-IV Symbol Search. The PSI is significantly lower in individuals with several neuropsychological and psychoeducational problems (Hawkins, Reference Hawkins1998; Martin et al., Reference Martin, Donders and Thompson2000).
WAIS-IV Letter-Number Sequencing (Wechsler, Reference Wechsler2008)
In this test, participants are presented with a mixed list of numbers and letters, and their task is to repeat the list by saying the numbers first in ascending order and then the letters in alphabetical order. This subtest has a strong working memory component (Crowe, Reference Crowe2000; Gold, Carpenter, Randolph, Goldberg, & Weinberger, Reference Gold, Carpenter, Randolph, Goldberg and Weinberger1997; Haut, Kuwabara, Leach, & Arias, Reference Haut, Kuwabara, Leach and Arias2000). Furthermore, there is evidence that this subtest discriminates between individuals with TBI and matched controls (Donders et al., Reference Donders, Tulsky and Zhu2001). Scores reflect the number of correct responses for letter-number strings ranging from three to nine items (maximum 30 points).
The Paced Auditory Serial Addition Test (Gronwall, Reference Gronwall1977).
The PASAT is a measure of cognitive function that specifically assesses auditory information processing speed and flexibility, attention and calculation ability. Single digits are presented every 2 s and the participant must add each new digit to the one immediately before it. The dependent variable is the number of correct sums given (maximum 49).
Peabody Picture Vocabulary Test, IV Edition (Dunn & Dunn, Reference Dunn and Dunn2007)
The PPVT-IV provides a measure of vocabulary comprehension. Examinees are asked to identify which of four pictures reflects a specific word spoken by the examiner. Scores are based on the number correct (maximum 228).
Data Analysis
This initial report on the NIHTB-CB measures includes results from analyses of test–retest reliability, associations of test scores with age and education, and convergent and discriminant validity. Age associations reflect the validity of the Toolbox Cognition tests for detecting age-related cognitive decline during adulthood. Convergent and discriminant validity results provide evidence that the NIHTB-CB is measuring the intended constructs.
For the NIHTB-CB measures and the “gold standard” validation measures listed above, scaled scores were created by first ranking the raw scores, next applying a normative transformation to the ranks to create a standard normal distribution, and finally rescaling the distribution to have a mean of 10 and a standard deviation of 3. These scaled scores were used for all analyses and are not adjusted for age. Pearson correlation coefficients between age and test performance were calculated to assess the ability of each test within the NIHTB-CB to detect cognitive developmental growth during childhood and age-related cognitive decline during adulthood. Intraclass correlation coefficients (ICC) with 95% confidence intervals were calculated to evaluate test–retest reliability; we elected to use ICC to examine test–retest correlations because Pearson correlation coefficients are not sensitive to systematic changes (e.g., practice effects) and can over-estimate reliability (Denegar & Ball, Reference Denegar and Ball1993). Convergent validity was assessed with correlations between the NIHTB-CB measure and a well-established “gold standard” measure of the same construct; evidence of discriminant validity consisted of lower correlations with selected “gold standard” measures of a different cognitive construct. Across measures, correlations less than 0.3 were considered poor, 0.3–0.6 adequate, and 0.6 or greater were good to very good evidence of convergent validity; evidence of discriminant validity consisted of lower correlations with selected “gold standard” measures of a different cognitive construct (Campbell & Fiske, Reference Campbell and Fiske1959). Other demographic group comparisons were then performed using general linear models to examine other demographic associations with performance. These models were adjusted for age, gender, and education, where appropriate. Effect sizes are reported as Cohen’s d, with cutoffs of .20, .50, and .80 indicating small, medium, and large effects, respectively.
RESULTS
Of the 268 participants in the study, 264 completed the NIHTB Pattern Comparison Processing Speed Test (n=158 ages 20–60 and n=106 ages 65 to 85). Participants ages 20–60 had average scaled scores of 11.1 (SD=2.7) and completed 45.0 correct items (SD=8.5) with 0.8 errors (SD=1.2), whereas participants ages 65–85 had average scores of 8.4 (SD=2.7) and completed 36.8 correct items (SD=8.4) with 0.6 errors (SD=1.0); age effects are described below. Furthermore, men had average scores of 9.9 (SD=2.8) and completed 41.3 correct items (SD=8.6) with 0.7 errors (SD=1.1), whereas women had average scores of 10.1 (SD=3.1) and completed 42.0 correct items (SD=9.9) with 0.7 errors (SD=1.2); adjusted comparisons by gender are described below.
Test–Retest Reliability
The mean test–rest interval for the 89 retested individuals was 15.5 days (SD=4.8). Overall ICC for test–retest reliability for the NIHTB Pattern Comparison Processing Speed Test was .73 (95% CI: .62, .81). Scores increased a mean of 0.50 points (SD=2.05, ES=0.24; p=.024), indicating a small practice effect.
Age Effects
Figure 2 provides a graphic presentation of performance on the NIHTB Pattern Comparison Processing Speed Test. A negative association between age and the NIHTB Pattern Comparison Processing Speed Test, r(262)=−.55; p<.0001, was seen. As anticipated based on a large body of past evidence, older individuals completed fewer items correctly than young individuals.
Fig. 2 The NIHTB Pattern Comparison Processing Speed Test scores by age (scaled score (±2 standard error)).
Convergent and Discriminant Validity
Table 1 shows results for convergent and discriminant validity. Correlations for convergent validity with other processing tests ranged from r=.50 to r=.54 (all p<.0001), suggesting that the NIHTB Pattern Comparison Processing Speed Test is indeed tapping processing speed. Correlations for discriminant validity measures ranged from r=.36 to r=.38 for measures of working memory (all p<.0001), and were nonsignificant with a measure of expressive vocabulary (r=−.05; p=.47). This indicates that the NIH Pattern Comparison Processing Speed Test is also tapping into speeded working memory tasks, but not expressive vocabulary.
Table 1 Convergent and Discriminant Validity of the NIHTB Pattern Comparison Processing Speed Test
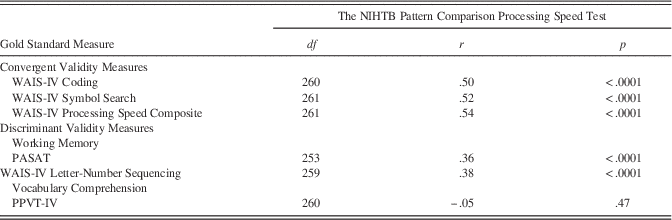
Note. Unadjusted scaled scores were utilized in analyses.
Processing Speed Composite Score
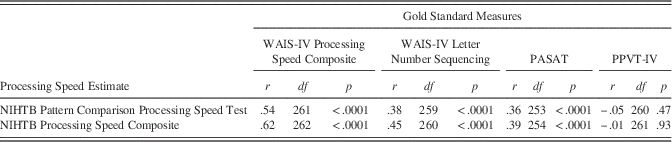
Three measures of processing speed (NIHTB Pattern Comparison Processing Speed Test, and mean RT from all DCCS and Flanker trials) were used to create an NIHTB Processing Speed Composite Score. The individual scores (NIHTB Pattern Comparison Processing Speed, NIHTB DCCS, and NIHTB Flanker Inhibitory Control Test mean RT) and the Processing Speed Composite Score demonstrated similar correlations with age (r=−.52 to −.57; see Table 2) and test–retest reliabilities (r=.74–.83; see Table 2). The NIHTB Processing Speed Composite demonstrated higher correlations with gold standards than did the NIHTB Pattern Comparison Processing Speed Test (see Table 3).
Table 2 Age-related Correlations and Test-retest Correlations for the NIHTB Pattern Comparison Processing Speed Test and the NIHTB Processing Speed Composite Score (using the NIHTB Pattern Comparison Processing Speed Test, the NIH Toolbox DCCS, and the NIHTB Flanker Inhibitory Control Test) for Adults Ages 20 to 85 Years
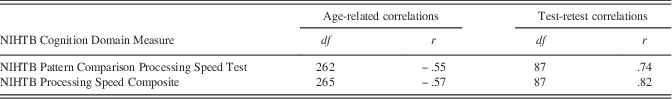
Note. All p<.0001; DCCS=Dimensional Change Card Sort.
Table 3 Correlations between NIHTB Processing Speed Composite Score (using the NIHTB Pattern Comparison Processing Speed Test, the NIHTB DCCS, and the NIHTB Flanker Inhibitory Control Test) and Gold Standard Measures
Other Demographic Comparisons
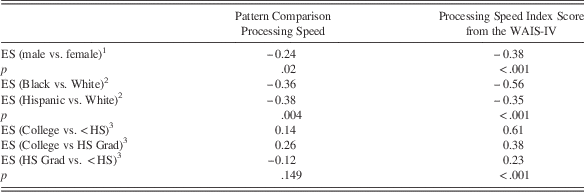
Table 4 shows effect sizes for other demographic factors known to influence cognitive performance, after adjusting for age and other additional relevant demographic variables. A significant difference in the NIHTB Pattern Comparison Processing Speed Test and the Processing Speed Index from the WAIS-IV was found between males and females, with small effect sizes of −0.24 to −0.38 in magnitude. Females scored better than males on both measures. The effect of education was statistically significant for the Processing Speed Index Score from the WAIS-IV, but NOT for the Pattern Comparison Processing Speed Test. The effect of race/ethnicity was statistically significant for both processing speed measures, with differences favoring the whites in both cases.
Table 4 Effect sizes (ES) for demographic comparisons of scores between groups
DISCUSSION
The NIHTB Pattern Comparison Processing Speed Test component of the NIHTB-CB was developed to assess processing speed across the lifespan (from ages 3–85); it is part of a 30-min battery designed to assess multiple domains of cognitive function. This paper study highlights the relevance and utility of the NIH Pattern Comparison Processing Speed Test in adults (data examining children is presented in Carlozzi et al., Reference Carlozzi, Tulsky, Kail and Beaumont2013). Test–retest reliability, age-related performance, and construct validity, were examined relative to gold standard measures of processing speed to explore the utility of this measure in adults. In addition, data were presented that explore the optimal method of estimating processing speed within the NIHTB-CB using both the NIHTB Pattern Comparison Processing Speed Test, as well as two other cognitive measures from the NIHTB that include simple reaction time measures (the NIHTB DCCS and the NIHTB Flanker Inhibitory Control Test).
As highlighted above, results provided support for the reliability of the NIHTB Pattern Comparison Processing Speed Test. Specifically, test–retest reliability was good; this is particularly important given the fact that the NIHTB is expected to be used in longitudinal studies (Weintraub et al., Reference Weintraub, Dikmen, Heaton, Tulsky, Zelazo, Slotkin and GershonUnder Review). Furthermore, the Pattern Comparison Processing Speed Test followed a well-defined developmental trajectory, providing support for its validity. Thus, processing speed is shortened systematically through childhood and adolescence (Hale, Reference Hale1990; Kail, Reference Kail1991), peaks in young adulthood and slows modestly during middle age (Cerella & Hale, Reference Cerella and Hale1994; Chaytor & Schmitter-Edgecombe, Reference Chaytor and Schmitter-Edgecombe2004), and more substantially in adults over age 65 (Finkel et al., Reference Finkel, Mintzer, Dysken, Krishnan, Burt and McRae2004; Salthouse, Reference Salthouse1985, Reference Salthouse1990, Reference Salthouse1993; Salthouse & Coon, Reference Salthouse and Coon1993; Schaie, Reference Schaie1989, Reference Schaie1994; Sliwinski & Buschke, Reference Sliwinski and Buschke1997; Zimprich & Martin, Reference Zimprich and Martin2002). Consistent with this pattern, performance on the NIHTB Pattern Comparison Processing Speed Test performance improved in our youngest age groups (Carlozzi et al., Reference Carlozzi, Tulsky, Kail and Beaumont2013) and declined modestly in middle age, and more substantially in our oldest adults (see Figure 1).
Convergent and discriminant validity of the NIHTB Pattern Comparison Processing Speed Test were also supported by our findings. Specifically, the test demonstrated moderate relations with other measures that examine processing speed, smaller associations with a related, but different domain of cognitive function (i.e., working memory), and an insubstantial relationship with domains of cognition less reliant on PS (i.e., vocabulary comprehension; see Table 3). This is consistent with literature that highlights an overlap between PS and working memory (Chiaravalloti et al., Reference Chiaravalloti, Christodoulou, Demaree and DeLuca2003; Demaree et al., Reference Demaree, DeLuca, Gaudino and Diamond1999), as well as literature that suggests that vocabulary is not significantly correlated with processing speed (Bell, Lassiter, Matthews, & Hutchinson, Reference Bell, Lassiter, Matthews and Hutchinson2001).
Analyses examining the NIHTB Processing Speed Composite score indicated that when three indices of processing speed were combined (NIHTB Pattern Comparison Processing Speed score, and NIHTB DCCS and Flanker Inhibitory Control reaction times), the relation between the NIHTB Processing Speed Composite and the gold standard measures were slightly stronger than those between the NIHTB Pattern Comparison Processing Speed Test (alone) and the gold standard measures. This finding is consistent with research that indicates that findings based on multiple observations are more robust than any single score in isolation; composite scores are generally more robust, more sensitive, and include less measurement error, than any estimation based on a single score. Ultimately, this type of composite score should have utility in clinical trials and longitudinal research involving participants across a broad age range.
Finally, an examination of the NIHTB Pattern Comparison Processing Speed test with demographic factors (other than age, which is described above) indicated that, in some cases the new test may be functioning slightly differently than the gold standard measures used (Lezak, Reference Lezak1995; Strauss, Sherman, & Spreen, Reference Strauss, Sherman and Spreen2006). For example, after controlling for relevant demographic variables, there was no significant education effect for the NIHTB Pattern Comparison Processing Speed test, but small to medium effect sizes for the gold standard measures. While the fact that the absence of education effects for the NIHTB is desirable, it is not consistent with the literature. Furthermore, although we found race/ethnic differences for both the NIHTB test and the gold standard, these differences were smaller for the new NIHTB test. With regard to gender, findings were consistent with the literature: females performed slightly better than males on both the NIHTB test and the gold standard measure (e.g., Camarata & Woodcock, Reference Camarata and Woodcock2006; Majeres, Reference Majeres1997; Majeres, Reference Majeres1999). Further research is needed to examine such demographic effects in different and larger samples to see if findings (especially with respect to education), can be replicated. If such findings are replicated, this might suggest that there is something unique about the NIHTB Pattern Comparison Test.
While the Pattern Comparison Processing Speed Test offers many strengths, it is important to recognize some test limitations. In the validation of the NIHTB-CB, a touchscreen was used to record responses. The movement of the entire hand to the touch screen introduced an additional time factor that has not been part of standard processing speed tasks. For the norming version of the test, the response mode was changed to the arrow keys on the computer keyboard. Although the key presses provide shorter reaction times, like the touchscreen, they also require intact motor functions. In populations where motor functioning is impaired, there is no way to distinguish among slowed responses due to motor impairment, slowed responses due to cognitive impairment, or slowed responses due to some combination of motor and cognitive impairment. While this is a test weakness, is it a problem that is shared but many other processing speed tests. Tasks such as the Sternberg paradigm (Sternberg, Reference Sternberg1966) were designed specifically to tease apart these factors but require much more time for administration than was available in the context of the entire battery. An additional limitation of the task is related to the distinction between simple and complex PS highlighted above (Chiaravalloti et al., Reference Chiaravalloti, Christodoulou, Demaree and DeLuca2003). Both the Pattern Comparison Processing Speed Test and the NIHTB Processing Composite Score assess complex PS and may be less valuable as a measure of simple PS. Furthermore, while much research examining processing speed effects indicate differential effects as a function of test segment (especially for clinical populations), this measure does not capture timing data during task administration, and therefore examination by time segment (which can be especially informative in clinical populations) is not possible.
Regardless of these limitations, the NIHTB Pattern Comparison Processing Speed Test provides a brief, sensitive measure of processing speed across the lifespan. Future work is underway to collect extensive normative data, which will allow clinicians and researchers to use this measure to quantify deficits in processing speed across the lifespan. In addition, work is underway to examine the utility and sensitivity of this and the other tests in the NIHTB-CB to neurological insult (e.g., traumatic brain injury, stroke, Alzheimer’s disease). Ultimately, the 90-s Toolbox Pattern Comparison Processing Speed Test provides a reliable measurement of complex PS that should be useful over the lifespan, and be sensitive to both developmental changes and neurological insult.
ACKNOWLEDGEMENTS
This study is funded in whole or in part with Federal funds from the Blueprint for Neuroscience Research, National Institutes of Health, under Contract No. HHS-N-260-2006-00007-C. The authors do not have any conflicts of interest to report.


