Introduction
Maize remains one of the most important staple food crops in sub-Saharan Africa (SSA). It is consumed across the continent and covers a significant hectarage of the agricultural land (Okweche et al., Reference Okweche, Ogunwolu and Adeyemo2013). However, maize production in SSA is constrained by several biotic and abiotic stresses prominent among which is low-soil nitrogen (Badu-Apraku et al., Reference Badu-Apraku, Akinwale, Franco and Oyekunle2012). The situation is exacerbated by the effects of climate change. Current climate change-related projections present more grim implications for agriculture in Africa, including maize production (Ribeiro and Rodriguez, Reference Ribeiro and Rodriguez2020). Serious research efforts and adequate resources are required to mitigate the effects of climate change in SSA.
Nitrogen uptake by maize plants is critical to improved growth and also serves as a powerful tool for increased maize yield in SSA (Buerkert et al., Reference Buerkert, Bationo and Piepho2001). Nitrogen is considered the most important nutrient in maize production in SSA and is recognized as the second most limiting factor for plant growth after water (Sangoi et al., Reference Sangoi, Almeida, Pucci, Strieder, Zanin, Silva and Vieira2008). Reduced availability of productive land for agricultural purposes has restricted farmers to cultivation on the same piece of land without fallowing or crop rotation year after year. Poor weed control also increases the incidence of N stress. Collectively, these constraints have resulted in low N being a major constraint of maize production environments in SSA (Banziger and Lafitte, Reference Bänziger and Lafitte1997; Buerkert et al., Reference Buerkert, Bationo and Piepho2001).
Maize production also occurs under low-N environments (Oikeh and Horst, Reference Oikeh, Horst and Horst2001) by low input farmers who continuously crop maize with limited or no use of N fertilizer. This may be attributed to the high cost of fertilizer relative to grain which makes it uneconomical for farmers to apply fertilizer, non-availability of fertilizer when needed most and reduced N-uptake, especially in drought-prone environments due to quick mineralization of organic matter (Bänziger and Lafitte, Reference Bänziger and Lafitte1997). One effective strategy available to reduce fertilizer cost is to develop maize genotypes with combined high nitrogen use efficiency and high yield potential. Genotypes with high yield potential under low N are also needed to support the rapidly growing population and provide incentives to farmers who mostly apply modest amounts of N in their maize fields. Improved maize varieties that tolerate low N will help maize farmers in stress-prone areas to obtain better harvests (Zaidi et al., Reference Zaidi, Rafique and Singh2003; CIMMYT, 2007). Efforts to increase maize production in low nitrogen soil conditions may contribute considerably to improving food security and well-being in SSA (Masuka et al., Reference Masuka, Araus, Das, Sonder and Cairns2012). A major strategy adopted for increasing maize yield under low N input conditions in SSA is breeding for improved grain yield under nutrient deficiency or towards specific adaptation to increase grain yield under low-nitrogen conditions. Consequently, many maize improvement programmes in SSA have placed major emphasis on germplasm improvement for low-N tolerance.
Significant genotype-by-environment interactions (G × E) are common phenomena for plants under stress conditions. Consequently, a variety which performs well in one environment during one growing season or year may not perform well in a different period or site within the same region (Sibiya et al., Reference Sibiya, Tongoona, Derera and Rij2012; Badu-Apraku and Fakorede, Reference Badu-Apraku and Fakorede2017; Maffousan et al., Reference Maffousan, Gracen, Yeboah, Ntsomboh-Ntsefong, Tandzi and Mutengwa2018). The result is that genotypes exhibit different levels of phenotypic expression under contrasting environmental conditions resulting in crossover performance (Miti, Reference Miti2007). Genotype × environment interaction also occurs as a result of differences in the sensitivities of genotypes to the growing conditions in the target environment (Miti, Reference Miti2007). When G × E occurs, it is important to determine whether there are important crossover interactions, i.e. rank changes of the genotypes in different environments, so that outstanding genotypes could be selected in different environments (Yan and Tinker, Reference Yan and Tinker2006). When there is no change in the rankings of genotypes over environments, there is a non-crossover type of interaction effects, and genotypes with superior means can be recommended for production in all the environments (Yan and Tinker, Reference Yan and Tinker2006). Breeders can also use the information on G × E to identify appropriate locations for selection to maximize grain yield (Yan and Tinker, Reference Yan and Tinker2006).
In maize breeding programmes, analysis of general combining ability (GCA) and specific combining ability (SCA) is essential for identifying outstanding inbred lines with good specific combining ability. The analysis also provides information on the type of gene action controlling quantitative traits, thereby assisting breeders in selecting suitable parental lines (Abrha et al., Reference Abrha, Habtamu and Dagne2013; Girma et al., Reference Girma, Sentayehu, Berhanu and Temesgen2015). To date, reports on the gene action controlling grain yield and other agronomic traits under low soil N conditions in maize remains inconsistent. For example, several researchers (Rizzi et al., Reference Rizzi, Balconi, Nembrini, Stefanini, Coppolino and Motto1993; Lafitte and Edmeades, Reference Lafitte and Edmeades1995; Below et al., Reference Below, Brandua, Lambert, Teyker and Edmeades1997; Kling et al., Reference Kling, Oikeh, Akintoye, Heuberge, Horst and Edmeades1997) have reported a preponderance of additive gene action over the non-additive in the inheritance of grain yield under low N. Similarly, Badu-Apraku et al. (Reference Badu-Apraku, Annor, Oyekunle, Akinwale, Fakorede, Talabi, Akaogu, Melaku and Fasanmade2015) reported that additive genetic effects were more important than the non-additive in controlling grain yield and most agronomic traits under low N conditions. In contrast, other authors (Betrán et al., Reference Betràn, Beck, Bänziger and Edmeades2003; Makumbi et al., Reference Makumbi, Betràn, Bänziger and Ribaut2011) reported that non-additive gene action regulated grain yield in low-N environments whereas additive gene action controlled grain yield in high-N environments (Below et al., Reference Below, Brandua, Lambert, Teyker and Edmeades1997; Betrán et al., Reference Betràn, Beck, Bänziger and Edmeades2003; Makumbi et al., Reference Makumbi, Betràn, Bänziger and Ribaut2011). The differences in the findings could be attributed to variations in germplasm utilized and the severity of the stresses imposed during plant growth and development.
Few studies on combining ability using the International Institute of Tropical Agriculture (IITA) and International Maize and Wheat Improvement Center (CIMMYT) extra-early/early and late/intermediate maturing inbred lines have been conducted under non-stress conditions, drought and well-watered conditions (Adebayo et al., Reference Adebayo, Menkir, Blay, Gracen, Danquh and Hearne2014). Based on the results of these studies, some CIMMYT lines were identified for improving the IITA intermediate germplasm. For instance, Ifie (Reference Ifie2013) examined the combining ability of IITA and CIMMYT early-maturing inbred lines under Striga and low N conditions. Two lines from IITA, TZEI 175 and TZEI 24, possessing alleles for Striga tolerance and resistance were proposed for improvement of Striga resistance in tropical maize germplasm while TZEI 32 and ENT 16 identified as tolerant to low soil N were proposed for improvement of tolerance to low N. So far, these are the only studies conducted involving the IITA and CIMMYT early maturing white inbred lines under drought and low-N environments even though several drought and low N tolerant early, extra-early, late and intermediate maturing IITA and CIMMYT inbred lines have been identified in the Drought Tolerant Maize for Africa (DTMA) Project panel of inbred lines. Analysis of inter-trait relationships in contrasting environments is imperative in a maize improvement programme involved in genetic enhancement of grain yield and resistance/tolerance to stresses. This is due to the fact that most economic traits, including grain yield, have low heritability because they are quantitatively inherited. Thus, gains from direct selection for such traits are very little. Available alternative is indirect selection through the use of secondary traits that have high genetic correlations with grain yield, high heritability and are easily measured. Such traits can be identified through analysis of trait associations. The genotype-by-trait (GT) analysis proposed by Yan and Kang (Reference Yan, Kang and Kang2003) is an efficient statistical tool useful for multiple trait-based assessment of genotypes to identify those that are superior for specific traits which could be used as base genotypes in a breeding programme or released for commercialization while also presenting a graphical display of the genetic correlations among traits (Ober et al., Reference Ober, Bloa, Clark, Royal, Jaggard and Pidgeon2005; Badu-Apraku and Akinwale, Reference Badu-Apraku and Akinwale2010). It is also helpful in identifying appropriate traits for indirect selection for high grain yield while also providing information for detecting unimportant traits.
The present study was therefore conducted to (i) identify high yielding and stable intermediate maize hybrids under low- and high-N growing environments, (ii) determine the combining abilities and mode of gene action controlling low-N tolerance in a set of intermediate maturing maize inbred lines from IITA and CIMMYT, (iii) examine the performance and stability of the hybrids across low- and high-N environments and (iv) investigate trait associations with a view to identifying traits strongly associated with grain yield under low- and high-N conditions.
Materials and methods
Germplasm and generation of crosses
The genetic materials used in the present study were 32 intermediate maturing white inbred lines and three elite inbred testers (9071, 1368 and 87036) obtained from CIMMYT, the Institute of Agricultural Research for Development (IRAD) and IITA (Table 1). The testers 1368 and 9071 were the parents of a commercial single cross hybrid, Oba Super 1 marketed by several seed companies in Nigeria (Menkir et al., Reference Menkir, Badu-Apraku, Thé and Adepoju2003). Tester 87036 was also one of the parents of a commercial hybrid highly patronized in Cameroun (Maffoussan, Reference Maffouasson2014). All the three testers are recognized efficient testers which have been employed by many researchers. For instance, Agbaje et al. (Reference Agbaje, Badu-Apraku and Fakorede2008) employed testers 1368 and 9071 to study heterotic patterns of early maturing maize inbred lines in Striga-free and Striga-infested environments. Maffousan et al. (Reference Maffousan, Gracen, Yeboah, Ntsomboh-Ntsefong, Tandzi and Mutengwa2018) employed testers 87036 and 1368 to study genotype-by-environment interactions and yield stability of maize single cross hybrids developed from tropical inbred lines.
Table 1. List of inbred lines and testers used in the study

The 32 inbred lines were crossed with the three testers using the line by tester mating design to generate 96 hybrids. Crosses were also made among the testers to generate three hybrids used as checks in addition to a released hybrid ‘Etubi’ from Ghana. The crosses were generated in the research fields of the CSIR-Crops Research Institute at Kwadaso, Ghana during the minor growing season of 2012.
Experimental sites and field layout
The study was carried out at three locations: Fumesua, Ejura and Kwadaso, experimental fields of the CSIR-Crops Research Institute. Fumesua is in the semi-deciduous forest zone with an altitude of 286 m above sea level and it is located at Latitude 6°41′N and Longitude 1°28′W. Its mean annual rainfall is 1500 mm with mean minimum and maximum temperatures of 21 and 31°C, respectively. The soil is Asuansi series, a ferric acrisol. Kwadaso is also located in the forest zone. It has a bimodal rainfall distribution pattern. Its mean annual rainfall is 1450 mm with mean minimum and maximum temperatures of 20 and 29°C, respectively. The major season is from late March to mid-July, while the minor season is from mid-September to mid-November. Kwadaso is situated between Latitude 6°43′N and Longitude 1°36′W. The soil is ferric acrisol. Ejura is in the forest-savanna transition agro-ecological zone. It is located at Latitude 7°40′N and Longitude 1°39′W, and 221.9 m above sea level. The temperature at Ejura ranges from 31 to 34°C with a relative humidity of 55–65%. The soil type at Ejura is Amantin series under the forest and savanna ochrosols and is moderately well drained, permeable and sandy loam (Adu and Asiamah, Reference Adu and Asiamah1992; MoFA, 2011).
The study sites were depleted of nitrogen by growing maize at a very high population density without fertilizer application and removing the biomass after each harvest for a period of 2 years. Soil samples were taken each year before planting for all the test environments and N content determined at the soil laboratory of the Soil Research Institute in Kumasi. Furthermore, at harvest, there was total plant removal from the field. The soil properties of the experimental fields at Kwadaso, Ejura and Fumesua in 2013 and 2014 are presented in Table 2. Nutrient status, interpreted in accordance with Landon (Reference Landon1991) method of soil analysis, was found to be generally low at all three locations. Nitrogen levels were also found to be low at all locations since amounts <0.2% were recorded. Hence, the results obtained in the present study are expected to represent the true response of genotypes to the nitrogen applied externally. Available nitrogen is defined as nitrogen in a chemical form that can be readily absorbed by plant roots However, values for this essential parameter were not obtained during this study. Guinto and Catto (Reference Guinto, Catto, Currie and Singh2016) reported a statistically significant relationship between available and total nitrogen and concluded that, when refined, total N data can be used as an estimate of available N in non-pastoral soils with a greater degree of confidence.
Table 2. Soil chemical properties of experimental sites

High values have > attached to the values, meaning the parameters measured are high.
Low values have < attached to the values, meaning the parameters measured are low.
The experimental design used in the present study was 10 × 10 lattice with two replications. Single row plots, each 5 m long, spaced 0.75 m apart with 0.5 m between plants in each row were used at all locations. Three seeds of the inbred lines were planted in each hole and thinned to two plants per hill at 2 weeks after emergence to obtain a population density of 53 333 plants/ha. The experimental fields were divided into low (30 kg N/ha) and high (90 kg N/ha) nitrogen blocks. Nitrogen was applied in the form of sulphate of ammonia. Both low-N and high-N blocks received 60 kg P/ha as single superphosphate (P205) and 60 kg K/ha as muriate of potash (K2O). The trials were kept weed-free with the application of pre- and post-emergence herbicides, primextra and paraquat, each at 5 litres/ha and subsequently, by hand weeding.
Data collection
Data recorded included days to 50% silking (DTS) as the number of days from planting to when 50% of the plants had emerged silks, and days to anthesis (DTA) when 50% of the plants had shed pollen. The anthesis-silking interval (ASI) was calculated as the difference between days to 50% silking and 50% anthesis. Plant height (PHT) was measured as the distance from the base of the plant to the height of the first tassel branch while ear height (EHT) was measured as the distance to the node bearing the upper ear, respectively. Plant aspect (PASP) was based on the assessment of the general architecture of plants in a plot as they appealed to the sight and was rated on a scale of 1–5 where, 1 = excellent overall phenotypic appeal, 2 = very good overall phenotypic appeal, 3 = good overall phenotypic appeal, 4 = poor overall phenotypic appeal and 5 = very poor overall phenotypic appeal. The number of ears per plant (EPP) was obtained by dividing the total number of ears per plot by the number of plants harvested. Chlorophyll concentration of the ear leaf of five plants per plot was randomly selected and measured at approximately 2 weeks after anthesis (WAA) with a portable SPAD meter (CCM-200 plus-opti sciences).
For trials conducted under N stress, harvested ears from each plot were shelled to determine the percentage of grain moisture. Grain yield in kg/ha was computed from the shelled grain weight, adjusted to 15% moisture. For the high N plots, a shelling percentage of 80% was assumed for all genotypes and grain yield (obtained from ear weight and converted to kg/ha) was adjusted to 15% moisture.
Statistical analysis
Analysis of variance (ANOVA) was performed on plot means for grain yield and other agronomic characters for each environment and across environments using PROC GLM procedure of SAS software, version 9.3 (SAS Institute, 2008). Each environment was defined as year × site × nitrogen treatment. Environmental effects were treated as random and genotypes as fixed effects. The line × tester analysis (Kempthrone, Reference Kempthrone1957) was used for crosses excluding the checks for low N environments, high N environments and across environments. F tests for line, tester and line × tester mean squares were computed using the mean squares for their respective interactions with environment. The mean squares attributable to environment × line × tester was tested using the pooled error mean squares. The main effects of line and tester represented the general combining ability (GCA) effects while line × tester interaction represented specific combining ability (SCA) effects. The source of variation for hybrids was partitioned into variability due to lines, testers and line × testers. Estimates of GCA of a tester (male) were obtained based on its performance in F1 hybrid combinations with all possible lines (females). Similarly, GCA of a line was determined from its performance in F1 hybrid combinations with all possible testers. GCA and SCA effects were determined for each agronomic trait under each N environment and across environments. Estimates of GCA and SCA were calculated and their significance determined by t tests.
The yield data were further subjected to genotype main effect plus genotype × environment interaction (GGE) biplot analysis to decompose the G × E interactions of each experiment using the GGE biplot windows application (Yan et al., Reference Yan, Hunt, Sheng and Szlavnics2000; Yan, Reference Yan2001). The GGE biplot model equation is:

where Yij is the average yield of genotype i in environment j, Yj is the average yield across all genotypes in environment j, λ 1 and λ 2 are the singular values for principal component (PC)1 and PC2, ξ i1 and ξ i2 are the PC1 and PC2 scores for genotype i, ηj1 and η j2 are the PC1 and PC2 scores for environment j and ∑j2 is the residual of the model associated with the genotype i in environment j. The data were not transformed (Transform = 0), not standardized (Scale = 0) and were environment-centred (Centring = 2)The GT analysis was conducted using R (software) package GEA-R (version 4.0) (Pacheco et al., Reference Pacheco, Vargas, Alvarado, Rodríguez, Crossa and Burgueño2016). Prior to GT analysis, the data for the selected 30 hybrids (top 10, middle 10 and worst 10) were standard deviation-standardized (mean = 0, standard deviation = 1) to reduce the confounding effects due to the differences in the scales of measurement of the agronomic traits involved in the analysis. Thus, the outputs are appropriate for visualizing the genotypes and trait relationships. The biplot model equation for the G × T analysis is as follows:

where Ŷij is the genetic value of the combination between inbred i and trait j; μ is the mean of all combinations involving trait j; βj is the main effect of trait j; λ1 and λ2 are the singular values for Principal component (PRC)1 and PRC2; gi 1 and gi 2 are the PRC1 and PRC2 eigenvectors, respectively, for inbred i; e1j and e2j are the PRC1 and PRC2 eigenvectors, respectively, for trait j; dj is the phenotypic standard deviation (with mean zero and standard deviation of 1); and ɛij is the residual of the model associated with the combination of inbred i and trait j.
Results
Analysis of variance and combining ability of grain yield and other traits
Across low N environments, the ANOVA of the single crosses revealed significant (P < 0.05) to highly significant (P < 0.01) mean squares for genotype (G), environment (E) and genotype × environment interaction (GEI) for the measured traits except the stay green characteristic for GEI (Table 3). Significant differences were observed among genotypes, environments and GEI for all traits except G for ears per plant and GEI for ears per plant and plant aspect under high N environments (Table 4).
Table 3. Line × tester analysis of grain yield and other agronomic traits of 32 intermediate maturing white inbred lines across low N environments

GY, grain yield; DTS, days to silk; DTA, days to anthesis; ASI, anthesis silking interval; PHT, plant height; EHT, ear height; EPP, number of ears per plant; SG, stay green; PASP, plant aspect; EASP, ear aspect; HC, husk cover.
*, **Significant at 0.05 and 0.01 probability levels, respectively, and ns: not significant.
Table 4. Line × tester analysis of grain yield and other agronomic traits of 32 intermediate maturing white inbred lines across high N environments

GY, grain yield; DTS, days to silk; DTA, days to anthesis; ASI, anthesis silking interval; PHT, plant height; EHT, ear height; EPP, number of ears per plant; SG, stay green; PASP, plant aspect; EASP, ear aspect; HC, husk cover.
*, **Significant at 0.05 and 0.01 probability levels, respectively, and ns: not significant.
Partitioning of the entries (genotypes) into components revealed that GCA of line (GCAl) and GCA of tester (GCAt) and SCA mean squares were significant for all measured traits under low N except for the line GCA for plant aspect, SCA for plant height, ears per plant, stay green characteristic, plant aspect, husk cover and chlorophyll content (Table 3). GCAl × environment interactions were significant for all traits except the stay green characteristic, plant aspect, husk cover and chlorophyll content while GCAt × environment interactions were significant for all traits except days to silking and anthesis. SCA × environment interactions were not significant for most traits. The GCA of line and tester variances were larger than those of SCA for all traits under low N environments.
Under high N environments, GCAl and GCAt were significant for all traits except ears per plant (Table 4). SCA effects were significant for grain yield, days to silking and anthesis, anthesis silking interval, plant aspect and husk cover. GCA × environment interaction for line and tester were significant for all traits except ears per plant and chlorophyll content for GCAl × environment and ear height and plant height for GCAt × environment. Similar to low N environments, SCA by environment interactions were not significant for most measured traits and GCA of line and tester variances were larger than those of SCA for measured traits.
Under low N conditions, GCA effects for grain yield ranged from −400.0 for TZL Comp3 to 240.0 for CML395/CML444 (Table 5). Out of the 32 inbred lines, only CLWN 247, TZD II 68 and ZM523B-29-2-1-1-B*6 showed significant and positive GCA effects for grain yield. Only one of the testers, 9071 showed significant positive GCA effects for grain yield. Negative significant GCA effects for days to silking and anthesis silking interval were observed for the inbred lines CLWN 349, CML 442, Laposta Seq C7-F18-3-2-1, Laposta Seq C7-F71-1-1-2, TZD II68, ZM 521B-66-4-1-1, ZM523B-29-2-1-1-B*. Two testers 1368 and 87036 also showed significant negative GCA effects for days to silking. Inbred lines Laposta Seq C7-F18-3-2-1 and TZD II 68, as well as the tester 9071 displayed significant positive GCA effects for plant height. Significant negative GCA effects for stay green characteristic were observed for inbred lines CML 395/CML 444, CML 442, CZL 068, Laposta Seq C7-F71-1-1-2 and the tester 87036. Only CZL 00001 showed significant negative GCA effects for plant aspect. A positive significant GCA effect for chlorophyll content was observed for CML 198/LPSC, CML 254, CML 442, CZL 0713, Laposta Seq C7-F18-3-2-1, Laposta Seq C7-F71-1-1-2 and the tester 9071. Under high N environments, significant positive GCA effects for grain yield were observed for lines CLWN 247, CLWN 364, CML 395/CML 444 CZL 00001 and tester 9071 (Table 6). Inbred lines CML 395/CML 444, CML 442, CZL 068, CZL 0713, J-16-1, Laposta Seq C7-F18-3-2-1, Laposta Seq C7-F71-1-1-2, TZD II 140, TZD II 68 and tester 1368 exhibited significant negative GCA effects for days to silking. Inbred lines CML 395/CML 444, CZL 068 and CZL 0713 showed significant negative GCA effects for stay green characteristic. Line CZL 0713 had significant negative GCA effects for both plant and ear aspects, while CLWN 240 and CML 494 had significant negative GCA effects for ear aspect. The two laposta lines, Laposta Seq C7-F18-3-2-1 and Laposta Seq C7-F71-1-1-2 had significant positive GCA effects for chlorophyll content. Both negative and positive estimates of SCA effects (line by tester) for grain yield were observed among crosses across low N and high N environments (Tables 7 and 8, respectively). Significant and positive SCA effects were observed for crosses TZD II 68 × 1368, CZL 0713 × 1368, MI31 × 1368, CLWN 359 × 9071, TZM 501 × KU 1414 × 43 TZM501 × 9071 and TZL comp 3 × 87036 under low N environments, with the highest SCA effects detected for TZD II 68 × 1368. These crosses with the exception of TZL comp 3 × 87036 were among the best 20 hybrids selected across low N environments. Across high N environments, significant positive SCA effects were observed for the crosses CLWN 359 × 1368, CML 494 × 1368, CZL 00001 × 9071, Laposta Seq C7-F18-3-2-1 × 9071, CLWN 349 × 87036 and Laposta Seq C7-F71-1-1-2 × 87036. CZL 00001 × 9071 had the highest SCA effects. These hybrids also produced high yields and were among the best 20 testcrosses except for Laposta Seq C7-F71-1-1-2 × 87036.
Table 5. General combining ability effects of lines and testers for grain yield and other agronomic traits under low N environments

*, **Significant at 0.05 and 0.01 probability levels, respectively.
Table 6. General combining ability effects of lines and testers for grain yield and other agronomic traits under high N environments

*, **Significant at 0.05 and 0.01 probability levels, respectively.
Table 7. Specific combining ability effects for grain yield across low N environments

*, **Significant at 0.05 and 0.01 probability levels, respectively.
Table 8. Specific combining ability effects for grain yield across high N environments

*, **Significant at 0.05 and 0.01 probability levels, respectively.
The relative importance of GCA and SCA effects was determined as the ratio of GCA effects on the total genetic effects using the sum of squares. The closer the ratio was to unity, the greater was the predictability based on GCA (Baker, Reference Zaidi, Rafique and Singh1978). GCA sums of squares (GCA of line plus GCA of tester) varied from 47.5% for ears per plant to 90.0% for days to anthesis. The SCA sum of squares varied from 10.0% for days to anthesis to 52.5% for ears per plant. The SCA sum of squares were larger than GCA sum of squares for ears per plant (52.5%) and husk cover (50.9%) whereas GCA sum of squares were larger for all other traits across environments. Across low N environments, GCA effects varied from 43.7% for plant aspect to 85.0% for days to anthesis. The GCA effects accounted for 57.5% of the total genetic effects for grain yield while the contribution from SCA was 31.4%. The SCA effects varied from 15.0% for days to anthesis to 56.3% for plant aspect. The SCA sum of squares were larger than GCA sum of squares for ears per plant (53.6%), anthesis silking interval (50.3%), plant aspect (56.3%), ear aspect (56.2) and husk cover (52.1%) whereas GCA sum of squares were larger for the other traits. Across high N environments, the contribution of GCA to genotypic sum of squares ranged from 35.3% for ears per plant to 88.2% for days to anthesis, while the SCA effects varied from 11.9% for days to anthesis to 64.7% for ears per plant. The GCA effects accounted for 62.1% of the total genetic effects for grain yield. Similarly, across low N environments, SCA sum of squares were larger than GCA sum of squares for ears per plant (64.7%), anthesis silking interval (52.9%), plant aspect (50.5%) and husk cover (61.5%) whereas GCA sums of squares were larger for the other measured traits.
Across low N, grain yield ranged from 528 kg/ha for TZL Comp3 × 1368 to 2718 kg/ha for TZD II68 × 1368 with a mean of 1784 kg/ha (Table 9). Grain yield across high N conditions ranged from 2340 kg/ha for ZM521B-66-4-1 × 1368 to 5348 kg/ha for CZL 00001 × 9071 with a mean of 3713 kg/ha (Table 10). The best check across research environments was 87036 × 9071 which had grain yield of 1876, 3558 and 2717 kg/ha under low, high and across N environments, respectively. The high yield of TZD II68 × 1368 was associated with increased plant height, ears per plant, reduced ASI and good plant aspect. The highest yielding hybrid across low and high N out yielded the best check by more than 10%.
Table 9. Grain yield and other agronomic traits of intermediate maturing maize hybrids (best 20 and worst 10) evaluated under low N environments in Fumesua, Ejura and Kwadaso in 2013 and 2014

GY, grain yield; DTS, days to silk; DTA, days to anthesis; ASI, anthesis silking interval; PHT, plant height; EHT, ear height; EPP, number of ears per plant; SG, stay green; PASP, plant aspect; EASP, ear aspect; HC, husk cover; CC, chlorophyll content.
Table 10. Grain yield and other agronomic traits of intermediate maturing maize hybrids (best 20 and worst 10) evaluated under high N environments in Fumesua, Ejura and Kwaadaso in 2013 and 2014

GY, grain yield; DTS, days to silk; DTA, days to anthesis; ASI, anthesis silking interval; PHT, plant height; EHT, ear height; EPP, number of ears per plant; SG, stay green; PASP, plant aspect; EASP, ear aspect; HC, husk cover; CC, chlorophyll content.
Performance and stability hybrids across environments
The GGE biplot analysis of grain yield of the best 20 and worst five hybrids and the four checks across 12 environments revealed that the principal component axis 1 (PC1) explained 43.1% of total variation while PC2 explained 17.2% of the total variation in grain yield across the environments with both axes explaining 60.3% of the total variation in grain yield. In Fig. 1, the entry/tester GGE biplot revealed CZL 00001 × 9071 (1), Laposta Seq C7-F18-3-2-1 × 9071 (2), CLWN 247 × 9071 (3), CLWN 364 × 9071 (4) and TZD II 68 × 1368 (5) as the five top yielding hybrids. The lowest yielding hybrids were TZL Comp3 × 1368 (25), ZM 521 B-66-4-1-1 × 1368 (24), CML 254 × 1368 (23) and CLWN 238 × 1368 (22). The hybrids CZL 00001 × 9071 (1) and CLWN 247 × 9071 (3) were high yielding but highly unstable while CML 395/CML 444 × 9071 (6), TZD II 134 × 9071 (8), CML 494 × 1368 (12), CML 494 × 9071 (19) and CLWN 349 × 1368 (21) were the most stable hybrids. Among the hybrids that were most stable, CML 395/CML 444 × 9071 (6) and CML 494 × 1368 (12) were among the best 20 under high N, while CML 395/CML 444 × 9071 (6) was among the best 20 under low N. Across environments, hybrids CML 494 × 1368 (12), CML 494 × 9071 (19) and CML 395/CML 444 × 9071 (6) were among the best 20. Hybrids CML 494 × 1368(12), TZD II 134 × 9071(8), CML 395/CML 444 × 9071(6) and TZDII 68 × 1368 (5) were the best hybrids in terms of stability and yield performance across test environments.

Fig. 1. Colour online. Performance and stability of 29 intermediate maturing maize hybrids across low and high N environments in 2013 and 2014. EJH14, Ejura high 2014; EJL14, Ejura low 2014; EJH13, Ejura high 2013; EJL13, Ejura low 2013; FUML13, Fumesua low 2013; FUMH13, Fumesua high 2013; FUML14, Fumesua low 2014; FUMH14, Fumesua high 2014; KWL13, Kwadaso low 2013; KWH13, Kwadaso high 2013; KWH14, Kwadaso high 2014; KWL14, Kwadaso low 2014.
The vertex cultivar in each sector of the polygon view represented the highest yielding cultivar in the location that fell within that particular sector (Fig. 2). Hybrids 7, 15 and 3 were the highest yielding at KWH14 and KWH13 (high N environments at Kwadaso in 2013 and 2014), while hybrid 1 exhibited the highest performance at FUML14, FUMH14 and EJH14. The vertex hybrids 9, 25 and 24 were the lowest yielding at all or some locations. Furthermore, no environment fell into the sectors with 29, 27, 26, 21, 23, 22, 28, 20, 17, 13 and 18, indicating that these hybrids were not the best in any of those environments. Hybrids within the polygon, particularly those located close to the biplot origin were less responsive compared to the vertex hybrids.

Fig. 2. Colour online. A ‘which won where’ GGE biplot of grain yield of 29 intermediate maturing maize hybrids evaluated across low N and high N environments in 2013 and 2014. EJH14, Ejura high 2014; EJL14, Ejura low 2014; EJH13, Ejura high 2013; EJL13, Ejura low 2013; FUML13, Fumesua low 2013; FUMH13, Fumesua high 2013; FUML14, Fumesua low 2014; FUMH14, Fumesua high 2014; KWL13, Kwadaso low 2013; KWH13, Kwadaso high 2013; KWH14, Kwadaso high 2014; KWL14, Kwadaso low 2014.
The representativeness and discriminating ability of the environments is presented in Fig. 3. The straight line from the origin to the coordinates where an environment falls was called the research environment vector while the straight line with a single arrow which passed through the origin and the average environment represented the average environment axis (AEA). The vector length measured its discriminating power to assess cultivars under the test environments, that is, the longer the vector length the more discriminating was the environment. The angle between an environment and AEA measured its representativeness; therefore, the shorter the projection was from the marker of an environment, the more representative was the environment. According to Yan et al. (Reference Yan, Yang, Shah, Sánchez-Villeda, Li, Warburton, Zhou, Crouch and Xu2010), the shorter environmental vectors indicated that the specific environments were not strongly correlated with environments having longer vectors and were probably not strongly correlated with one another. Based on these requirements, KWH14, FUML14, FUMH14 and EJH14 with longer vectors and far away from the origin were more powerful in discriminating among the hybrids while FUML14 environment was the most representative. According to Yan and Tinker (Reference Yan and Tinker2006), an ideal test environment should effectively discriminate among genotypes and represent their mega-environment. Based on this criterion, FUML14 was identified as the ideal test environment. Also, EJH14 and KWH14 with long vectors and large angles could not be used in selecting superior hybrids, but could be used effectively in culling unstable genotypes.

Fig. 3. Colour online. The ‘discriminating power and representativeness’ view of GGE biplot on a genotype × environment yield data of 29 intermediate maturing maize hybrids evaluated in 12 environments. EJH14, Ejura high 2014; EJL14, Ejura low 2014; EJH13, Ejura high 2013; EJL13, Ejura low 2013; FUML13, Fumesua low2013; FUMH13, Fumesua high 2013; FUML14, Fumesua low 2014; FUMH14, Fumesua high 2014; KWL13, Kwadaso low 2013; KWH13, Kwadaso high 2013; KWH14, Kwadaso high 2014; KWL14, Kwadaso low 2014.
Genotype-by-trait analysis of hybrids under low- and high-N conditions
Presented in Fig. 4 is the polygon view of the GT biplot analysis showing the best/worst hybrids for specific traits under low-N conditions. Principal component (PRC) 1 and PRC 2 jointly explained about 58% of the total variation among traits of the hybrids. In a sector, the vertex hybrid is considered the best/worst for traits within the sector. The figure revealed that entry 1(CZL 0001 × 9071) was positioned at the vertex of the polygon for the sector containing GY, EHT, PLHT and EPP; 5 (CLWN 247 × 9071) for DP and DF; 28 (TZL Comp 3 × 1368) for PA, LS and ASI; 30 (ZM 521B-66-4-1-1 × 1368) for CA; 27 (Etubi) for SL; 16 (Laposta Seq C7-F71-1-1-2 × 87036) for CC and 6 (CZL 0713 × 87036) for RL. Similarly, Fig. 5 shows the polygon view of GT biplot analysis under high-N conditions. Both PRC 1 and PRC 2 accounted for 65% of the total variation among traits of the hybrids. Entry 1 (CZL 0001 × 9071) was at the vertex of the polygon in the sector that contains GY, EHT, PLHT and EPP; 9 for DF, DP and ASI; 30 for CA; 22 for SL and RL and 6 (CZL 0713 × 87036) for CC.

Fig. 4. Colour online. Polygon view of genotype-by-trait biplot of 13 traits of 30 selected intermediate maturing maize hybrids evaluated under low N conditions at three locations during 2013 and 2014 growing seasons. GY, grain yield; PLHT, plant height; EHT, ear height; EPP, number of ears per plant; RL, root lodging; SL, stalk lodging; CC, chlorophyll content; CA, cob aspect; PA, plant aspect; LS, leaf senescence; DP, days to pollen; DF, days to flowering; ASI, anthesis-silking interval.

Fig. 5. Colour online. The ‘which-won-where’ of genotype by trait interaction biplot of 13 traits of 30 selected intermediate maturing maize hybrids evaluated under high-N conditions at three locations during 2013 and 2014 growing seasons. GY, grain yield; PLHT, plant height; EHT, ear height; EPP, number of ears per plant; RL, root lodging; SL, stalk lodging; CC, chlorophyll content; CA, cob aspect; PA, plant aspect; LS, leaf senescence; DP, days to pollen; DF, days to flowering; ASI, anthesis-silking interval.
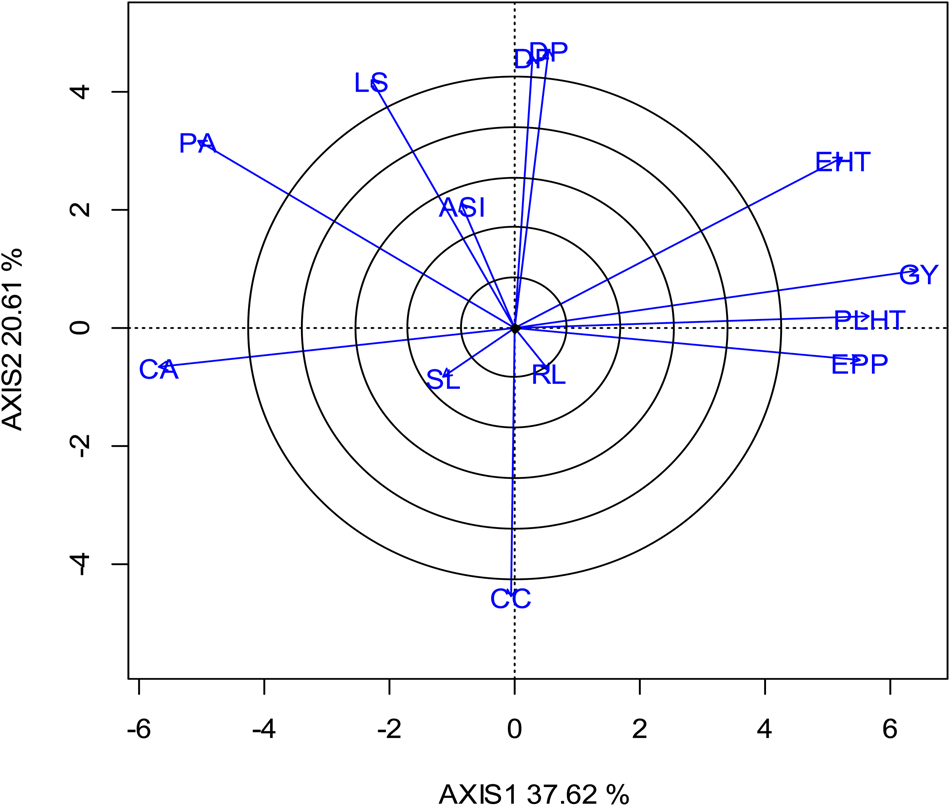
The biplot in Fig. 6 shows the relationships among agronomic traits of the hybrids under low soil nitrogen conditions. In the biplot, the line that connects a trait to the biplot origin is called a trait vector whereas the cosine of the angle between the vectors of a pair of traits is the genetic correlation coefficient between the two traits. Trait vectors at acute, right and obtuse angles indicate positive, weak or non-significant and negative genetic correlations, respectively. Thus, EPP, PLHT, EHT had a significant and positive genetic correlation with GY under low-N. Furthermore, PA, LS and CC were negatively correlated with GY whereas CA had a near-perfect negative linear relationship with GY. ASI, SL and RL had relatively short vectors, an indication of weak correlation with GY. Under high N, EPP, PLHT and EHT were positively correlated with GY although EHT had a relatively short vector (Fig. 7). High negative correlation was recorded between GY and each of PA, LS and CA while the correlations between GY and each of DF, DP, ASI and CC were weak.

Fig. 6. Colour online. A vector view of the genotype-by-trait biplot showing interrelationships among traits of 30 selected intermediate-maturing maize hybrids evaluated under low-N conditions at three locations during (2013 and 2014) growing season. GY, grain yield; PLHT, plant height; EHT, ear height; EPP, number of ears per plant; RL, root lodging; SL, stalk lodging; CC, chlorophyll content; CA, cob aspect; PA, plant aspect; LS, leaf senescence; DP, days to pollen; DF, days to flowering; ASI, anthesis-silking interval.

Fig. 7. Colour online. A vector view of the genotype-by-trait biplot showing interrelationships among traits of 30 selected intermediate-maturing maize hybrids evaluated under high-N conditions at three locations during (2013 and 2014) growing season. GY, grain yield; PLHT, plant height; EHT, ear height; EPP, number of ears per plant; RL, root lodging; SL, stalk lodging; CC, chlorophyll content; CA, cob aspect; PA, plant aspect; LS, leaf senescence; DP, days to pollen; DF, days to flowering; ASI, anthesis-silking interval.
Discussion
Genotype × environment effects were significant for most measured traits of the hybrids. This suggested that the performance of hybrids for most traits was not consistent across environments. These results are in agreement with the findings of Ifie (Reference Ifie2013), Badu-Apraku et al. (Reference Badu-Apraku, Akinwale, Franco and Oyekunle2012, Reference Badu-Apraku, Akinwale and Oyekunle2013a, Reference Badu-Apraku, Oyekunle, Fakorede, Vroh, Akinwale and Aderounmub, Reference Badu-Apraku, Oyekunle, Menkir, Obeng-Antwi and Yallouc) and Noëlle et al. (Reference Noëlle, Richard, Vernon, Martin, Laouali, Liliane T and Godswill2017) who reported significant genotype × environment interactions for maize grain yield and other agronomic traits under low N conditions. The GEI effects, however, were significant for only a few measured traits of the inbred lines suggesting that these lines responded similarly for most of the traits studied in the contrasting locations. Similar results were reported by Makumbi et al. (Reference Makumbi, Betràn, Bänziger and Ribaut2011) who found significant GEI for only two traits under low N. The environment and genotype × environment interaction effects across environments were significant for most traits indicating that the individual environments were unique and that hybrid and inbred selection would not be consistent across the environments. Except for high N conditions, the ANOVA showed that the environment accounted for the largest sum of squares for grain yield followed by the GEI and the genotypes. The large environmental effects indicated that the test environments were highly variable thus substantiating the need for the testing of genotypes in a wide range of sites over years as reported by Badu-Apraku et al. (Reference Badu-Apraku, Fakorede and Lum2007) and Badu-Apraku and Lum (Reference Badu-Apraku and Lum2010). Six hybrids: CZL 00001 × 9071, LapostaSEQC7-F18-3-2-1 × 9071, CLWN 364 × 9071, CLWN 247 × 9071, CML 395/CML 444 × 9071 and TZD II 68 × 1368 were identified among the 20 best hybrids under low N, high N and across environments. These hybrids had an inherent ability for outstanding performance under both low N and optimal conditions. Generally, farmers cultivate maize under varying soil fertility levels. In view of this, the high yield under low and high N conditions is desirable and these hybrids are appropriate for the test environments as they possess genes for general adaptation.
Under low N, the significant and positive GCA effects for grain yield were observed for the lines, CLWN 247, TZD II 68 and ZM523B-29-2-1-1-B*6 and the tester 9071. The contributions of tester and the lines demonstrate the high probability of contributing favourable alleles for superior yield performance to their progenies. Similarly, the significant and negative GCA effects observed for the stay green characteristic of CML 395/CML 444, CML 442, CZL 068, Laposta Seq C7-F71-1-1-2 and the tester 87036 indicated that these inbred lines would delay the senescence of their progenies and result in increased grain yield under low-N environments. Furthermore, the presence of significant GCAl, GCAt and SCA mean squares for all measured traits except the GCAl for plant aspect and SCA for plant height, ears per plant, stay green characteristic, plant aspect, husk cover and chlorophyll content indicated that both additive and non-additive gene actions were important for most of the measured traits and that there was a scope for the improvement of the measured traits through selection under low N. The non-significant SCA mean squares for plant height, ears per plant, stay green characteristic, plant aspect, husk cover and chlorophyll content in the present study indicated that non-additive gene effects were not important in the inheritance of these traits. Badu-Apraku et al. (Reference Badu-Apraku, Akinwale and Oyekunle2013a, Reference Badu-Apraku, Oyekunle, Fakorede, Vroh, Akinwale and Aderounmub, Reference Badu-Apraku, Oyekunle, Menkir, Obeng-Antwi and Yallouc) and Ifie (Reference Ifie2013) also reported non-significant SCA for stay green characteristic under low N. The preponderance of GCA mean squares over SCA mean squares implied that additive gene action was more important than non-additive gene action for most measured traits and that GCA was the major component accounting for the differences among the hybrids under low N environments. This is consistent with other results (Below et al., Reference Below, Brandua, Lambert, Teyker and Edmeades1997; Kling et al., Reference Kling, Oikeh, Akintoye, Heuberge, Horst and Edmeades1997; Tamilarasi et al., Reference Tamilarasi, Arumugachamy, Anantha and Utharasu2010; Ifie, Reference Ifie2013; Badu-Apraku et al., Reference Badu-Apraku, Akinwale and Oyekunle2013a, Reference Badu-Apraku, Oyekunle, Fakorede, Vroh, Akinwale and Aderounmub, Reference Badu-Apraku, Oyekunle, Menkir, Obeng-Antwi and Yallouc). However, this is contradictory to the results of Betràn et al. (Reference Betràn, Beck, Bänziger and Edmeades2003), Meseka et al. (Reference Meseka, Menkir, Ibrahim and Ajala2006), Makumbi et al. (Reference Makumbi, Betràn, Bänziger and Ribaut2011), Meseka et al. (Reference Meseka, Menkir, Ibrahim and Ajala2013), Ndhlela (Reference Ndhlela2012) and Noëlle et al. (Reference Noëlle, Richard, Vernon, Martin, Laouali, Liliane T and Godswill2017) who reported preponderance of non-additive gene effects over additive gene effects for grain yield under low N. The differences in these results could be attributed to the differences in the germplasm used. The implication of these results is that there is a need for routine testing of newly developed inbred lines for combining ability in order to ensure good genetic gains from selection for improved tolerance to low N.
Under high N environments, GCAl and GCAt mean squares were significant for all the measured traits except for ears per plant. The SCA effects were significant for grain yield, days to silking and anthesis, anthesis-silking interval, plant aspect and husk cover. This indicated that both additive and non-additive gene action were important in the inheritance of grain yield and other traits across high N environments. The significant SCA effects observed for ears per plant were an indication that non-additive gene action was important in the inheritance of ears per plant under high N environments. This is consistent with the findings of Ifie (Reference Ifie2013). The preponderance of GCA mean squares over SCA mean squares implied that additive gene action was more important than non-additive gene action for most measured traits and that GCA was the major component accounting for the differences among the single cross hybrids. With preponderance of GCA over SCA variance, early generation testing may be more effective and promising hybrids could be identified and selected mainly based on the prediction from GCA effects.
In order to identify maize cultivars with stable and high yield performance under low N as well as under high N conditions for commercialization, the GGE biplot was adopted to decompose the GEI. For a hybrid to be released and commercialized, it must demonstrate both high average yield performance and high stability across locations (Kaya et al., Reference Kaya, Akcura and Taner2006; Yan and Tinker, Reference Yan and Tinker2006; Jalata, Reference Jalata2011; Badu-Apraku et al., Reference Badu-Apraku, Akinwale, Ajala, Menkir, Fakorede and Oyekunle2011a,Reference Badu-Apraku, Akinwale, Menkir, Obeng-Antwi, Osuman, Coulibaly, Onyibe, Yallou, Abdullai MS and Didjerab). Crop breeders work to develop cultivars that have high yield in various agro-climatic conditions, and the most adapted cultivars created in the areas of their cultivation (Anuarbek et al., Reference Anuarbek, Abugalieva, Chudinov, Tuberosa, Pecchioni and Turuspekov2019). The most stable hybrids in this study were CML 494 × 1368 (12), TZD II 134 × 9071 (8), CML 395/CML 444 × 9071 (6) and TZD II 68 × 1368 (5). These hybrids should be selected for further testing across multiple locations to confirm the consistency of performance and commercialized.
Badu-Apraku and Lum (Reference Badu-Apraku and Lum2010) reported that farmers in West Africa are slow in adopting stress-tolerant maize hybrids and open-pollinated varieties. He attributed this to the erroneous perception that maize genotypes selected under stress environments might be adapted to the stress environments and that such genotypes would produce less yield in stress-free environments. Consequently, high yielding hybrids selected in both low- and high-N environments are desirable. The result of the present study revealed that hybrid CZL 0001 × 9071 because of its elevated grain yield, increased number of ears per plant, desirable ear and plant heights under both low- and high-N conditions was the highest yielding under each of the two research conditions. Hybrids with high values for such traits as DP, DF, PA, CA, ASI, LS, RL and SL were not agronomically desirable and were thus considered inferior. For instance, hybrid CLWN 247 × 9071 was the vertex hybrid for the sector containing DP and DF. This indicated that this hybrid was the latest to reach anthesis and silking whereas TZL Comp 3 × 1368 and ZM 521B-66-4-1-1 × 1368 were the vertex hybrids for sectors containing PA and CA, respectively. These hybrids were therefore considered susceptible to low-N conditions.
Breeders and geneticists require precise information on interrelationships among agronomic traits, including grain yield for significant genetic gains from selection (Badu-Apraku et al., Reference Badu-Apraku, Akinwale and Oyekunle2013a, Reference Badu-Apraku, Oyekunle, Fakorede, Vroh, Akinwale and Aderounmub, Reference Badu-Apraku, Oyekunle, Menkir, Obeng-Antwi and Yallouc). Therefore, one of the important objectives of the present study was to identify appropriate secondary traits for selecting for high grain yield in intermediate maturing maize under low- and high-N conditions. The relatively short trait vectors observed for SL, RL and ASI under low-N conditions indicated that these traits were not important in selecting intermediate maturing maize hybrids for tolerance to low-N. This result is inconsistent with the findings of Badu-Apraku et al. (Reference Badu-Apraku, Fakorede, Annor and Talabi2018). The significant genetic correlations recorded between GY and PLHT, EPP, EHT, CA and PA implied that the improvement of these traits would lead to significant gains in grain yield under low-N conditions. Badu-Apraku et al. (Reference Badu-Apraku, Fakorede, Annor and Talabi2018) reported similar findings. The authors indicated that PA, CA, PLHT, SL and DF were more appropriate selection criteria for improving grain yield in early maturing maize under low-N conditions. However, EHT was not identified as a selection criterion in their study. The differences in the results of the two studies were attributable to the differences in the genetic materials used for the studies. Similarly, the strong inter-trait relationship observed between GY and EPP, PLHT, CA, PA as well as LS under high-N conditions indicated that these traits have significant direct and indirect effects on grain yield under high-N conditions and would therefore be effective for selecting for improved grain yield under high-N. Additionally, the identification of CA, PA, PLHT and EPP as selection indices under the two N environments suggested that these traits could be employed for simultaneous improvement of grain yield under the contrasting growing conditions. The high and positive genetic correlation between DP and DF under low-N, as well as DF, DF and ASI under high-N conditions implied that either of the traits would suffice for field evaluations of intermediate maturing maize, thus reducing the time and resources spent assaying traits in field trials, without sacrificing precision. It is surprising to note that chlorophyll content, the green pigment in leaves, which is vital for photosynthesis in plants, had weak correlations with GY under both low- and high-N conditions. The plausible explanation for this is that the chlorophyll content of the leaves of the maize plants under the research conditions, low-N in particular, might have been above the critical minimum below which, photosynthetic activities could have been impaired.
Conclusion
The hybrids CML 494 × 1368, TZD II 134 × 9071, CML 395/CML 444 × 9071 and TZDII 68 × 1368 were identified as the highest yielding and most stable. The significant and positive GCA effects observed for grain yield of inbreds CLWN 247, TZD II 68, ZM523B-29-2-1-1-B*6 and the tester 9071 under low-N environments indicated that the inbreds are invaluable resource for breeding for low-N tolerant hybrids as well as for introgression into tropical maize populations. Additionally, the preponderance of GCA mean squares over SCA mean squares implied that additive gene action was more important than the non-additive for most measured traits under low N environments. Finally, the strong inter-trait relationship observed between GY and EPP, PLHT, CA, PA as well as LS under high-N conditions indicated that these traits have significant effects on grain yield under high-N conditions and would be effective for selecting for improved grain yield.
Acknowledgements
The authors are grateful to the staff of West Africa Centre for Crop Improvement (WACCI), University of Ghana, CSIR-Crop Research Institute (CRI), the International Institute of Tropical Agriculture (IITA) and the International Centre for maize and wheat improvement (CIMMYT),
Financial support
This work was supported by the Bill & Melinda Gates Foundation [OPP1134248] and the Alliance for a Green Revolution in Africa (AGRA).
Conflict of interest
The authors declare there are no conflicts of interest.
Ethical standards
Not applicable.
Appendix: List of rainfall and temperature figures for 2013 and 2014
Council for Scientific and Industrial Research – Crops Research Institute, Library Material, 2015