INTRODUCTION
Stereotactic body radiotherapy (SBRT) is non-invasive and efficient treatment modality for inoperable tumours of different sites including lung,Reference McGarry, Papiez and Williams 1 – Reference Okunieff, Petersen and Philip 3 with the goal to optimise maximum dose to the target, that is to the planning target volume (PTV), while maximally sparing surrounding normal tissues, such as lungs and other organs-at-risk. The SBRT treatment plans are generated using either three-dimensional conformal planning (3DCP), intensity-modulated radiation therapy (IMRT) or volumetric-modulated arc therapy (VMAT) approaches, and are judged by spatial dose distribution and dose volume histograms (DVH). The 3DCP plans involve multiple coplanar or non-coplanar static treatment fields, in general 8–12 fields, and dose is calculated using forward planning. Although in the IMRT plans similar field setup is used, as in 3DCP, but dose distribution is calculated using inverse planning. On the other hand, in the VMAT plans 2–6 coplanar or non-coplanar, or sometimes more, full or partial arcs are used.
In present era, various dose calculation algorithms, with tissue inhomogeneity correction, are used in commercial treatment planning systems (TPS). 4 However, each algorithm uses different models of inhomogeneity correction and has its own limitations, hence the choice of dose calculation algorithm is particularly important for the SBRT, especially when lungs are included in the treatment.
Routinely, the merit of treatment plans is evaluated using spatial dose distribution and DVH, but the evaluation of biological effects is not done even there has been significant progress in the radiobiological modelling in order to understand normal tissue complications and tumour cell response.Reference Lyman 5 – Reference Kutcher, Burman, Brewster, Gotein and Mohan 11 The AAPM Task Group 166 reportReference Allen, Alber and Deasy 12 recommends that dose–volume constraints and the biologic optimisation function be used together for optimisation and evaluation.
This study was designed to investigate the variation in PTV parameters, dosimetric and radiobiological dose homogeneity index (HI) and PTV quality coverage index (QCI) of SBRT plans generated using Pencil Beam Convolution (PB), Anisotropic Analytical Algorithm (AAA), Acuros XB (AXB) and Collapsed Cone Convolution (CCC) dose calculation algorithms with respect to plans using Monte Carlo (MC) dose calculation algorithms. The PB and MC algorithms housed in BrainLab iPlan (BL), AAA and AXB in Eclipse (EC), and CCC in ADAC Pinnacle (AP) TPS.
METHODS AND MATERIALS
Patients and treatment planning
This retrospective study includes 31 targets of 30 anonymised lung SBRT patients treated on Varian Novalis linear accelerator with 6 MV photon beam. Prescription dose (PD) of 50 Gy was given in 5 fractions with 10 Gy dose in each fraction. Three-dimensional conformal treatment plans were generated using PB algorithm, commissioned in BrainLab iPlan using 8–12 non-coplanar static treatment fields. These plans, hereinafter, are referred as BrainLab Pencil Beam (BL_PB) plans. When MC algorithm was commissioned in the BrainLab iPlan, all BL_PB plans were recalculated using BrainLab MC (BL_MC) algorithm to determine the difference between BL_PB calculated and actual delivered doses. In these BL_MC calculated plans, referred as BrainLab MC non-optimised (BL_MCNO) plans, same beam parameters and calculation grid, including monitor units (MUs), as in BL_PB plans, were used. To investigate the dose calculation accuracy of AAA, AXB and CCC algorithms, the DICOM data of BL_PB plans, including computerized tomography (CT) images and radiotherapy structures, were exported to Eclipse (EC) and ADAC Pinnacle (AP) TPS, and optimised treatment plans were generated. In the optimised plans, same beam parameters and calculation grid, except MUs and beam weights, were used as in BL_PB plans. In these plans the dose was prescribed for >95% PTV dose coverage (RTOG Protocol 0813), 13 and were named as Eclipse AAA Optimised (EC_AAAOP), Eclipse AXB Optimised (EC_AXBOP) and ADAC Pinnacle CCC Optimised (AP_CCCOP) plans. To avoid variation in dose calculations, same dataset of machine parameters, beam data and CT electron density were used to commission treatment machine and CT simulator in EC and AP planning systems.
Treatment planning evaluation
The ICRU Report 83Reference DeLuca, Jones and Gahbauer 14 has recommended the use of near minimum dose D 98%, mean dose D 50%, near maximum dose D 2%, etc. dose–volume quantities in the planning and evaluation of an IMRT treatment plan. For evaluation of dose distribution in the PTV, different dose HI definitions are reported in the literature.Reference Shamsi, Atiq, Atiq, Buzdar and Iqbal 15 – Reference Kehwar, Jones, Huq, Beriwal, Benoit and Smith 17 The ICRU Report 83Reference DeLuca, Jones and Gahbauer 14 definition of HI is more realistic, which characterises the uniformity of the dose distribution within the PTV and is given by
 $$HI_{d} \,{\equals}\,{{D_{{2\,\%\,}} {\minus}D_{{98\,\%\,}} } \over {D_{{50\,\%\,}} }}$$
where subscript ‘d’ represents dosimetric quantity.
The coverage index (CI) characterises the degree to which the target volume receives prescribed dose (D p). The CI is the volume-based index used to characterise quality of brachytherapy interstitial implants.Reference Kehwar, Akber and Passi 16 , Reference Kehwar, Jones, Huq, Beriwal, Benoit and Smith 17 In this investigation, the QCI has been proposed in terms of dosimetric quantity as
 $$QCI_{d} {\equals}{{D_{{98\,\%\,}} } \over {D_{p} }}$$
The HI d and QCI d are physical quantities, which do not account radiobiological behaviour of the dose distribution within PTV. The D 2%, D 50%, D 98% and D p doses were used in forthcoming Equations (5–7) to calculate equivalent dose to 2 Gy per fraction (EQD2) scheme, and above described indices were redefined in terms of EQD2 to account for radiobiological behaviour of the plans. These indices are termed as biological indices, which account for radiobiological aspects of the dose distribution within PTV, and are given by
 $$HI_{b} {\equals}{{EQD2_{{2\,\%\,}} {\minus}EQD{\rm 2}_{{98\,\%\,}} } \over {EQD{\rm 2}_{{50\,\%\,}} }}$$
and
 $$QCI_{b} {\equals}{{EQD2_{{98\,\%\,}} } \over {EQD2_{\rm p} }}$$
where subscript ‘b’ represents biological parameter, and EQD22%, EQD250%, EQD298% and EQD2 p are localised EQD2 values corresponding to D 2%, D 50%, D 98% and D P doses within PTV. Generalised term of above defined EQD2 can be written by
 $$EQD{\rm 2}_{{x{\rm \,\%\,}}} {\equals}{{BED_{{x\,\%\,}} } \over {1{\plus}{2 \over {\alpha \,/\,\beta }}}}$$
where BED x% (or BED p ) is defined as follows:
 $$BED_{{x{\rm \,\%\,}}} {\equals}D_{{x{\rm \,\%\,}}} \left( {1{\plus}{{{\rm }d_{{x{\rm \,\%\,}}} } \over {\alpha \,/\,\beta }}{\rm }} \right)\quad \quad {\rm for}\quad d_{{x\,\%\,}} \leq D_{t} $$
and
 $$BED_{{x\,\%\,}} {\equals}nd_{{x\,\%\,}} \left( {1{\plus}{{2D_{t} } \over {\alpha \,/\,\beta }} } \right){\minus}{{nD_{t}^{2} } \over {\alpha \,/\,\beta }}\quad \quad {\rm for}\quad d_{{x\,\%\,}} \geq D_{t} $$
Equations (6) and (Reference Lyman and Wolbarst7) are the expressions of the linear-quadratic-linear (LQ-L) model,Reference Kehwar, Chopra and Rai 18 where the linear-quadratic model smoothly transition to the LQ–L model at a transition dose, D t .
Standardised calculation algorithm
Dobler et al.Reference Dobler, Walter and Knopf 19 reported that the difference between the dose distributions of the nine field treatment plan calculated with MC and film measurement in the phantom was below 2% with a maximum error of –1.9% for CTV and maximum of 3% for PTV. Study by Carrasco et al.Reference Carrasco, Jornet and Duch 20 shows that an average difference between MC simulations and the reference dose measurements was 0.4±1.2% (1 SD). Mesbahi et al.Reference Mesbahi, Thwaites and Reilly 21 used 8 and 15 MV photon beams for dose measurements of 4×4 and 10×10 cmReference Joyner, Salter and Papanikolaou 2 field sizes for posterior fields of single lung and for lateral fields of thorax. The lung and thorax doses for these fields were calculated by the MC method and were found to be in excellent agreement with measurements, showing local differences of no more than 2% for all measured points. In our previous study,Reference Chopra, Cecilio, Sethi, Kehwar and Rai 22 a phantom study was conducted to compare measured doses with that of calculated by BL_MC algorithm in homogeneous solid water, heterogeneous lung and heterogeneous lung with bone density phantoms. The doses for smaller fields less than 1.5×1.5 cm in heterogeneous lung phantoms with or without bone density material calculated by BL_MC algorithm were within 3% for all field sizes and depths in above mentioned phantoms. In another study, Sethi et al.Reference Sethi, Leo, Kabat and Cecilio 23 had reported that the doses calculated in homogeneous and hetero-bone phantoms by the MC algorithm were in agreement with measurements within 3% with that of the measured doses for all field-sizes and depths. Based on the results of above described studies, the MC algorithm was considered as the reference dose calculation algorithm to investigate potential discrepancies in the algorithms studied in the report.
RESULTS AND DISCUSSION
Dosimetric parameters, D max, D 2%, D 50% and D 98%, were calculated from the DVHs of the PTVs for BL_PB, BL_MCNO, BL_MCOP, EC_AAAOP, EC_AXBOP and AP_CCCOP plans. Corresponding radiobiological parameters, EQD2max, EQD22%, EQD250% and EQD298% were calculated using Equations (6) and (7). In the calculation of BED x%, the values of radiobiological parameters of the LQ–L model used from Table 1.Reference Kehwar, Chopra and Rai 18
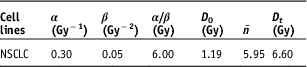
Table 1 Parameter values for non-small cell lung cancers used in the LQ–L model to calculate equivalent dose to 2 Gy per fraction (EQD2)

Abbreviation: NSCLC, non-small cell lung cancer.
Physical and radiobiological quality indices (QIs) corresponding to D x% and EQD2x%, respectively, were calculated using Equations (1–4). The physical doses (D x%), radiobiological doses (EQD2 x%) and QIs of, studied plans, are listed in Table 2.
Table 2 The mean values (mean±standard deviation) of dosimetric, radiobiological doses and quality indices with 95% confidence interval (CI) and range for SBRT plans generated by BL_PB, EC_AAA, EC_AXB #and AP_CCC algorithms
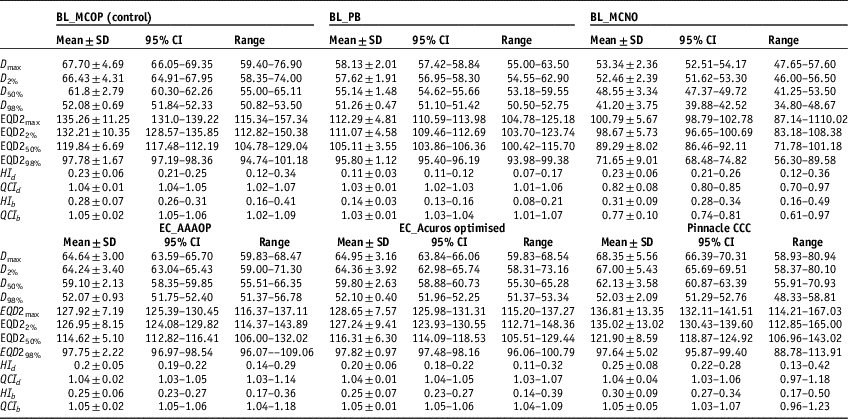
Abbreviations: SBRT, stereotactic body radiotherapy; EQD2, equivalent dose to 2 Gy per fraction; HI, homogeneity index; QCI, quality coverage index.
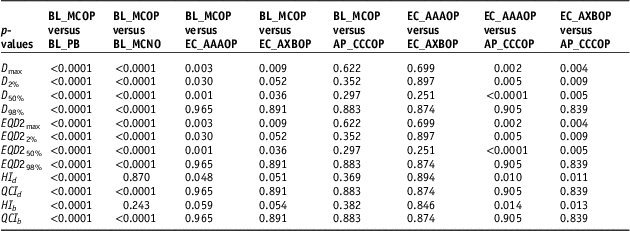
To compare statistical significance at p<0.05 between different parameters of the plans, the student t-test was applied, and p-values are listed in Table 3.
Table 3 p-values calculated using two-tailed paired t-student test to compare dosimetric, radiobiological doses and quality indices for SBRT plans generated by BL_PB, EC_AAA, EC_AXB and AP_CCC algorithms

Abbreviations: SBRT, stereotactic body radiotherapy; EQD2, equivalent dose to 2 Gy per fraction; HI, homogeneity index; QCI, quality coverage index.
It is seen that values of D 98% (or EQD298%), in Table 2, for EC_AAAOP, EC_AXBOP and AP_CCCOP plans do not have statistically significant difference with that of BL_MCOP plans (p-values in Table 3). However, D98% for BL_PB and BL_MCNO are significantly different compared to BL_MCOP. The values of D 50% (or EQD250%) and D max (or EQD2max) of BL_PB, BL_MCNO, EC_AAAOP and EC_AXBOP plans, but not that of AP_CCCOP plans, have statistically significant difference with that of BL_MCOP plans; and the values of D 2% (or EQD22%) for BL_PB, BL_MCNO and EC_AAAOP, but not EC_AXBOP and AP_CCCOP plans, are significantly different than that of BL_MCOP plans. In fact, the values of D x% (or EQD2 x%) for BL_MCOP and AP_CCCOP have no statistically significant difference. Similarly, the comparison between the values for D x% (EQD2 x%) for EC_AAAOP and EC_AXBOP plans do not reveal any significant difference.
Comparison between quality indices (QIs), Table 2, reveals that the values of dosimetric and biological QIs of BL_PB plans are significantly different than that of BL_MCOP plans, whereas the comparison of the QIs of BL_MCOP and BL_MCNO show statistically significant difference, except dosimetric and biological HIs of BL_MCNO plans. On the other hand, the comparison of dosimetric and biological QIs of BL_MCOP plans with EC_AAAOP, EC_AXBOP and AP_CCCOP show no significant difference (p-values in Table 3).
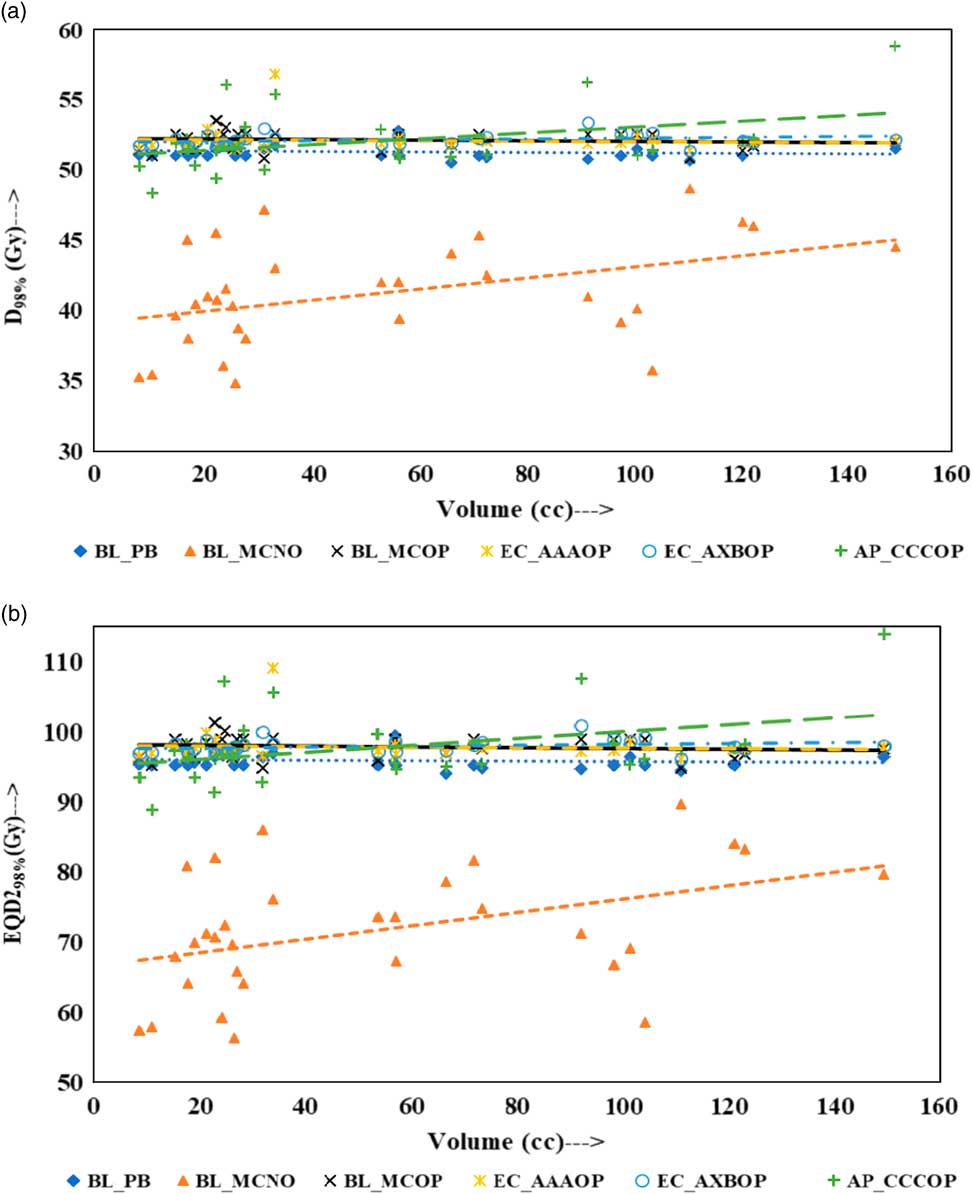
Physical doses, D x% and corresponding radiobiological doses, EQD2 x%, plots are shown in Figures 1–4 to demonstrate the variation with PTV volume. Figures 1a and 1b present a plot between PTV volume versus D max and PTV volume versus EQD2max, respectively. In these plots, the highest position of the point are seen for AP_CCCOP plans, whereas lowest positions are for BL_MCNO plans. Similar pattern of variation in D 2% and EQD22% (Figures 2a and b); and D 50% and EQD250%, (Figures 3a and b) is seen for AP_CCCOP and BL_MCNO plans. Figures 1a–3a, for D max, D 2% and D 50% (or in Figures 1b–3b, for EQD2max, EQD22% and EQD250%) show that for BL_MCOP and AP_CCCOP plans the points are widely scattered about the best fit linear regression lines. The slopes of D 98% (or EQD298%) for BL_MCOP, EC_AAAOP and EC_AXBOP best fit lines are almost 0, that is, the values of D 98% (or EQD298%) are independent of PTV volume, whereas the slopes for these best fit lines for BL_MCNO and AP_CCCOP are positive, that is, the values of D 98% (or EQD298%) increases with PTV volume. The slopes of best fit lines of D 50% (or EQD250%) for BL_PB, EC_AAAOP and EC_AXBOP plans are approximately 0, and for BL_MCNO, AP_CCCOP are positive, whereas for BL_MCOP are negative. In Figures 1a–2a, for D max, D 2% and in Figures 1b–2b, for EQD2max, EQD22%, the slopes of the best fit lines for BL_PB and BL_MCNO are positive, whereas for others are negative. The physical and biological doses, in EC_AAAOP and EC_AXBOP plans, are not statistically different from one other. On the other hand, the slope of the best fit regression lines, for BL_PB and BL_MCOP plans are statistically similar (p-values in Table 3), whereas physical and biological doses are different (p-values in Table 3).
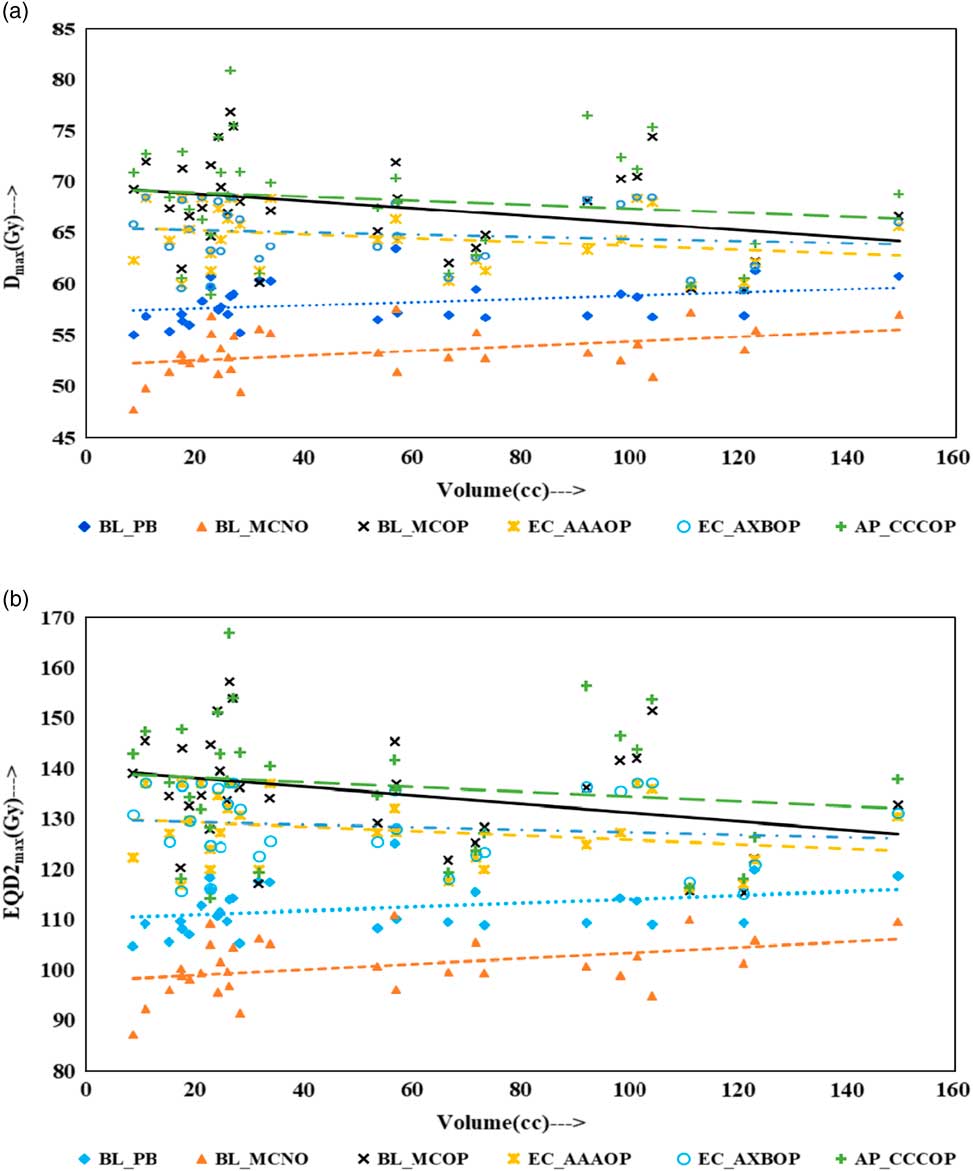
Figure 1 Plot between planning target volume versus (a) D max and (b) equivalent dose to 2 Gy per fraction (EQD2max).
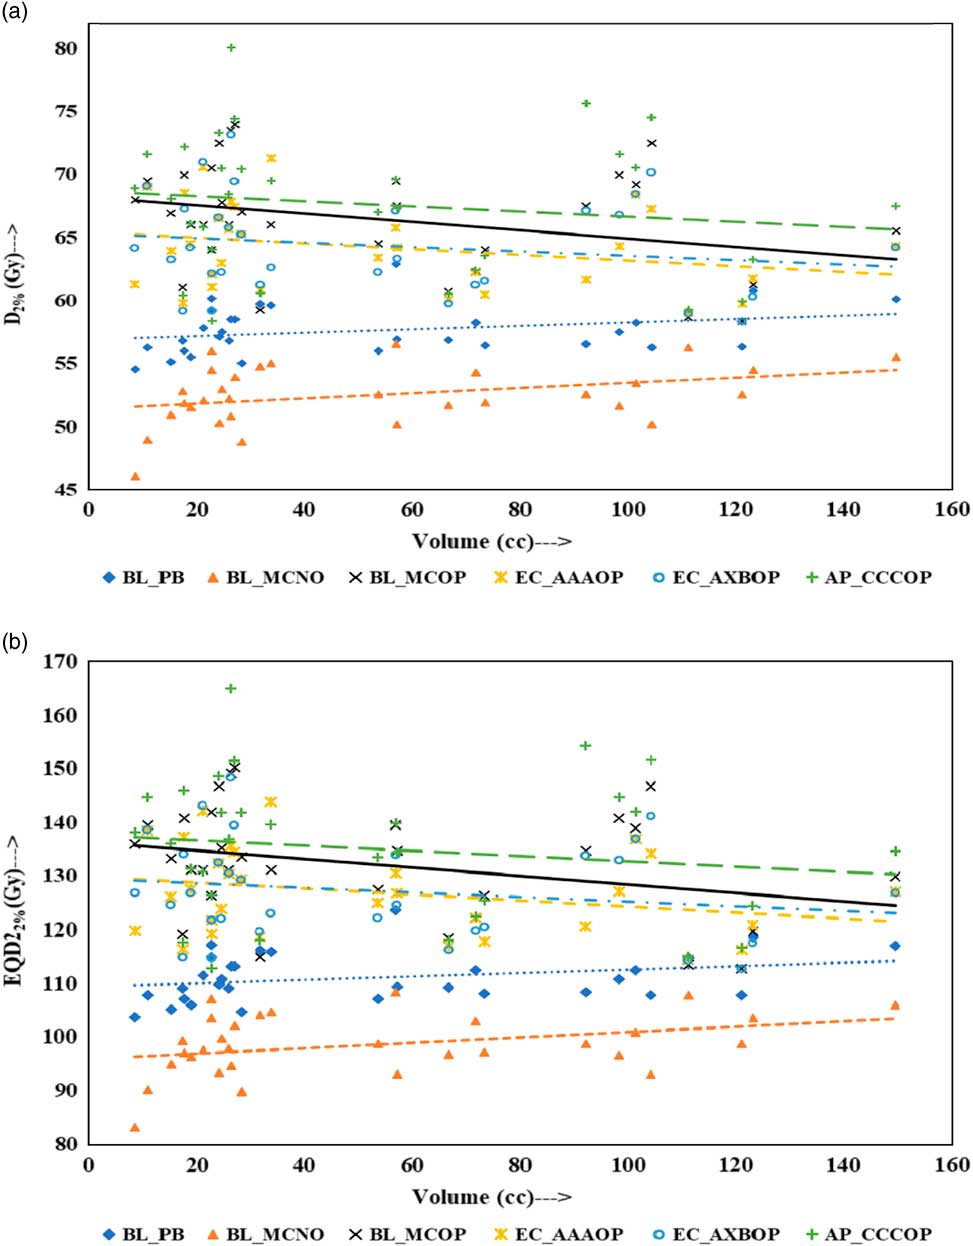
Figure 2 Plot between planning target volume versus (a) D 2% and (b) equivalent dose to 2 Gy per fraction (EQD22%).
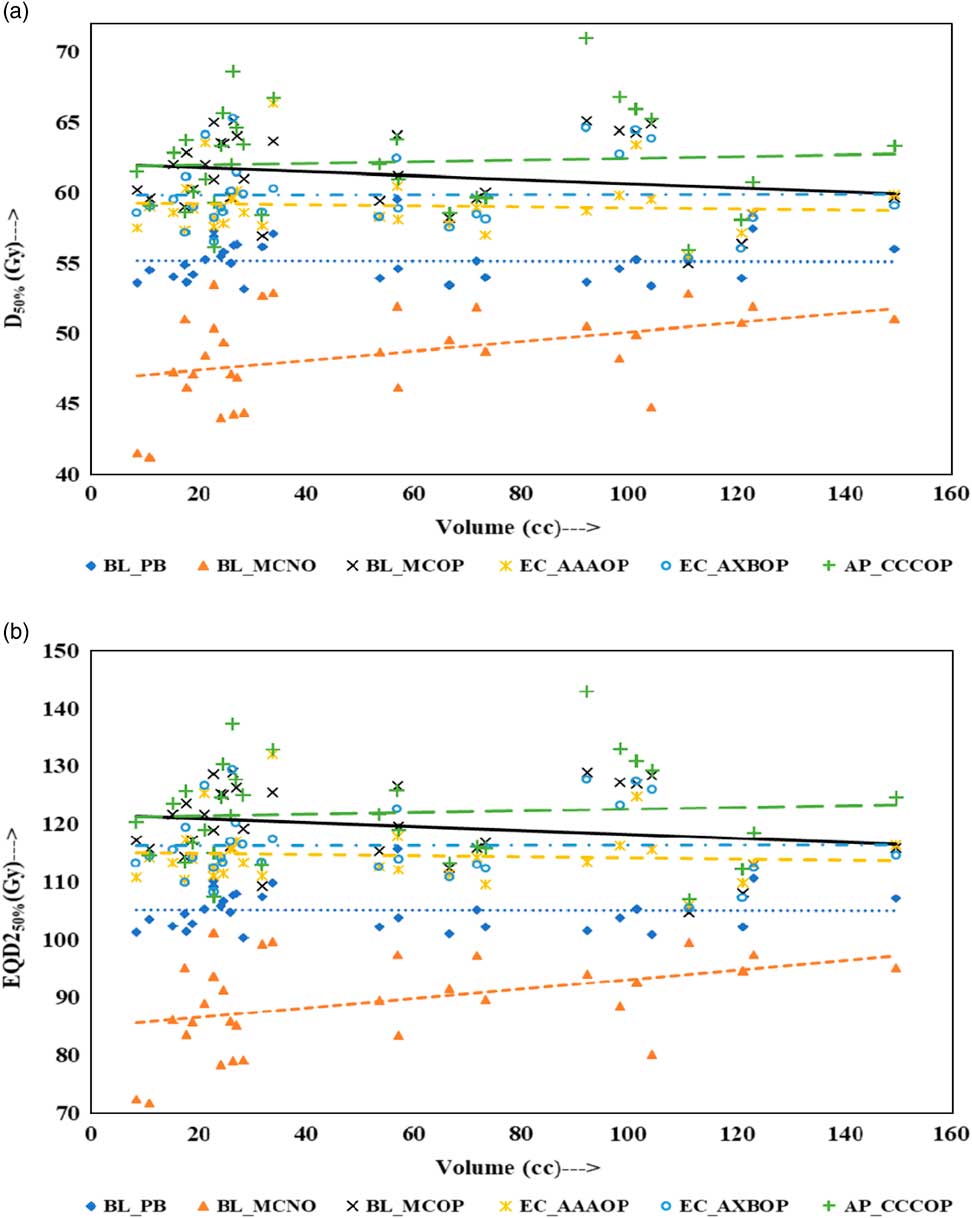
Figure 3 Plot between planning target volume versus (a) D 50% and (b) equivalent dose to 2 Gy per fraction (EQD250%).

Figure 4 Plot between planning target volume versus (a) D 98% and (b) equivalent dose to 2 Gy per fraction (EQD298%).
The comparison of the results of the BL_PB and BL_MCNO plans revealed that BL_PB algorithm overestimates D max, D 2%, D 50% and D 98% by an average of 4.79±1.26 Gy, 5.17±1.34 Gy, 6.59±2.91 Gy and 10.06±3.76 Gy, respectively, and corresponding EQD2max, EQD22%, EQD250% and EQD298% by 11.50±3.03 Gy, 12.40±3.21 Gy, 15.82±6.99 Gy and 24.15±9.02 Gy, respectively. This difference is also seen in Table 2, and Figures 1–4, and is the largest discrepancies in the dose calculations, compared with the BL_MCOP, EC_AAAOP, EC_AXBOP and AP_CCCOP plans. Alite et al. Reference Alite, Jain, Sethi, Melian and Emami 24 had studied 25 lung SBRT patients planned with PB algorithm. The treatment plans were normalised to deliver >95% of the PD of 50 Gy in 5 fractions to 21 patients and 60 Gy in 5 fractions to four patients. These plans were recalculated with MC algorithm without changing any beam parameters to determine actual dose delivered. The mean difference in D mean, D 90 and D 99 doses delivered to PTV was 10.8±5%, 16.7±9% and 18±7%, respectively, compared with PB calculated doses (p<0.0001).
For small PTV volumes (~8 cc), dosimetric and radiobiological parameters of EC_AAAOP and EC_AXBOP plans have significant difference with that of BL_MCOP plans (p<0.05). This dose difference decreases with increasing PTV volume and becomes insignificant (p>0.05) at large PTV volumes (≈150 cc). On the other hand, the difference in dosimetric and radiobiological parameters of AP_CCCOP and BL_MCOP plans increases with increasing PTV volume and becomes statistically significant at larger PTV volumes (p<0.05).
As shown in Fig 4a (or 4b), D 98% (or EQD298%) for optimised plans calculated by BL_MC, EC_AAA, EC_AXB and AP_CCC algorithms, for small PTV volumes, do not have statistically significant difference (p>0.05), whereas at higher PTV volumes the doses calculated by AP_CCC algorithm, are higher and have significant difference than those calculated by BL_MC, EC_AAA and EC_AXB algorithms (p<0.05). On the other hand, the doses calculated for higher PTV volumes by BL_MC, EC_AAA and EC_AXB algorithms do not have statistically significant difference (p>0.05).
The comparison of the values of plan indices (dosimetric and biological), HI and QCI, of BL_MCOP plans with that of EC_AAAOP, EC_AXBOP and AP_CCCOP plans show no significant difference (p>0.05), except dosimetric HI of EC_AAAOP plans. The level of difference between QIs of BL_MCOP and AP_AAAOP plans is negligible (p>0.4), while it is about 5% for HI (dosimetric and biological) of BL_MCOP with that of EC_AAAOP and EC_AXBOP plans, but at predefined statistical significance at p<0.05, there is no significant difference (p≥0.05). Tables 2 and 3, also show that the values of QCI (dosimetric and biological) of BL_MCOP plans are not significantly different than those of EC_AAAOP and EC_AXBOP plans (p>0.85).
The values HI of AP_CCCOP plans are significantly different (p<0.014) than that of EC_AAAOP and EC_AXBOP plans, except QCIs (p>0.84). On the other hand, no significant difference was found in intercomparing HI and QCI of EC_AAAOP with EC_AXBOP plans (p>0.85).
In this study, the dose prescribed for >95% PTV dose coverage gives comparable D 98% doses for optimised plans, which provide similar QCI. On the other hand, for dose prescription of >95% PTV dose coverage, the differences in average D max compared with BL_MCOP doses are −3.06 Gy for EC_AAAOP, −2.76 Gy for EC_AXBOP and 0.65 Gy for AP_CCCOP; and in average D 2% are −2.19 Gy for EC_AAAOP, −2.07 Gy for EC_AXBOP and 1.17 Gy for AP_CCCOP. Corresponding differences in average EQD2max from BL_MCOP doses are −7.34 Gy for EC_AAAOP, −6.61 Gy for EC_AXBOP and 1.55 Gy for AP_CCCOP; and in average EQD22% are −5.26 Gy for EC_AAAOP, −4.97 Gy for EC_AXBOP and 2.80 Gy for AP_CCCOP. These values illustrate that at the periphery of the PTV the doses are overestimated by EC_AAA and EC_AXB, and underestimated by AP_CCC algorithms. The periphery of the PTV is in the region of high inhomogeneity at the junction of tumour and lung tissues as well as in the penumbra region of the radiation fields. Results of this study reveal that EC_AAA and EC_AXB algorithms do not accurately account electron transport in this region, whereas AP_CCC algorithm is closer of BL_MC algorithm. The lower values of HIs in EC_AAAOP and EC_AXBOP plans are due to overestimation of the doses at the junction of tumour edge and lung tissue. On the other hand, the AP_CCC algorithm underestimates peripheral PTV doses at tumour and lung tissue junction.
In plan comparison assessing the accuracy of BL_PB, EC_AAA, EC_AXB and AP_CCC algorithms using BL_MC algorithm as reference, the PTV parameters were used to allow the mutual comparison of EC_AXB algorithm with EC_AAA algorithm, and showed levels of discrepancies that are likely to influence the treatment outcomes. AAPM TG 105Reference Benedict, Yenice and Followill 25 reports that a difference between 5 and 10% in dose calculation may result in 10-20% change in tumour control probability or about 20–30% change in normal tissue complication probability.
The parameters, HI and QCI, describing the discrepancies between different algorithms combine the dose homogeneity within the PTV and PTV coverage. The QCI is an important quality parameter to compare treatment plans including SBRT plans, where HI reveals the dose gradient within the PTV.
CONCLUSION
In this work, the PTV parameters of lung SBRT plans generated by BL_PB, BL_MC, EC_AAA, EC_AXB and AP_CCC algorithms were compared to assess the merit and accuracy of the algorithms. The patients were originally treated using BL_PB plans and then recalculated or planned keeping same beam parameters as in BL_PB plans. The results of this study, conclude that the dose inhomogeneity within the PTV is comparable for EC_AAAOP and EC_AXBOP plans, however, it is lower than in BL_MCOP and AP_CCCOP plans. At small tumour volume <10cc, the PTV parameters, HI and QCI of these plans reveal that AP_CCC algorithms calculates doses within 2% accuracy, whereas EC_AAA and EC_AXB within 5% accuracy compared with BL_MC plans. The level of inaccuracy increases with increasing tumour volume in AP_CCCOP plans, while it decreases for EC_AAAOP and EC_AXBOP plans. Hence, it can be concluded that for small tumour volumes, the AP_CCC algorithm, and for large tumour volumes the EC_AAA and EC_AXB algorithms give comparable results to those of BL_MC model.
Acknowledgements
None.