


I. INTRODUCTION
A study by X-ray powder diffraction of alpha lipoic acid (ALA, Figure 1) was carried out as part of our continuing interest on the structural characterization of active pharmaceutical ingredients and the formation of possible new polymorphs. The chemical nature of the material and their thermal stability were examined using spectroscopy (FTIR and RAMAN) and thermal analysis [thermogravimetric analysis (TGA)–differential scanning calorimetry measurements (DSC)].

Figure 1. Chemical structure of alpha lipoic acid.
ALA is a naturally occurring compound that is synthesized in small amounts by plants and animals, including humans. ALA is covalently bound to specific proteins, which function as cofactors for several important mitochondrial enzyme complexes (Carreau, Reference Carreau1979; Reed, Reference Reed2001). ALA is used for its antoxidant effects in the treatment of diabetic neuropathy. It has been tried in the treatment of liver dysfunction and in subacute necrotizing encephalopathy (Sweetman, Reference Sweetman2009). A search of the Cambridge Structural Database, V. 1.18 (Allen, Reference Allen2002), of the lipoic acid omitting hydrogen atoms resulted in four entries, two of them for lipoic acid (Refcodes: THOCAR, THOCAR01) and two for complexes. The Powder Diffraction File (PDF)-4 also contain two entries with an experimental unindexed pattern (PDF: 00-007-0585, 00-007-0553) (ICDD, Reference Kabekkodu2012).
In the pharmaceutical industry, it is important to properly characterize all the materials, active, and inactive ingredients (excipients), involved in the manufacture of a drug, in order to determine possible amorphous, polymorphs, solvates, hydrates forms, just as transitions of crystalline phases in the solid state, and physicochemical stability caused by the different processes they are subjected during the preparation of a formulation. X-ray powder diffraction to play an important role in the characterization in solid state of materials associated with the formulation of pharmaceutical products.
II. EXPERIMENTAL
A. Crystallization and density determination
Alpha lipoic acid, a sample of commercial formulation, was dissolved in mixture ethanol:water. After filtering the extract was allowed to evaporate at room temperature. The density of crystal obtained of crystallization process was determined by the flotation method using potassium iodide solution at various concentrations.
B. IR and RAMAN spectroscopy
The Fourier transform infrared spectroscopy (FT-IR) spectra were recorded in KBr pellets, using an IS50 FT-IR Nicolet Thermo Scientific spectrophotometer, a register range 4000–400 cm−1, with 32 scans per sample and an optical speed of 0.4747 cm s−1. The RAMAN spectra was performed in a LabRam HR Evolution using a laser at 532 nm with 100% attenuation to 3 s, a 100× objective applying fluorescence correction in a range of 4000–200 cm−1.
C. Thermal analysis, TGA–DSC
TGA and DSC were performed in a Thermal Analyzer DTA/DSC Instrument Serie Discovery, With mass flow 50.0 ml min−1, equilibrate at 2500 °C, ramp at 1000 °C min−1 to 50,000 °C for TGA and 55,000 °C for DSC analysis. Both experiments were performed under a nitrogen atmosphere.
D. X-ray powder diffraction data collection
Powder diffraction patterns were recorded on a BRUKER D8 ADVANCE diffractometer using CuKα radiation (λ = 1.5406 Å), operating at 40 kV and 40 mA. The patterns were recorded in steps of 0.0156° (2θ), from 4° to 60° at 1 s step−1. The diffractometer was equipped with the primary and secondary Soller slits of 2.5°, divergence slit of 0.6 mm, nickel filter of 0.02 mm, and a LynxEye detector. PowderX program (Dong, Reference Dong1999) was used to remove the background (Sonneveld and Visser, Reference Sonneveld and Visser1975), smoothing (Saviztky and Golay, Reference Saviztky and Golay1964), to eliminate the Kα 2 component (Rachinger, Reference Rachinger1948) and the second derivative method was used to determine the peak-observed positions and intensities.
III. RESULTS AND DISCUSSION
Yellow blocks were obtained by the slow evaporation experiment. In the RAMAN spectrum (top, Figure 2), the strong band corresponding to the vibration S–S is observed at 511 cm−1. The vibration C–S appears at 679 cm−1 and a strong band at 240 cm−1 corresponds to aliphatic chains. In the FTIR spectrum (below, Figure 2), the C–H stretching appears at 2942–2967 cm−1. The absorption band C = O is observed at 1705 cm−1. Between 3400 and 2600 cm−1 appears the stretching band O–H of carboxylic group. Both spectrums clearly show the chemical nature of the compound under study.

Figure 2. (Color online) RAMAN spectrum (top) and IR spectrum (below) of lipoic acid.
The lipoic acid crystallized melts at 64 °C, according to the first endotherm in DSC analysis (right, Figure 3). This is a similar behavior to reported, 60–62 °C (Sweetman, Reference Sweetman2009). The TGA curve (left, Figure 3) shows that the material is stable up to 150 °C, experiencing weight loss 93.30% at ~160–260 °C. This loss is associated with the second endotherm in the DSC curve. These correspond to the total decomposition of ALA.

Figure 3. (Color online) DSC (right) curve and TGA curve (left) of lipoic acid.
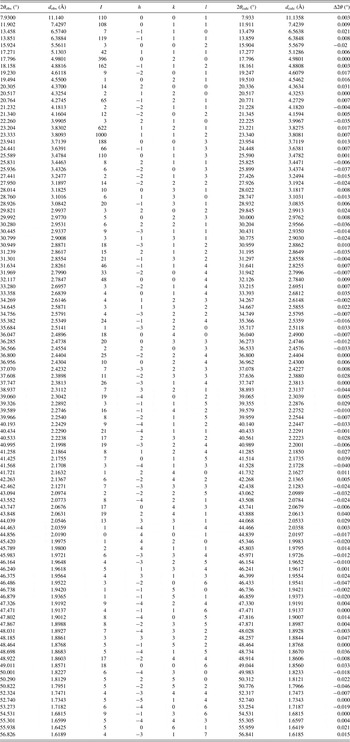
The experimental powder diffraction pattern is different from those contained in the PDF-4 database but similar to the pattern calculated using THOCAR crystal data (Figure 4). The indexing of pattern recorded for the crystallized material carried out with DICVOL14 (Boultif and Loüer, Reference Boultif and Loüer2014). The analysis of the entire pattern (102 diffraction maxima) with NSB*AIDS83 (Mighell et al., Reference Mighell, Hubbard and Stalick1981), resulted in a unit-cell monoclinic with parameters: a = 9.237(1) Å, b = 9.960(1) Å, c = 11.787(2) Å, β = 109.13(1)°, and V = 1024.6(2) Å3; and de Wolf (Reference de Wolff1968) and Smith and Snyder (Reference Smith and Snyder1979) figures of merit associated are M20 = 28.5 and F30 = 63.5 (0.0124, 38). This pattern, in PD3 format, will be submitted for inclusion in the PDF. The set of reflections observed are consistent with space group P21/a and was estimated by the CHEKCELL program (Laugier and Bochu, Reference Laugier and Bochu2002). Table I contains the corresponding powder diffraction data. The fitting of the whole pattern with the Le Bail algorithm in FULLPROF program (Rodriguez-Carvajal, Reference Rodriguez-Carvajal1990) accounts for all the diffraction maxima recorded.

Figure 4. (Color online) Comparison of the powder diffraction pattern of lipoic acid (red) with PDF 00-007-0585 (blue), PDF 00-007-0553 (green), and pattern calculated using THOCAR data (gray).
Table I. X-ray powder diffraction data of alpha lipoic acid.
The Z = 4 was estimated by density obtained by the flotation method [d = 1.35(1) g cm−3], and the calculate density, using this Z-value and the volume obtained from the indexing process, was 1.34 g cm−3, similar to measured density.
SUPPLEMENTARY MATERIAL
The supplementary material for this article can be found at https://doi.org/10.1017/S0885715616000658.
ACKNOWLEDGEMENTS
The authors acknowledge to the support of Vicerrectoría de Investigación y Extensión, Universidad Industrial de Santander (UIS) and Parque Tecnológico Guatiguará, UIS, Piedecuesta, Santander, Colombia, Laboratorio de Investigación en Polímeros for recording TGA-DSC data, Laboratorio de Espectroscopia for FTIR and RAMAN spectra register and Laboratorio de Difracción de Rayos-X, for recording X-ray fluorescence and X-ray diffraction data.


