I. INTRODUCTION
Powder X-ray diffraction (XRD) is widely used for quantitative phase analysis (QPA) of ores and processed material in the iron ore industry. Indeed, Raven and Birch (Reference Raven and Birch2017) have recently coordinated an international Round Robin on the QPA of iron ores. Iron ore sinter is a complex composite material of ~40–70 wt% iron oxides (hematite, Fe2O3, and magnetite, Fe3O4), 20–50 wt% Ca-rich ferrite phases, up to 10 wt% glasses, and up to 10 wt% calcium silicates of which larnite, Ca2SiO4, is the most common (Patrick and Lovel, Reference Patrick and Lovel2001). Most of the Ca-rich ferrite phases contain some silica and are known collectively by the acronym SFCA (i.e. silico-ferrite of calcium and aluminium). There are two main types of SFCA discussed in the scientific literature – SFCA and SFCA-I – each having a distinct crystal structure (Mumme et al., Reference Mumme, Clout and Gable1998) and, therefore a distinct diffraction pattern which has been exploited in in situ diffraction-based investigations of the formation mechanisms of SFCA and SFCA-I phases (Webster et al., Reference Webster, O'Dea, Ellis and Pownceby2017a, and references therein). SFCA and SFCA-I are considered to be important phases which impact on physical properties of iron ore sinter such as sinter strength, reduction degradation, and reducibility. They are, however, difficult to quantify, especially via image analysis but also by XRD since the inadequacy of the available crystal structure models for the SFCA phases can make Rietveld refinement-based QPA, especially by non-specialist operators, of materials containing these phases problematic.
Partial least-squares regression (PLSR) analysis has been shown by König et al. (Reference König, Degen and Norberg2014) and König and Norberg (Reference König and Norberg2015) to enable prediction of sinter basicity (CaO:SiO2 ratio) and Fe2+ content – the latter in particular being a key marker of sinter quality and used for process control – from powder XRD data without the need for rigorous mineralogical analysis by the operator. As well, the traditional wet chemical method for Fe2+ determination can take several hours to complete, and more rapid feedback for the purpose of process control is desirable. The PLSR approach first derives a function that links observed values of the variable of interest (e.g. Fe2+ content) to observed values of other independent variables (e.g. XRD data). This function is then used to predict observed values when only the independent variables are available.
High reducibility, high mechanical strength, and low reduction degradation are direct indicators of sinter quality; the ability to determine sinter strength, for example, rapidly through XRD and without the need for time-consuming physical property testing could be a powerful capability suitable for process control. The pot-grate tumble index (TI) is the industry standard method for assessing iron ore sinter strength (Ware et al., Reference Ware, Manuel, Raynlyn and Lu2013), and we recently reported a preliminary assessment of the potential for PLSR to be used as a method for prediction of TI from powder XRD data (Webster et al., Reference Webster, Pownceby, Ware and Pattel2017b). Here we further assess the suitability of PLSR for the prediction of sinter TI through a new set of samples, as well as make a preliminary assessment of the effect of 2θ range on the analysis which will influence how rapid the XRD data collections can be performed.
II. EXPERIMENTAL
Laboratory-based compact sinter tests were carried out using the method described by Clout and Manuel (Reference Clout and Manuel2003). The <1 mm size fraction of five natural iron ores were fluxed to 2.4 basicity using limestone, then compacted into Ni pots using a press to form 4 g tablets. Samples were heated in a tube furnace in a pO2 = 5 × 10⁻³ atm under a standard heating profile, held at the desired set point (in the range 1200–1320 °C) for 3 min before being rapidly cooled in nitrogen to produce fired compacts. The fired compacts were then tumbled in a modified bond abrasion tester for 8 min, sieved and the compact TI recorded as the percentage of material retained above 2 mm.
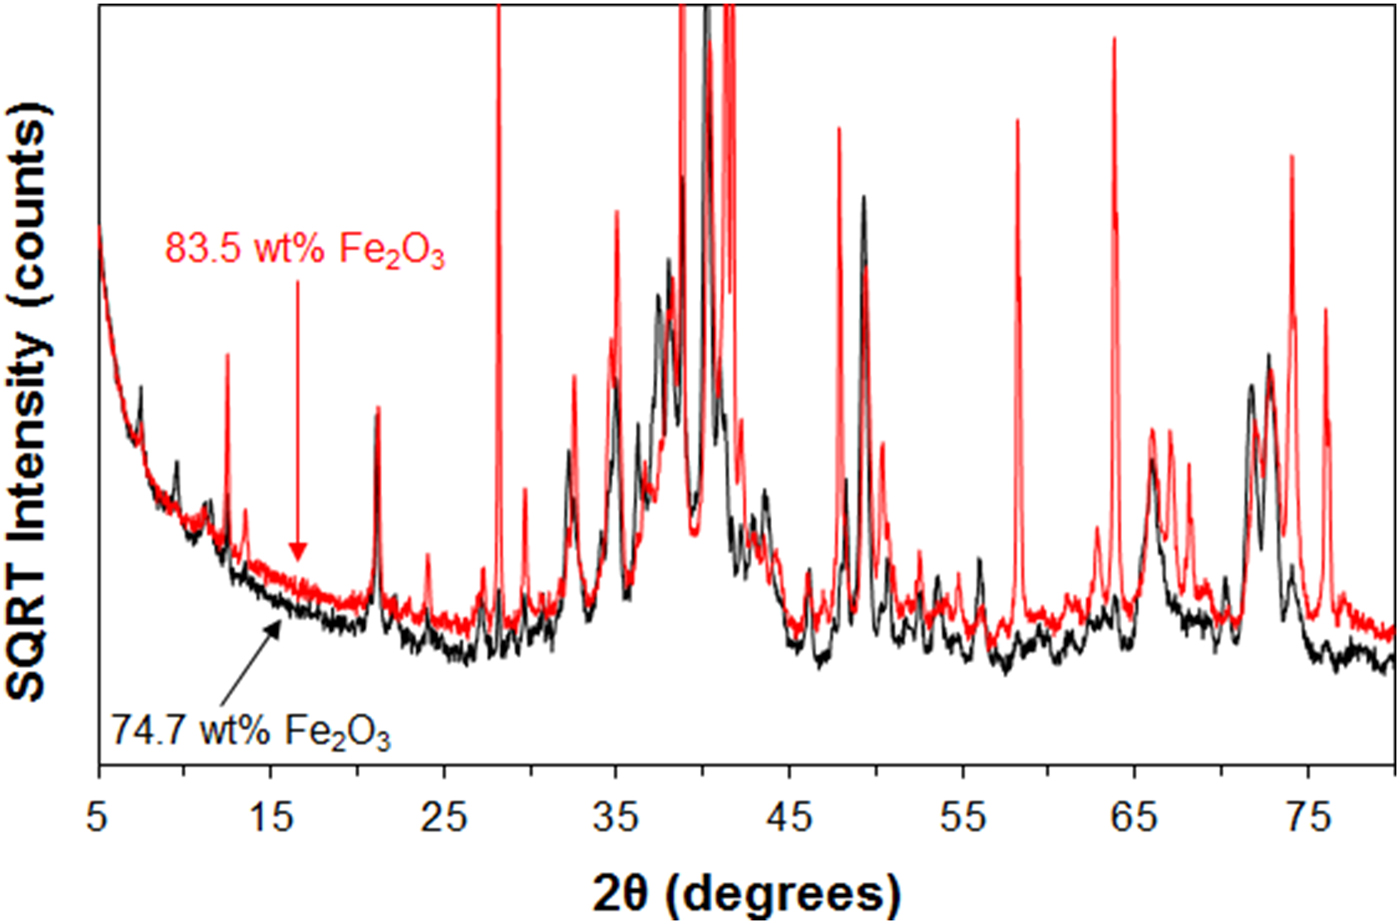
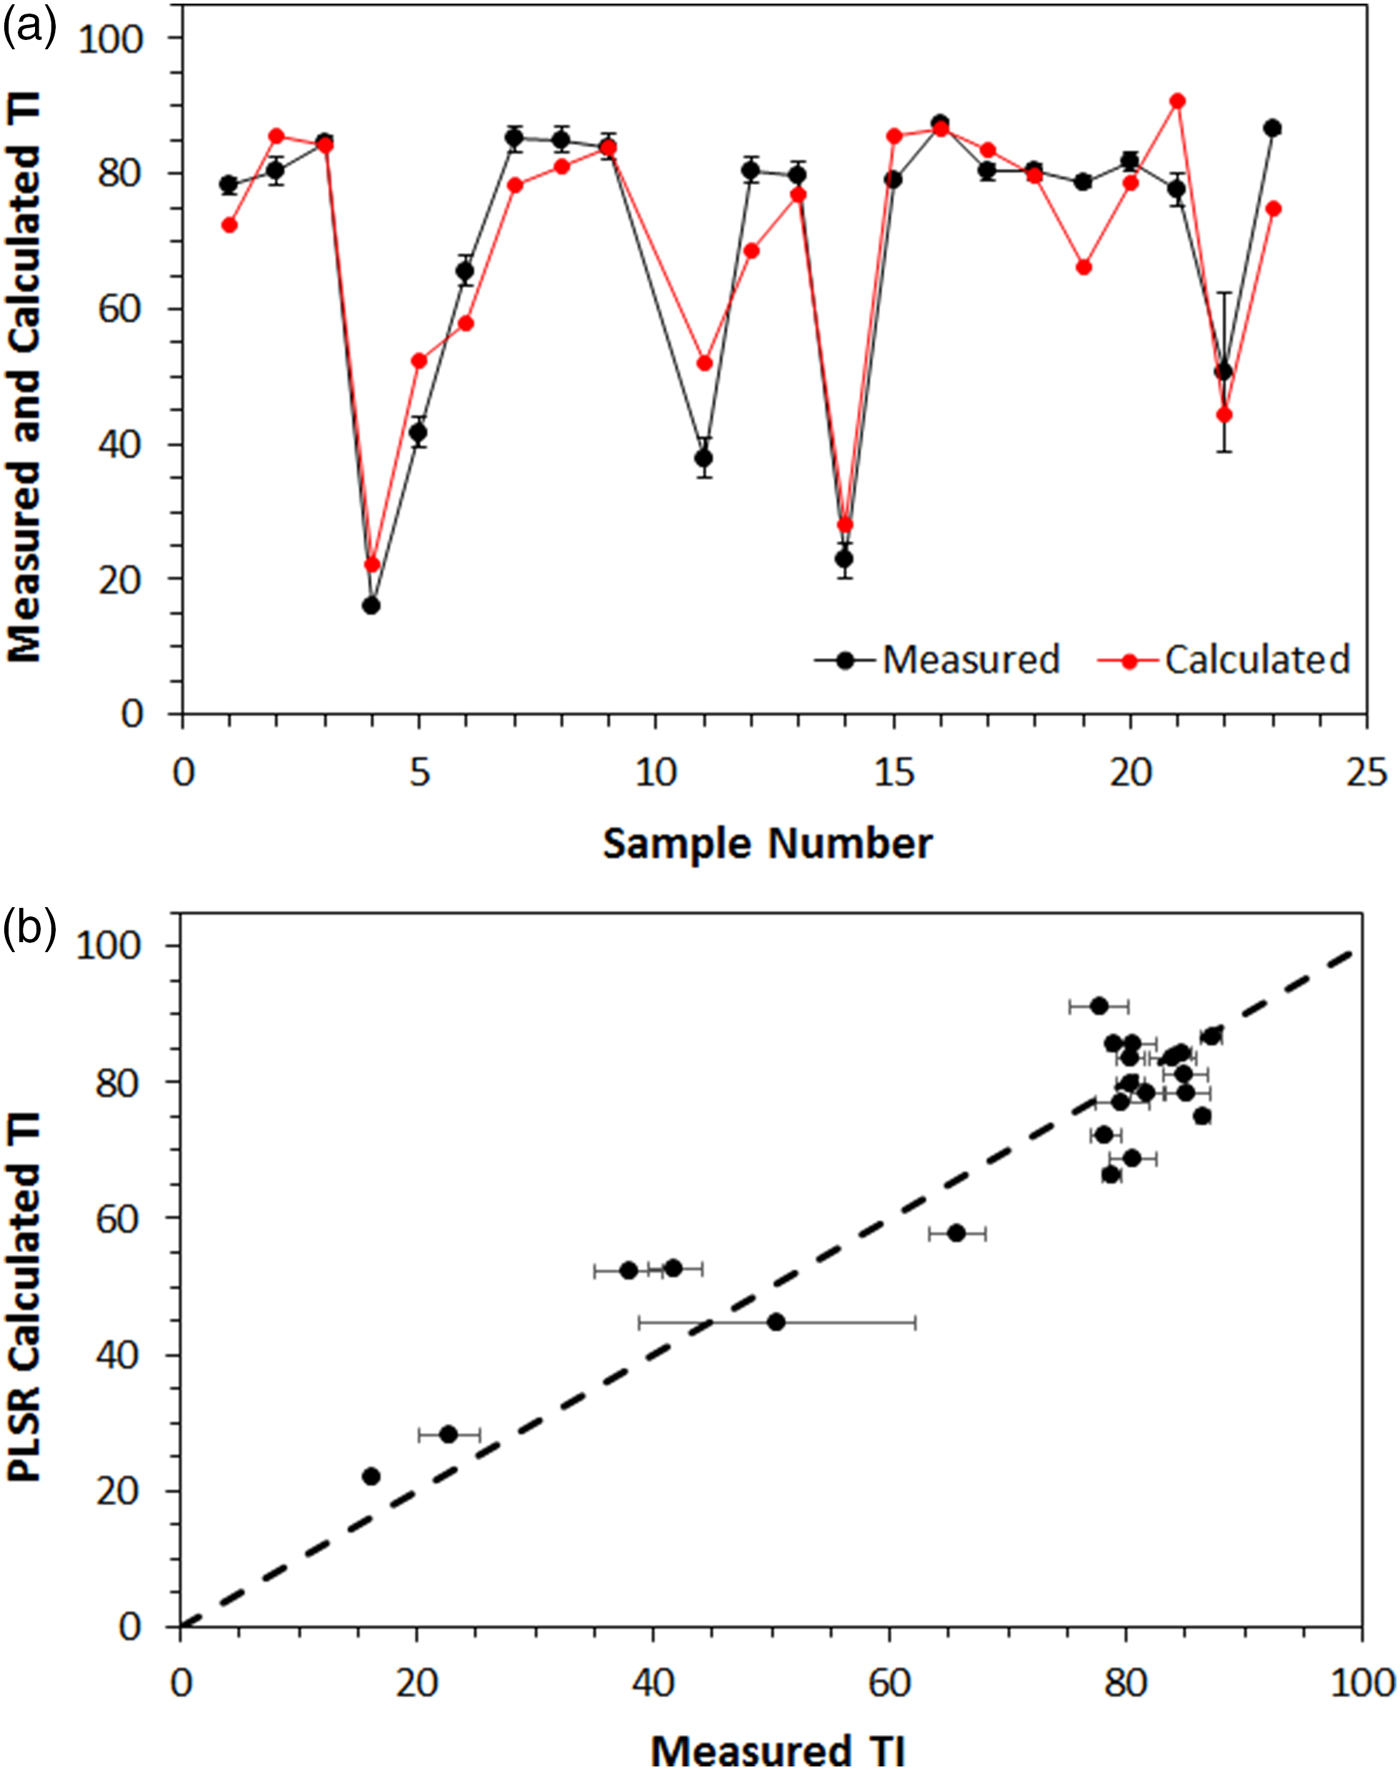
Tumbled compact samples were then crushed using a percussion mortar to <500 µm, and micronised in ethanol for 4 min g−1. Powder XRD data were collected over the range 5° ≤ 2θ ≤ 80° on micronised samples using a PANalytical MPD fitted with Co tube, post-diffraction graphite monochromator, and an X'Celerator detector used in one-dimensional mode (active length of 2.122° 2θ). PLSR analysis was carried out using PANalytical HighScore Plus V4.1. The calibration model was ‘trained’ using 32 samples/datasets, and tested on 22 different samples/datasets. Background subtraction was applied to account for minor background variation with ore composition, with increasing background with Fe content (Figure 1) consistent with the study of Fransen (Reference Fransen2004). Similar to the approach described by König and Norberg (Reference König and Norberg2015), an optimal regression model was found automatically using the PLSR tool in the HighScore Plus software. The optimal number of PLSR factors was found to be 6 with the scaling mode ‘Center’, and the root-mean-square error of prediction (RMSEP) was 13.41 [Figure 2(a)]. Figure 2(b) shows the PLSR fit to the calibration data.

Figure 1. (Color online) XRD patterns collected for sinter samples prepared from iron ore samples with varying bulk composition, with total Fe content expressed as wt% Fe2O3.

Figure 2. (Color online) (a) Optimisation plot in HighScore Plus showing two tested scaling modes, the number of factors used and the RMSEP (root-mean-square error of prediction) for a calibration set of compact sinter samples/XRD patterns, and (b) the PLSR fit to the calibration data.
III. RESULTS AND DISCUSSION
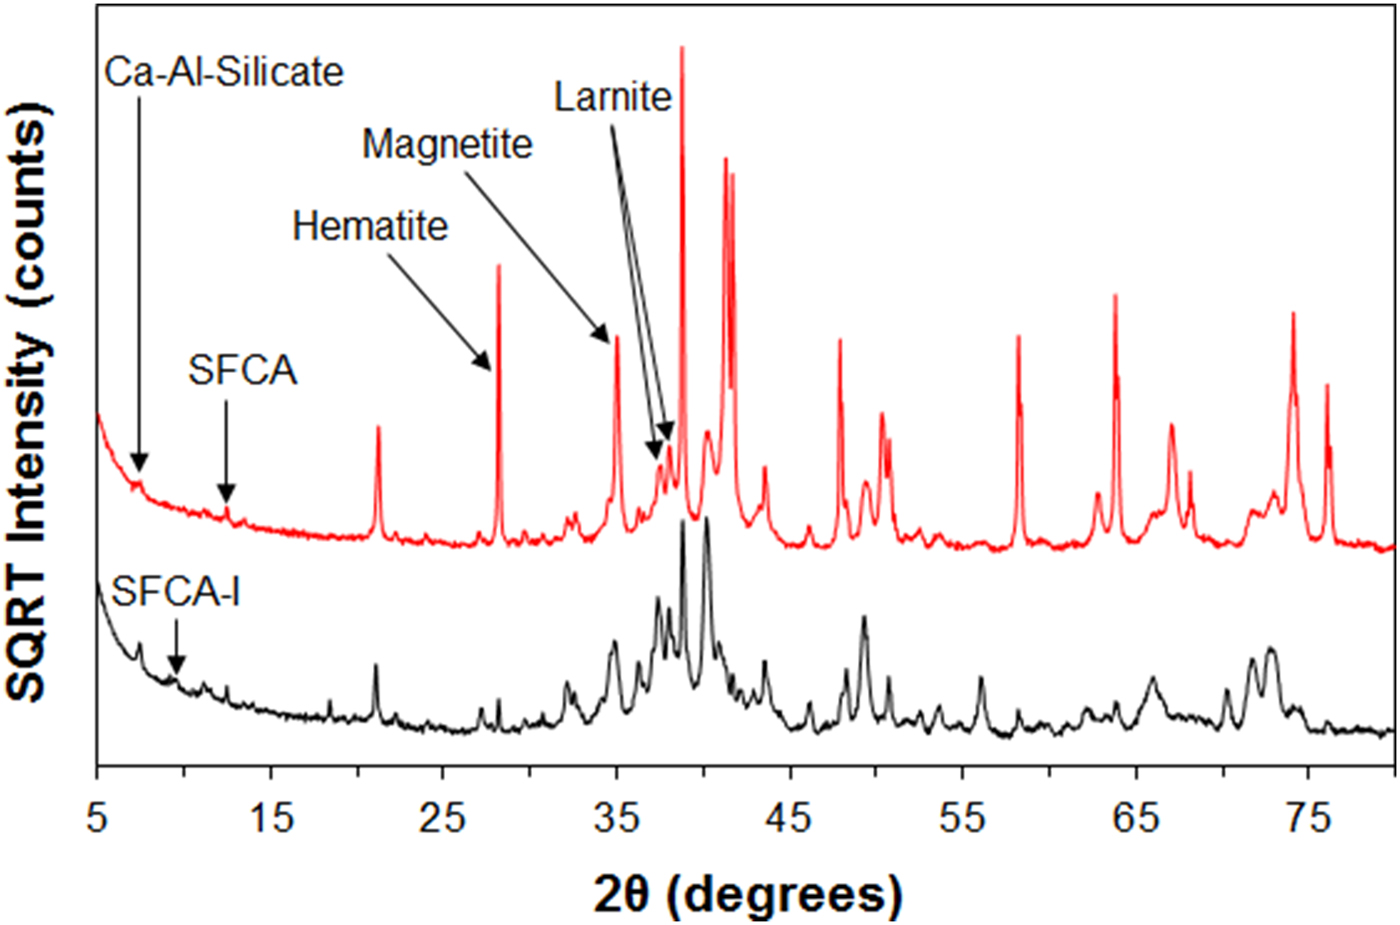
Figure 3 summarises the outcomes of the PLSR analysis applied to the 22 test samples/datasets. Trends in measured TI variation are followed by the calculated TI values. This is despite significant variations in mineralogy even for samples with similar measured TI values (Figure 4). The peaks attributed to Ca-Al-Silicate in Figure 4 have previously been observed in the study of Pownceby et al. (Reference Pownceby, Webster, Manuel and Ware2015, Reference Pownceby, Webster, Manuel and Ware2016). The other phases observed – magnetite, hematite, larnite, SFCA, and SFCA-I – are the typical iron ore sinter phases which have been widely reported.

Figure 3. (Color online) Plots of calculated vs. measured tumble index (TI) values for a series of compact sinter test samples. In (b) correlation coefficient (R 2) = 0.87. The dashed line in (b) is not a line of best fit, it is simply a line showing where prediction = correlation. The error bars on the measured TI values show ± standard deviation of repeat measurements.

Figure 4. (Color online) XRD patterns collected for sinter samples with TI = 80.5 (lower) and 80.3 (upper). Here, patterns have been offset in the intensity axis for clarity.
A characteristic feature of the XRD patterns collected for the samples which exhibited low TI (≤ 40%) was the presence of a significantly higher amount of SFCA compared to the samples with the high (~80%) TI values. The correlation observed in Figure 3(b) was similar to that reported by Webster et al. (Reference Webster, Pownceby, Ware and Pattel2017b), and so this may be an indication of the limitations of the PLSR method as applied to iron ore sinter TI prediction. However, for the purposes of process control, this level of accuracy would inform an operator whether or not the process was operating within acceptable limits, or whether there was a potential problem (e.g. fuel rate or flux addition too low for the given ore feedstock) requiring further investigation or rapid intervention.
Figure 5 summarises the outcomes of the PLSR analysis when the upper 2θ angle was cropped at 55°. Clearly, the correlation between the calculated and measured TI values is lower than in Figure 3, and this is especially true for the samples which exhibited very low TI index. For the purposes of process control, this level of accuracy may no longer be sufficient to reliably inform an operator whether or not the process was operating within acceptable limits, or whether there was a potential problem.
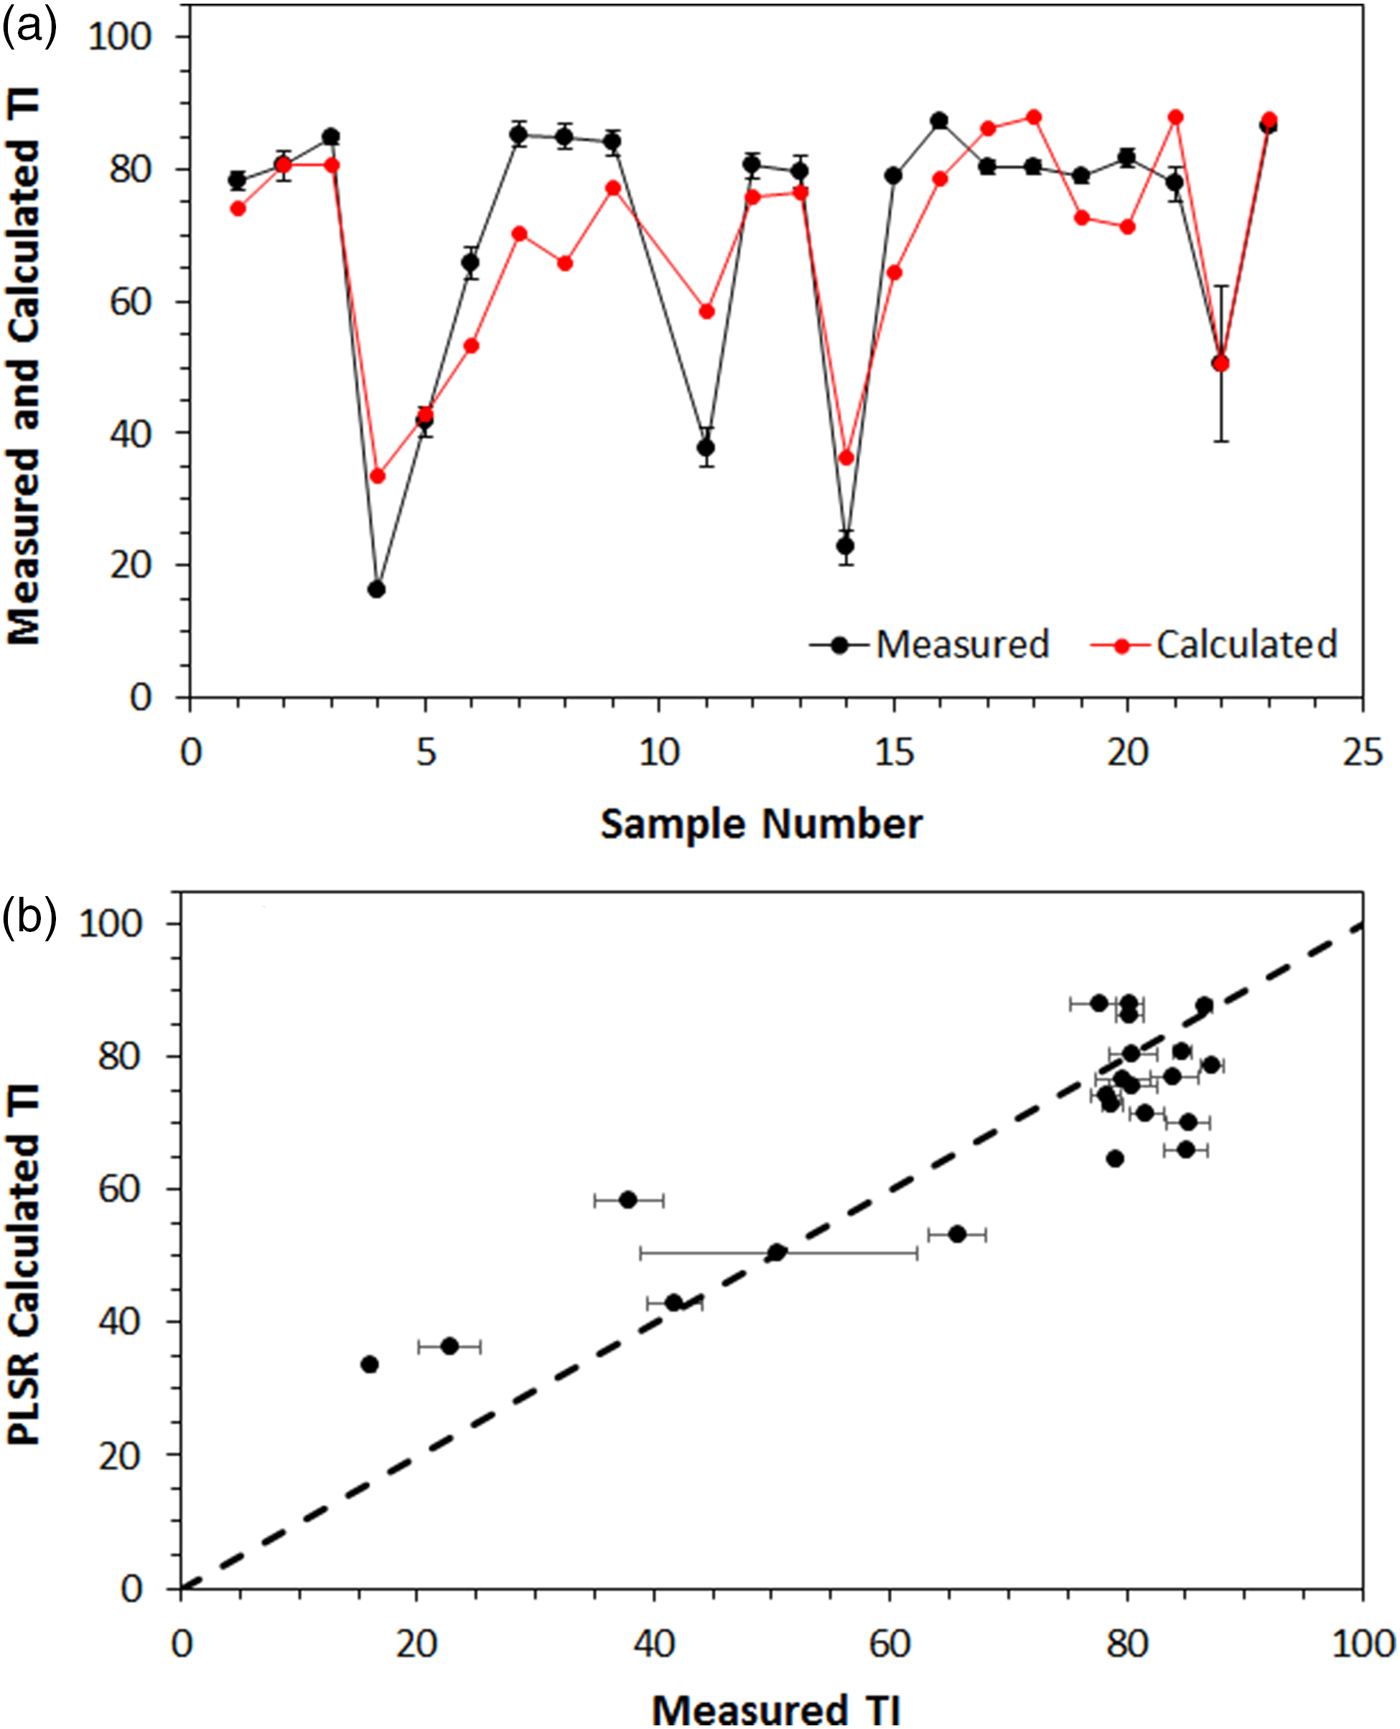
Figure 5. (Color online) Plots of calculated vs. measured tumble index (TI) values for the compact sinter test samples, with the upper 2θ angle in the XRD datasets cropped at 55°. In (b) R 2 = 0.77.
IV. CONCLUSION
PLSR analysis shows promise as a method for rapid determination of TI from XRD data and, therefore, process control of iron ore sintering operations. Here a preliminary assessment of the effect of 2θ range was made and the reduced correlation between calculated and measured TI after cropping of the 2θ range to 5–55° has implications for how rapid the XRD data may be. Further testing is required to assess the robustness of the method as applied to pot-grate iron ore sinter samples, and to establish where improvements in the speed of analysis may actually be made (e.g. in terms of sample preparation, whether or not micronizing is required, or whether coarse grinding using a ring mill is adequate; in terms of data collection, what level of counting statistics is required). Testing is also required to assess the potential for using PLSR to predict sinter reducibility and reduction degradation properties from powder XRD data.
ACKNOWLEDGEMENTS
The authors thank Keith Vining and Anna Littleboy (CSIRO Mineral Resources, Sustainability Research Program) for their support of this work, and Luda Malishev for assistance with sample preparation for XRD analysis.