


INTRODUCTION
Quaternary aeolian deposits (dune sands and thin loess) are found throughout southeast Australia (fig. 4 in Hesse and McTainsh, Reference Hesse and McTainsh2003). Dunes are the most obvious landforms and at present are extensive in the semi-arid zone of the Australian mainland (Bowler and Wasson, Reference Bowler and Wasson1984; Nanson et al., Reference Nanson, Chen and Price1995; Bowler, Reference Bowler1998; Bowler and Price, Reference Bowler and Price1998; Hesse, Reference Hesse2016) and in the subhumid zone of Tasmania (Sigleo and Colhoun, Reference Sigleo and Colhoun1982; Dixon, Reference Dixon1996, Reference Dixon1997). Loess is not as extensive in southeast Australia as in New Zealand but is recognised as a regional deposit in the Central Tablelands of New South Wales (Hesse et al., Reference Hesse, Humphreys, Smith, Campbell and Peterson2003) and along the southern coast, where it is calcareous (Hesse and McTainsh, Reference Hesse and McTainsh2003). Loess has not been mapped in Tasmania, although in the Derwent Valley the term loess was applied to a local deposit of fine sand (Colhoun, Reference Colhoun2002) which is more accurately described as a near-source dunesand derived from the adjacent floodplain of the Derwent River.
In marine sediments, dust accumulations are readily recognisable (Hesse, Reference Hesse1994) and it is from the marine record that episodes of dust loss from the land (and their likely correlatives, dune formations on land) can be best defined. The marine records (Hesse, Reference Hesse1994; Hesse and McTainsh, Reference Hesse and McTainsh1999, Reference Hesse and McTainsh2003) show that during the last 400 ka dust accumulation rates were highest during cool periods, particularly in MIS 6 and MIS 2 (as defined by Lisiecki and Raymo [Reference Lisiecki and Raymo2005]), and generally lower during intervening warmer interglacial and interstadial periods. The broad correlation of aeolian activity and temperature is therefore well-established and appears to support the proposition that glacial conditions were not only colder but also drier and possibly windier (Petit et al., Reference Petit, Briat and Royer1981; Zhou et al., Reference Zhou, Williams and Petersen1994) than at present, limiting vegetation cover in source areas and favouring erosion. However, Hesse and McTainsh (Reference Hesse and McTainsh1999) and Hesse (Reference Hesse2016) cautioned against relating increased dune activity to higher wind speeds and argued that lack of stabilising vegetation was the major factor influencing sand movement. While soil dryness will limit vegetation cover, an additional factor to consider is the effect of lower atmospheric CO2 concentrations favouring grasses over trees during glacial periods (Bragg et al., Reference Bragg, Prentice, Harrison, Eglinton, Foster, Rommerskirchen and Rullkőtter2012). Relating aeolian activity and erosional episodes to climate and vegetation change is also complicated by the possible effects of human arrival in Tasmania at about 40 ka (Allen, Reference Allen1996). The frequency of vegetation burning after Aboriginal arrival is likely to have increased (Fletcher and Thomas, Reference Fletcher and Thomas2010), and the effects of burning may have been exacerbated by the extinction of the herbivorous megafauna at about the same time (Johnson, Reference Johnson2006; Turney et al., Reference Turney, Flannery, Roberts, Reid, Fifield, Higham and Jacobs2008; Gillespie et al., Reference Gillespie, Camens, Worthy, Rawlence, Reid, Bertuch, Levchenko and Cooper2012; McIntosh et al., Reference McIntosh, Eberhard, Slee, Moss, Price, Donaldson, Doyle and Martins2012; Rule et al., Reference Rule, Brook, Haberle, Turney, Kershaw and Johnson2012), which is likely to have increased fuel loads, and consequently, fire intensity.
Tasmania is now separated from mainland Australia by the approximately 250-km-wide Bass Strait, but during much of the last glacial period (MIS 2, 3 and 4), i.e., from about 55 to 10 ka, sea level was lower by more than 55 m, exposing a land bridge between Tasmania and Victoria (Blom, Reference Blom1988; Lambeck and Chappell, Reference Lambeck and Chappell2001). The central Bassian Plain was occupied by a body of water known as Lake Bass during lowest sea levels (–130 m), and Lake Bass Inlet during intermediate sea levels, when it was connected with the ocean to the west. The semi-arid Bassian Plain was a source area for extensive longitudinal dunes, the extremities of which now survive as remnants on land at the Bass Strait margins, notably in northeast Tasmania (Duller and Augustinus, Reference Duller and Augustinus1997, Reference Duller and Augustinus2006; McClenaghan, Reference McClenaghan2006). In coastal regions of western Tasmania (McIntosh et al., Reference McIntosh, Eberhard, Slee, Moss, Price, Donaldson, Doyle and Martins2012), the Bass Strait islands (Eberhard, Reference Eberhard2009), and southern Tasmania (Donaldson, Reference Donaldson2010; Slee et al., Reference Slee, McIntosh, Price and Grove2012; McIntosh et al., Reference McIntosh, Eberhard, Slee, Moss, Price, Donaldson, Doyle and Martins2012), aeolian deposits of last glacial age also occur, together with Holocene dunes, probably partly derived by reworking of older sands.
In inland Tasmania, three types of aeolian deposits have been recorded: (1) near-source dunes taking the form of clayey or sandy lunettes where they have formed downwind (i.e., east) of lagoons and lakes (Bradbury, Reference Bradbury1994; Dixon, Reference Dixon1997) or isolated sandy dunes near floodplains of major rivers (Sigleo and Colhoun, Reference Sigleo and Colhoun1982; McIntosh, Reference McIntosh2012a); (2) more extensive dunefields where source material has been abundant (Doyle, Reference Doyle1993; Dixon, Reference Dixon1997); and (3) silty or sandy sheet deposits (e.g., McIntosh et al., Reference McIntosh, Kiernan and Price2004; Slee et al., Reference Slee, McIntosh, Price and Grove2012), among which one can include minor but significant additions of quartz-rich sand and silt to soils largely formed in parent materials such as doleritic colluvium (Osok and Doyle, Reference Osok and Doyle2004).
This paper collates the evidence for the age and mode of formation of Tasmanian aeolian deposits and includes a brief review of the reliability of thermoluminescence (TL), optically stimulated luminescence (OSL), and thermally-transferred optically stimulated luminescence (TT-OSL) dating, which is published in more detailed form in the Supplementary Material. The implications of aeolian activity for deducing climate variation during the last 100 ka are discussed. The review is organised by geographical regions within which present climate is broadly similar. It includes unpublished TL ages for previously undescribed dunes at Rocky Point, King Island, and new TL ages, particle-size analysis and chemical analyses of layers at the Maynes Junction section previously briefly described by McIntosh et al. (Reference McIntosh, Eberhard, Slee, Moss, Price, Donaldson, Doyle and Martins2012). The Supplementary Material summarises the methods used for TL and other analyses at these two sites.
Sites described and discussed in this paper are shown in Figure 1. The online Tasmanian Geoconservation DatabaseFootnote 1 (TGD) (Comfort and Eberhard, Reference Comfort and Eberhard2011), lists sites of geoscientific interest in Tasmania including deposits of Quaternary age. It includes site locations and scientific information which is publicly available but not formally published, or published only in limited-circulation reports. This database was consulted for 17 sites mentioned or described in this review, and to supplement published information at some sites. Each TGD site is identified by its formal listing code, e.g., TGD site 2249. All radiocarbon ages (except infinite ages) have been calibrated using OxCal version 4.3 (Bronk Ramsey, Reference Bronk Ramsey2009) and IntCal13 (Reimer et al., Reference Reimer, Bard, Bayliss, Beck, Blackwell, Ramsey and Buck2013) and listed both as reported and calibrated ages with 95% confidence ranges (Table 1).

Figure 1. Location of sites discussed in the text. (A) Sites outside the Hobart region and approximate extent of the sub-humid, humid and superhumid zones; (B) sites in the Hobart region. Sites identified by red dots are illustrated with maps or photographs in other figures. Base maps were provided by DPIPWE (Tasmanian Department of Primary Industries, Parks, Water and Environment). (For interpretation of the references to colour in this figure legend, the reader is referred to the web version of this article.)
Table 1. Radiocarbon ages discussed in this paper.

1 SUA, Sydney University Radiocarbon Laboratory (Australia); I, Teledyne Isotopes (USA); Wk, Waikato Radiocarbon Dating Laboratory (New Zealand); OZM, ANTARES AMS Facility, ANSTO (Australia); GaK, Gakushuin University (Japan).
2 Laboratory values as reported (not rounded).
3 Median ages, with the 95% probability range in parentheses. Values are rounded to the nearest 10 yr.
REVIEW OF TL AND OSL AGES
Many of the ages quoted in this paper were determined by TL methods. Included in the Supplementary Material is a review of the TL, OSL and TT-OSL methods used to date Tasmanian aeolian deposits, and their efficacy. Also included, for context, is a concise history of the development of the early TL dating techniques from which the later luminescence techniques evolved. The notes below summarise the main points of this review.
TL ages derived using multiple aliquot techniques require many aliquots of prepared sample to generate a single age. Therefore, TL dating techniques cannot mitigate the adverse effects of poorly bleached grains that may lead to an age being overestimated. Moreover, the TL signal resets (bleaches) much more slowly that the OSL signal. Thus, TL dating is most applicable to well-bleached deposits (dunes distant from sources and sandsheets will normally fit the well-bleached category) and in these instances they have been shown to yield ages consistent with those found using single aliquot regenerative-dose (SAR) OSL techniques in most cases. Systematic comparisons of ages determined by different methods have not been carried out, but TL ages for dunes at Mary Ann Bay (Slee et al., Reference Slee, McIntosh, Price and Grove2012) determined by the protocol of Shepherd and Price (Reference Shepherd and Price1990) were consistent with OSL ages determined by what appears to be a SAR method (Shin, Reference Shin2013) (Supplementary Material), but unfortunately Shin (Reference Shin2013) provided no experimental detail so a thorough assessment cannot be made.
Duller and Augustinus (Reference Duller and Augustinus1997) applied three luminescence dating methods to quartz from the Ainslie dunes. The first two procedures consisted of OSL and TL multiple-aliquot additive-dose total bleach methods applied to the same aliquots. The OSL signal was measured first, followed by the TL signal. A single-aliquot additive-dose OSL procedure was also attempted. The single-aliquot ages were comparable to those found using the multiple-aliquot OSL procedure, and also to three of five TL ages. In light of the SAR protocols developed in the late 1990s (Murray and Wintle, Reference Murray and Wintle2000), Duller and Augustinus (Reference Duller and Augustinus2006) re-dated their samples from the Ainslie dunes using this method. An important difference between the SAR protocol and the ones used by Duller and Augustinus (Reference Duller and Augustinus1997) is the ability of the former to correct for sensitivity change, and its inclusion of internal quality control checks. The ages Duller and Augustinus (Reference Duller and Augustinus2006) determined using SAR dating were significantly different from those found using the older multiple-aliquot total bleach methods (Duller and Augustinus, Reference Duller and Augustinus1997), and are considered to be more accurate. They are consistent with palaeoclimate interpretations for the region. They also cast doubt on the general applicability of the older TL and OSL dating methods.
OSL dating using SAR methods with multi-grain aliquots or single grains has become much more routine in Tasmania (see Supplementary Table S1 in Neudorf et al., Reference Neudorf, Lian, McIntosh, Gingerich and Augustinus2019), and an extension of the method that uses the TT-OSL signal, which has been shown elsewhere to extend the upper age limit of the method, has been applied at Southwood B (Neudorf et al., Reference Neudorf, Lian, McIntosh, Gingerich and Augustinus2019). There, a sequence of TT-OSL SAR ages was found to be consistent with the ages previously determined using the TL dating method of Shepherd and Price (Reference Shepherd and Price1990), but only after the dosimetry used to derive some of the TL ages was recalculated based on new radioisotope measurements (Neudorf et al., Reference Neudorf, Lian, McIntosh, Gingerich and Augustinus2019). Although the apparent consistency between the TL and TT-OSL SAR ages is encouraging (Fig. 2), it should be considered with some caution as the TT-OSL SAR dating technique is still relatively novel. Overall, the evidence summarised above and presented in more detail in the Supplementary Material provides some confidence that the TL ages for the aeolian deposits studied are reasonable, but nevertheless need to be considered with caution. All TL ages quoted in this paper are presented as reported by the University of Wollongong TL laboratory and are identified by their W prefix (e.g., W4237).

Figure 2. (colour online) Optical ages vs. depth for Southwood B (see Table 3 for data). TL ages were determined using the method of Shepherd and Price (Reference Shepherd and Price1990) and have been re-calculated using dose rates measured by Neudorf et al. (Reference Neudorf, Lian, McIntosh, Gingerich and Augustinus2019) using neutron activation analysis. The OSL/TT-OSL ages are the weighted mean of the preferred optical ages highlighted in bold in Table 3.
COASTAL DUNES AND RELICT LONGITUDINAL DUNES
Bassian Plain
Ainslie dunes
Longitudinal dunes form in line with the direction of the prevailing wind, in areas where the sand supply is low and wind direction is variable (fig. 4 in Wasson and Hyde, Reference Wasson and Hyde1983). The best developed longitudinal dunes in Tasmania are the Ainslie dunes in the northeast, which are remnants of more extensive dunes originating from source areas in the former Bassian Plain. Duller and Augustinus (Reference Duller and Augustinus2006) dated samples from these dunes by the OSL SAR method which yielded ages in the range 23.8 ± 1.6 to 16.8 ± 0.9 ka, showing that longitudinal dunes at the southern margin of the Bassian Plain were active around the last glacial maximum (LGM), defined as occurring in the period 23.5–17.5 ka in Tasmania (McIntosh et al., Reference McIntosh, Eberhard, Slee, Moss, Price, Donaldson, Doyle and Martins2012). (Previously-obtained OSL ages were as old as 44 ka [Duller and Augustinus, Reference Duller and Augustinus1997] but were discounted by the later study–see brief review above and the Supplementary Material.) The orientation of the Ainslie dunes is west-northwest to east-southeast (Bowden, Reference Bowden1983; Sharples, Reference Sharples1997), indicating a strong westerly airflow during the LGM and probably a semi-arid or arid climate in the region. The dunes are correctly described as desert dunes. Along the present coast, active dunes are extending in the same east-southeasterly direction.
The maximum thickness of the dunes is not known but most dunes rise 1 to 4 m above the coastal plain. All but one of the 11 samples analyzed by Duller and Augustinus (Reference Duller and Augustinus2006) came from layers less than 2 m deep, so when longitudinal dunes first developed in this area is not known.
South of the Ainslie dunes is an isolated barchan-like dune (Dunlin Dune) in which an exposure (McIntosh et al., Reference McIntosh, Price, Eberhard and Slee2009, figure 4) shows the present-day podzolised profile overlying a buried podzol profile with similar horizonation. Seven TL ages (McIntosh et al., Reference McIntosh, Price, Eberhard and Slee2009) show that the dunesand incorporating the lower podzol had accumulated by 21.0 ± 1.5 ka (the age obtained on the sands forming the buried A1 horizon) and the sands which buried this A1 horizon started to accumulate before 15.9 ± 1.3 ka. The significance of the section is that it indicates that there was a wet podzol-forming period in northeast Tasmania during the LGM, after about 22 ka.
Prime Seal Island
Evidence for late Pleistocene aeolian sand movement on the Bassian Plain is supported by a TL age of 56.4 ± 4.3 ka obtained for weakly lithified cross-bedded sands on the northwest coast of Prime Seal Island in the Furneaux Group, Bass Strait (fig. 2 in Eberhard, Reference Eberhard2009). During low sea levels this island, which at present reaches a maximum altitude of 165 m above sea level (asl), would have been a low hill lying east of Lake Bass or the later Bass Plain Inlet. At the southern end of Prime Seal Island, a thick sandsheet mantles the western flanks of granite hills and on the present coast is truncated by wave action, forming a sand cliff.
There are no sandy beaches on the west coast of the island, so the likely source of the sandy deposits is the now inundated Bassian Plain. This conclusion is supported by a sequence of TL ages from a 25 m deep section of interbedded aeolian and colluvial sediments exposed in an erosion gully on the southwest coast (Eberhard, Reference Eberhard2009). Sands at 21 m depth were dated 37.6 ± 2.3 ka (W4237). Sands at 15 m and 8 m were dated 25.2 ± 2.2 (W4238) and 29.6 ± 2.7 ka (W4239), respectively; within error these ages (mean 27.2 ka BP) are essentially the same. Sands at 1 m depth returned an age of 6.8 ± 0.4 (W4240). The 30–25 ka ages indicate sand deposition at Prime Seal Island at a time approximately coinciding with the period of maximum landscape instability noted on the Tasmanian mainland (McIntosh et al., Reference McIntosh, Kiernan and Price2004, Reference McIntosh, Price, Eberhard and Slee2009, Reference McIntosh, Eberhard, Slee, Moss, Price, Donaldson, Doyle and Martins2012), including the timing of sandsheet deposition at Mary Ann Bay (31–25 ka) and Cradoc Hill (32–25 ka) (see discussion below). An absence of buried soil layers within the Prime Seal Island section indicates potentially continuous sand movement and probably desert-like conditions on the eastern margin of the Bassian Plain during the latter part of MIS 3. Minor blow-outs and local renewed accumulation have also occurred on Prime Seal Island in the mid-Holocene (7–4 ka; Eberhard, Reference Eberhard2009).
Flinders Island and the Furneaux group
Flinders Island, the largest of the Furneaux Group of islands in northeast Tasmania, is extensively mantled by aeolian sands including well-developed dunes orientated east-west, which Kershaw and Sutherland (Reference Kershaw and Sutherland1972) described as parabolic. These dunes extend several kilometres inland. Most of these deposits are now stable and vegetated, and where the sand is calcareous, lithified as calcarenite rock. Sutherland and Kershaw (Reference Sutherland and Kershaw1971) mapped five dune types. One type (Trousers Point aeolianite) is only found locally on the west coast of the island, and may be a variant of one of the other more extensive dune types which were named (1) Palana limestone dunes; (2) inland siliceous dunes (parabolic); (3) unconsolidated parabolic dunes; and (4) beach ridge and frontal dunes. The Palana limestone dunes are in places overlain by the other dune types and are undoubtedly the oldest, and their occurrence as sea stacks indicate that they once extended over the Bassian Plain during low sea levels. Kershaw and Sutherland (Reference Kershaw and Sutherland1972) suggested they were at least as old as the last interglacial (MIS 5) and probably older, given their likely cold-climate origin. The siliceous east-west parabolic dunes (Types 2 and 3) are likely to have formed at the same time as the similarly siliceous longitudinal Ainslie dunes on the Tasmania mainland, i.e., during MIS 2 and possibly earlier. The beach ridge and frontal dunes relate to the recent coastline and formed in the Holocene. However, within all mapped deposits, the predominant formation may contain remnants of earlier deposits. No deposits have been systematically dated.
The origin of undated longitudinal dunes elsewhere in the Furneaux Group islands (Forsyth Island, Tin Kettle Island, and Swan Island), and on the eastern side of Cape Barren Island (TGD sites 3008, 3011, 2310 and 2307) is more problematic. At all four sites the dunes run inland from sandy beaches to their west, so a Holocene origin cannot be ruled out, but the east-west orientation of the dunes matches the orientation of dunes on Flinders Island and one could infer that some of these deposits are also remnants of longitudinal desert dunes. On lungtalanana (Clarke Island), inland longitudinal dunes were interpreted to have a similar age to the Ainslie dunes (Bradbury, Reference Bradbury2014).
Hunter Island
Dune fields on Hunter Island in northwest Tasmania (TGD site 2451) resemble longitudinal dunes in places but are undated. In the TGD record, brown sands are considered to be of Holocene age but strongly bleached (podzolised) sands are assigned a last interglacial age. However, podzolisation can occur in sands as young as 7 ka, notably at Towterer Beach (TGD site 2894, considered below), so the suggested last interglacial origin for podzolised sands on Hunter Island cannot be justified. More plausibly, these are glacial age sediments deposited during MIS 2–4 (Eberhard, Reference Eberhard2017).
King Island
King Island, at the western entry to Bass Strait, has a similar relict aeolian terrain to that of Flinders Island to the east. On King Island, aeolian landforms can be broadly differentiated into lithified calcareous inland dunes, and more recent sandsheets and beach-backing dunes on the coastal fringe. These are interpreted to have formed in the last interglacial period (‘old dunes’) and Holocene (‘new dunes’) respectively, as described by Jennings (Reference Jennings1957, Reference Jennings1959).
New TL ages have been obtained for the beach-backing ‘new dunes’ (Jennings, Reference Jennings1957) at Rocky Point on the north-east coast of King Island (Fig. 3; see Supplementary Material for TL methods and derivation of TL ages). The site is a sandblow within an otherwise vegetated coastal dune complex. The deflated upper portion of the dune is formed in fine, loosely compacted sand with a buried soil horizon at a depth of 0.5 m, below which are further discontinuities, interpreted to be palaeosols, at 1, 5.9, and 6.1 m depths (Fig. 3). On the basis of these discontinuities, five stratigraphic units have been distinguished (Table 2). At the base of the sandblow is a strong brown, weakly lithified sand (Unit 4) covering black loamy sand (Unit 5). The basal loamy sand (Unit 5) was dated 59.9 ± 4.3 ka (W5023) and the overlying non-lithified sand above (Unit 3) returned TL ages of 8.32 ± 1.00 ka (W5021) and 6.75 ± 0.65 ka (W5022) (Table 2). The two younger ages are out of stratigraphic order but their errors overlap. The uppermost sample W5021 exhibited a short temperature plateau suggestive of incomplete re-setting of the TL signal.

Figure 3. (colour online) Dated dunesands within a sandblow at Rocky Point, King Island. The bulk of the dune (Units 1–3) is formed in loosely compacted sand of Holocene age. The base of the sandblow rests on darker, more coherent sand (Unit 4), which mantles older black loamy sand (Unit 5).
Table 2. Stratigraphy and TL ages obtained for coastal dunes at Rocky Point, King Island.

These results indicate that the Rocky Point dune is formed chiefly in Holocene sand, consistent with foredune development by deflation of sand pushed ashore by wave action during the most recent marine transgression. However, the base of the dune is evidently a relict deposit including a buried soil horizon, formed under a glacial climate towards the end of MIS 4. We conclude that it is misleading to assume that the present-day sandy coastal landforms on King Island, and indeed elsewhere on the Tasmanian coast, are solely the product of Holocene processes. We also note that the TL result of 59.9 ± 4.3 ka (W5023) for the deepest Rocky Point deposit bears comparison with a result of 55.6 ± 3.0 ka from dunesands at Sandy Cape, 200 km to the south (McIntosh et al., Reference McIntosh, Eberhard, Slee, Moss, Price, Donaldson, Doyle and Martins2012), and 56.4 ± 4.3 ka from dunesands at Prime Seal Island 300 km to the east (discussed above). These data emphasise the broad extent of aeolian activity during late MIS 4/early MIS 3.
At inland sites on King Island, the lithified calcareous ‘old dunes’ were assumed to be significantly older than the dunes that fringe the coastline (Jennings, Reference Jennings1957, Reference Jennings1959; Murray-Wallace and Goede, Reference Murray-Wallace and Goede1995; Calver, Reference Calver2007), although none of these dunes were dated or described in detail. Jennings (Reference Jennings1957, Reference Jennings1959) speculated that these old dunes were formed during the last interglacial and were subsequently uplifted to their current height of 20 m asl. However, this view was disputed by Murray-Wallace and Goede (Reference Murray-Wallace and Goede1995) who suggested, on the basis of ESR and amino-acid racemisation ages of shells in inland lagoons, that the dunes were substantially older than MIS 5e. An interglacial origin for the calcareous inland dunes is considered unlikely because source material in the form of calcareous marine sediments is likely to have been in short supply during high sea levels, but plentiful during low sea levels when the Bassian Plain was exposed.
Jennings (Reference Jennings1957), in his survey of the landscape in the vicinity of the now drained South East Lagoon in the Yellow Rock River catchment, recognised an ancient shoreline and inland lithified ‘old’ dunes at the catchment's eastern margin, 11 km east of the present west coast of the island. Later field observations by the authors of this article combined with air-photograph interpretation, has allowed the dunes to be mapped in more detail (Fig. 4). The dunes are composed of a thin 1 m-thick veneer of white loose sand overlying yellow/brown strongly lithified sand. Surface layers contain small angular bedrock fragments, likely to be Aboriginal artefacts produced by hunting parties that camped on the dunes adjacent not only to the original marine inlet to the west but also adjacent to lakes and swamps to the immediate east, dammed by barchan and longitudinal dunes (Fig. 4).

Figure 4. In the centre of the image the Yellow Rock River basin is outlined by the 20 m contour and low cliffs (blue line). Red-brown lines indicate the extent of the Holocene-age coastal dunes. The yellow lines at the eastern side of the basin mark three arcuate beach-backing dunes. White areas with reed symbols east of the arcuate dunes indicate lakes and swamps. Intervening thin yellow lines indicate dunes trapping the lakes and swamps. On the right of the image the 20 m contour shown in blue shows the likely extent of an earlier marine incursion from the east, which may have extended into the Yellow Rock River basin prior to dune development, dividing the island in two. (For interpretation of the references to colour in this figure legend, the reader is referred to the web version of this article.)
Observations suggest that the arcuate dune ridges on the eastern margin of the Yellow Rock River basin formed behind a beach, on the flanks of older dunes and lagoons to the east. The dune ridges probably formed in an interglacial period pre-dating the last interglacial (Murray-Wallace and Goede, Reference Murray-Wallace and Goede1995) when the Yellow Rock River basin was a large tidal estuary connected to Bass Strait. The basin is bounded at the 20 m asl contour by low benches and dunes, which are interpreted to mark the margin of a large marine bay that once filled the basin. The inferred marine bench at 20 m asl fits well with the estimated uplift rates for King Island and north-western Tasmania since the mid-Quaternary (MIS 9) (Mazengarb and Stevenson, Reference Mazengarb and Stevenson2016), indicating that the Yellow Rock River basin was a bay during MIS 9. The 20 m contour also corresponds with the base of raised coastal sea cliffs located south of Naracoopa in southeastern King Island (Jennings, Reference Jennings1959; TGD site 2619) and with the base of the old sea cliff in the Corinna-Pieman area of the northwest Tasmanian mainland (Twidale, Reference Twidale1957). We infer that as the land rose the estuary slowly drained to form South East Lagoon, the last remnant of which was destroyed by agricultural activities in the late 20th century. Further evidence for a marine origin for this embayment is the offshore bar mapped by Jennings (Reference Jennings1957) immediately west of South East Lagoon, no longer evident in recent imagery. In all likelihood this landform has been significantly disturbed by the same agricultural practices that drained the lagoon. The Yellow Rock River basin has been further isolated from the sea by dune ridges of probable last glacial and Holocene-age at the mouth of the basin (Fig. 4).
It is notable that the 20 m contour on the eastern side of King Island almost meets the 20 m contour on the western side (Fig. 4), indicating that King Island may originally have been two islands; the dunes east of the Yellow Rock River basin may originally have formed part of a spit which eventually closed the shallow marine channel separating the islands.
Tasmanian West Coast
On the west coast of Tasmania near Sandy Cape, dunes have been TL dated in the range 56–21 ka (McIntosh et al., Reference McIntosh, Eberhard, Slee, Moss, Price, Donaldson, Doyle and Martins2012) as well as to the Holocene (13–9 ka). The older dunes have lost their original morphology as they have been partly eroded and overwhelmed by later sand movement. It is likely that the older deposits at Sandy Cape, like the Ainslie dunes and those on Prime Seal Island, are the remains of a longitudinal linear dune field that once extended across the continental shelf, which was much wider during the last glacial period (Lambeck and Chappell, Reference Lambeck and Chappell2001); the dunes’ ultimate origin may have been the coast several kilometres to the west. In contrast, beach-backing dunes to the south at Ocean Beach near Strahan are of Late Holocene age (Sharples et al., Reference Sharples, Walford, Watson, Ellison, Hua, Bowden and Bowman2020).
Although it has been suggested (Sharples, Reference Sharples1996, p. 63) that the active Henty dunes north of Strahan (Fig. 5), which reach thicknesses of 145 m, may have both Holocene and Pleistocene components, the dunes do not have the longitudinal morphology characteristic of desert dunes and evidence of a last glacial age is lacking. It is likely that the active Henty dunes (outlined in red in Figure 5) are entirely of Holocene age, supplied by sand from the extensive sandy beaches north of Strahan. However, within the area of active dunes, dunes with more complex morphology are evident (Fig. 5) and these are likely to be remnants of older dunes.

Figure 5. The Henty east-west transverse dunes (TGD site 3234) illustrated in the centre of this figure have been TL dated 10.1 ± 1.2 ka (McIntosh, Reference McIntosh2012b) at the location shown by the yellow triangle. The orientation of the dunes indicates accumulation from a northerly direction (pink arrows). In contrast dunes which are active at present (the Henty Dunes, shown in red and light blue outline) are sourced from the west-northwest (dark blue arrows). (For interpretation of the references to colour in this figure legend, the reader is referred to the web version of this article.)
Inland from the active Henty dunes are stable vegetated dunes. A prominent set of dunes having slip faces orientated approximately east-west (Fig. 5; TGD site 3234; McIntosh Reference McIntosh2012b) are interpreted to be transverse dunes resulting from the effect of unimodal winds on a plentiful sand supply (Reffet et al., Reference Reffet, Courrech du Pont, Hersen and Douady2010). Their morphology indicates a source from the Henty River floodplain (to the north) rather than the coast (to the west). Formation by northerly or north-northwesterly winds rather than westerlies (that prevail at present) is inferred. A TL age of 10.1 ± 1.2 ka was obtained from a sample taken at 1.5 m depth on the fourth crest counting from the south (McIntosh, Reference McIntosh2012b; Fig. 4), probably indicating increased supply of sediment to the Henty River floodplain at around this time, enhanced by the rapid melting of glaciers in the West Coast Range, which was complete by 9.050 ± 0.120 14C ka BP (10.52–9.78 cal ka BP) (Colhoun, Reference Colhoun1985; Table 1).
Four periods of dune formation can be deduced from the aeolian landforms (Fig. 5): the modern Henty Dunes which are presently active and periodically advancing; historic dunes which buried the railway after 1960; the transverse dunes with east-west orientation of early Holocene age; and older dunes of unknown age, with complex morphology that has probably been highly influenced by a combination of local induration and deflation.
Southwest Tasmania
Longitudinal dunes in southwest Tasmania are well developed at Towterer Beach (TGD site 2894; Baynes, Reference Baynes1990; Fig. 6) where TL ages of 7.1 ± 2.3 and 5.2 ± 1.7 ka (W2093 and W2095) were obtained from podzolised sediments. These ages, the dunes’ local extent, and the local beach sand supply, together indicate that the dunes formed at the end of the mid-Holocene sea level high-stand around 7.5 ka (Lewis et al., Reference Lewis, Sloss, Murray-Wallace, Woodroffe and Smithers2013) and that they are not remnants of a glacial-age dunefield. Likewise, most beach-backing dunes and sandsheets extending inland from most major beaches on the southwest coast appear to be of Holocene age. However, some of these features may incorporate relict sands which pre-date the most recent marine transgression (Eberhard et al., Reference Eberhard, Sharples, Bowden and Comfort2015).

Figure 6. The Holocene TL ages obtained for vegetated dunesands (indicated by yellow lines) inland from Towterer Beach, southwest Tasmania, indicate that these sands are not remnants of longitudinal dunes developed when the sea level was low. (For interpretation of the references to colour in this figure legend, the reader is referred to the web version of this article.)
Dunes on the Prion Beach sandspit and on the coast east of the adjacent New River Lagoon have been described and OSL dated by Cullen and Dell (Reference Cullen and Dell2013), who identified at least three stages of Mid- to Late Holocene dune development on the Prion Beach spit, spanning ages between 2.2 ± 0.5 to 6.2 ± 2.8 ka. Older OSL ages of 116.8 ± 34.8 and 126.2 ± 33.8 ka in sands in forested terrain east of New River Lagoon were interpreted by Cullen and Dell (Reference Cullen and Dell2013) to date remains of dunes associated with a last interglacial spit. However, these older ages have large errors which do not allow confident assignment to climate stages. One dune on Prion Beach (PB12), which is situated on the northeast side of New River Lagoon (i.e., isolated from the dunes forming the Holocene spit), was OSL dated 24.8 ± 7.0 ka (fig. 2 in Cullen and Dell, Reference Cullen and Dell2013) showing that some sands were accumulating during the last glacial period. These can be classified as near-source dunes, derived either by deflation by westerly winds of alluvial sands from the now flooded New River floodplain, or by reworking of older dunes.
Inland sandsheets, lunettes and isolated dunes
Midlands sandsheets
A complex distribution of aeolian sandsheets occurs in the Macquarie River catchment in the Tasmanian Midlands between Ross and Cressy (Dixon, Reference Dixon1997; TGD site 2249), where sand has been deflated from floodplains of the Macquarie River and its tributaries such as the Isis River onto the windward slopes of hills in several areas (e.g., onto Mt. Augusta) (Matthews, Reference Matthews1975, Reference Matthews1983; Pinkard, Reference Pinkard1980). Similar sandsheets also occur in the Fingal Valley, and around Longford where they are mapped as Panshangar soils (Doyle, Reference Doyle1993), and as far south as Kempton (McIntosh, Reference McIntosh2015a). Individual sandsheets cover less than a hectare to more than 10 km2. Minor sand movement continues to the present in the form of sporadic blowouts and areas of recently remobilised sand. However, the overall stability of the sands and river floodplains at present suggests that the sandsheets are cold-climate deposits and formed when sand supply was greater and/or vegetation cover was limited by aridity. None of the sandsheets have been dated.
Lunettes
Lunettes downwind (east of) seasonal lakes are common in the Midlands of Tasmania. Several lagoons and associated lunettes have been listed in the TGD: Lake Tiberias, Conara Lagoon, Nelson Lagoon, Grimes Lagoon, Township Lagoon and White Lagoon (TGD sites 2632, 2248, 2270, 2627, 2629 and 2634, respectively) and a group of small features (Ellinthorp Plains Lunette Systems; TGD site 2630; Fig. 7). Lunettes are also found in the dry lowlands of southeast Tasmania, at Pipe Clay Lagoon (now flooded by the sea) and the adjacent Rushy Lagoon (Colhoun, Reference Colhoun1977); and in northeast Tasmania at Rushy Lagoon and the adjacent Mygunyah Lagoon (Cosgrove, Reference Cosgrove1985). However, many lagoons and associated lunettes remain unlisted.
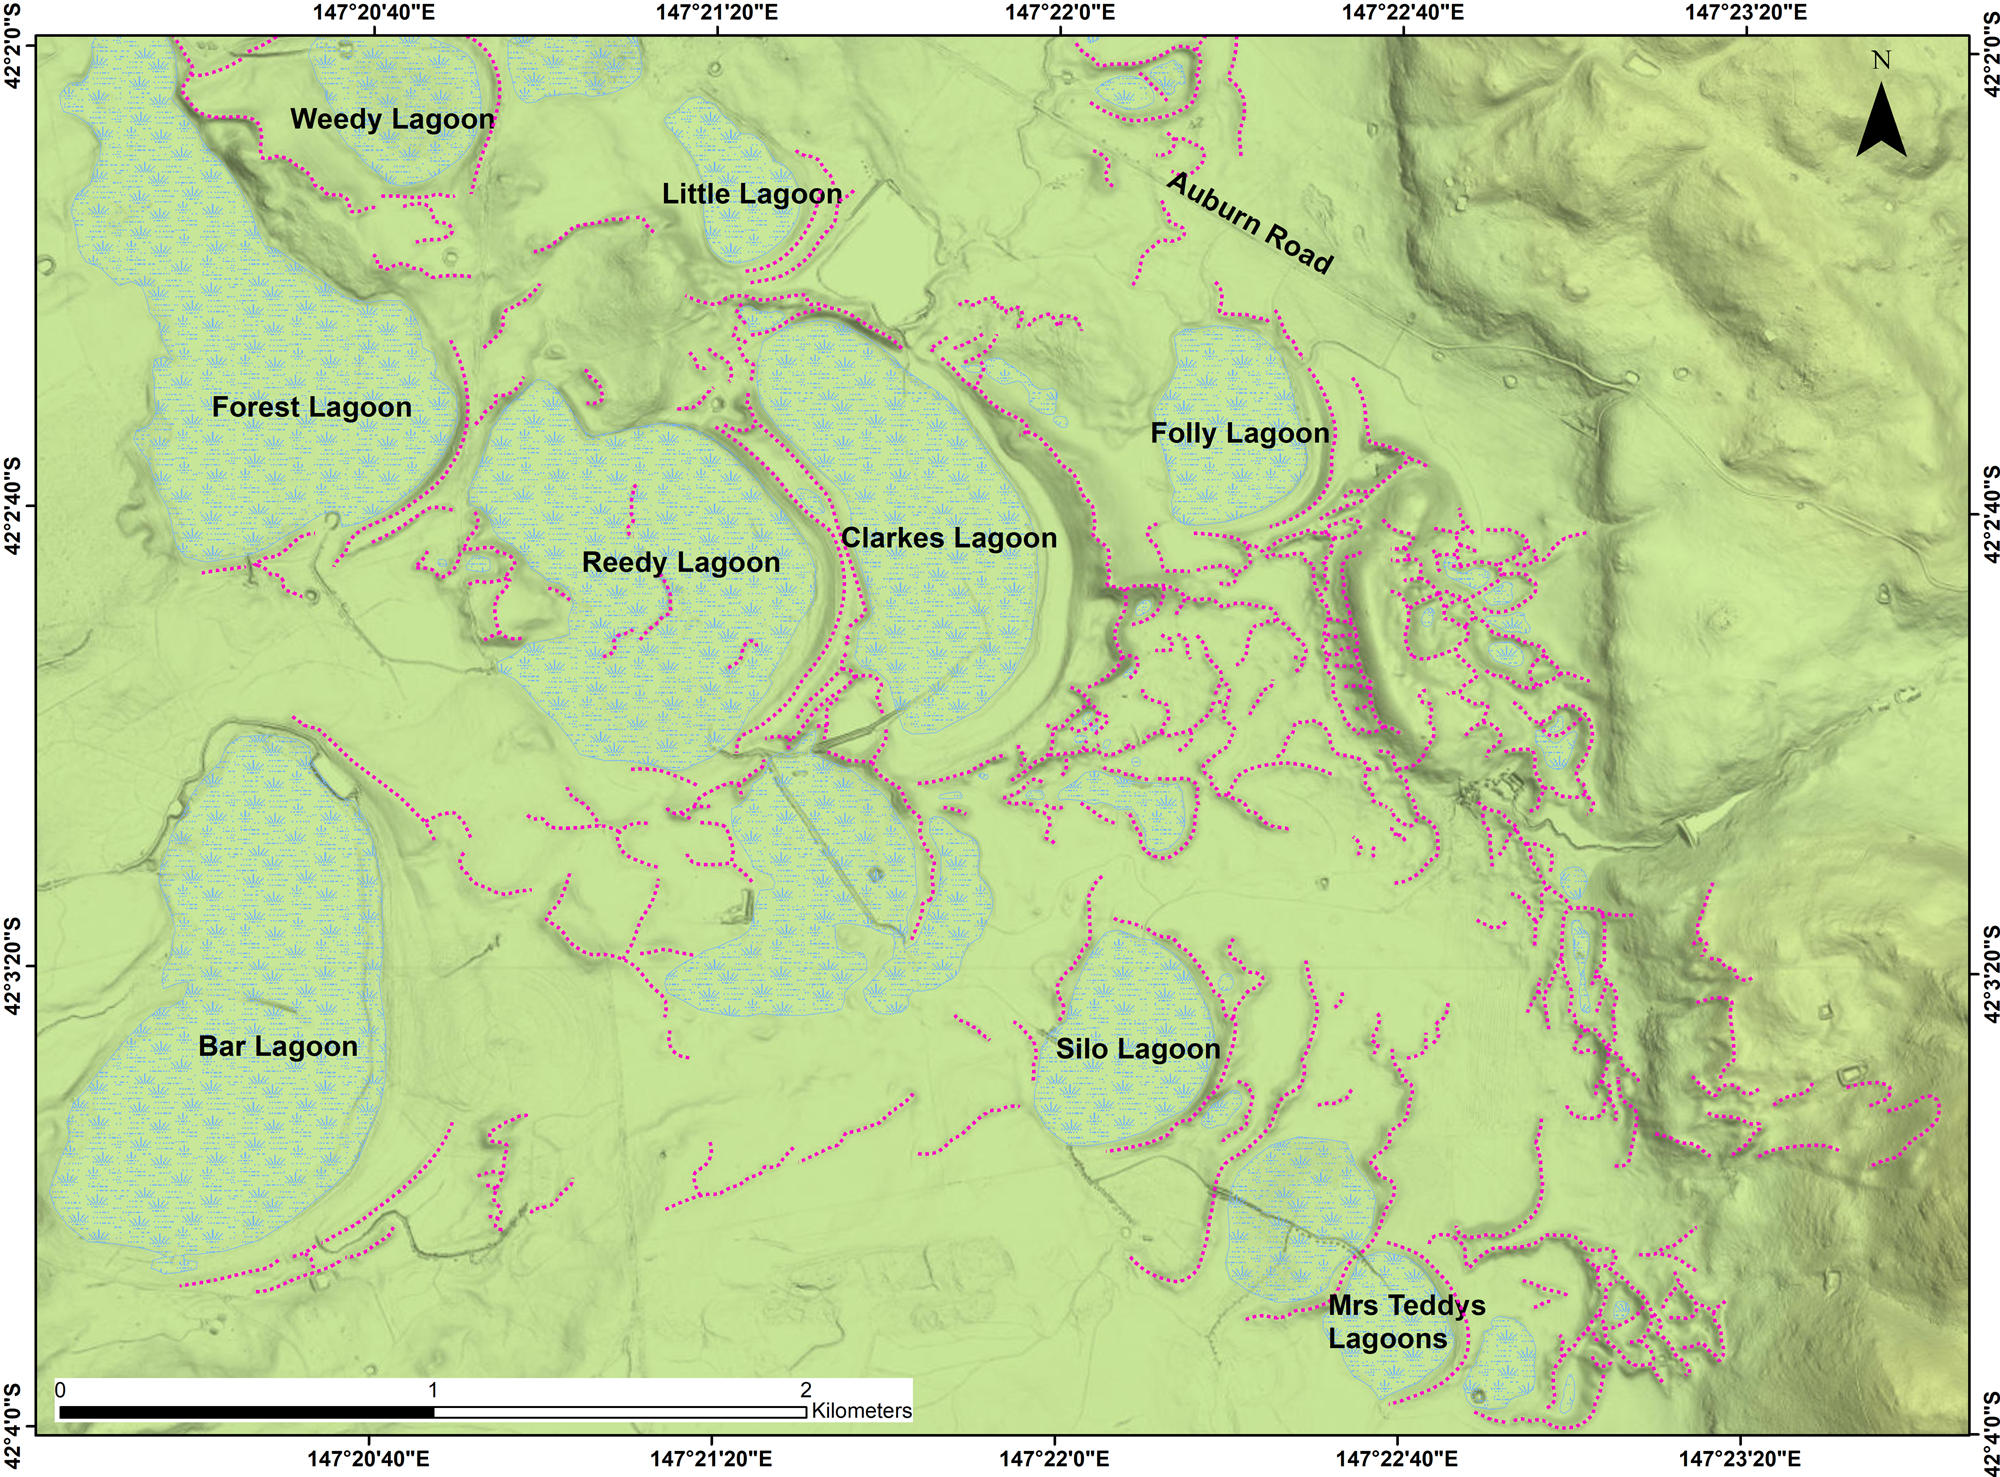
Figure 7. The Ellinthorp Plains Lunette Systems (TGD site 2630) in the Tasmanian Midlands. Pink dotted lines follow dune crests. (For interpretation of the references to colour in this figure legend, the reader is referred to the web version of this article.)
The Ellinthorp lunettes (Fig. 7) clearly formed during westerly winds. In the present subhumid climate they are vegetated and stable. The concentration of lagoons and lunettes at this location may result from their position at the foot of the uplands (Great Western Tiers) which reach altitudes of >1100 m asl to the west, where seasonal snowmelt is likely to have enhanced sediment supply to the previously semi-arid lowlands.
The lagoon and associated lunette at Lake Tiberias (Macphail and Jackson, Reference Macphail and Jackson1978; Dixon, Reference Dixon1997) covers about 10 km2 of a 21 km2 catchment and is the largest lagoon and associated lunette in Tasmania. The nearest weather station at Oatlands has a mean annual rainfall of 547 mm (Bureau of Meteorology [BOM], 2020, record for station 93014). The lunette is about 4 km long. Lake Tiberias is the only lagoon in the Tasmanian Midlands to have been investigated palynologically: Macphail and Jackson (Reference Macphail and Jackson1978) cored the lake sediments and obtained “215 cm of well humified sedge peats overlying an unknown depth of lacustrine clays.”
The clays were sampled to 283 cm depth. Clays below 251 cm depth contained very little pollen. Layers at 251–210 cm depth were dominated by Eucalyptus and Phyllocladus pollen deduced to be derived from forests on higher humid uplands to the west (the Great Western Tiers). Eucalyptus and Pomaderris pollen from the same presumed source dominated in layers from 210 cm to the surface. Although Macphail and Jackson (Reference Macphail and Jackson1978, figure 3) attributed the presence of significant amounts of chenopod pollen between 251–210 cm depth to long-distance transport, possibly from the mainland, the fact that the chenopod pollen percentage declined to very low values above 210 cm, despite chenopod communities still being present on the mainland, and that lunette morphology indicates a prevailing wind from the west-northwest rather than from the north, suggests that the alternative interpretation considered by Macphail and Jackson (Reference Macphail and Jackson1978, p. 293) that the pollen record reflects a chenopod “cold steppe community in the Midlands, analogous to the Gramineae-Chenopod associations of (hot) semi-arid to arid regions of mainland Australia” is more likely to be correct.
Above 135 cm depth, grasslands and sedges dominated the local pollen assemblage. Myriophyllum pollen at 251–135 cm depth indicated at least seasonally wet conditions. A 14C age of 9.550 ± 0.200 14C ka BP (10.26–11.35 cal ka BP) (Table 1) was obtained on the base of the peat in a second core. As peats can be contaminated by percolating humic acids (as probably occurred in peats at Pipe Clay Lagoon in southeast Tasmania [Colhoun, Reference Colhoun1977]) this age is probably a minimum for the beginning of peat accumulation at this site.
In summary, it can be deduced that the clays below 251 cm, containing very little pollen, were probably deposited quickly, perhaps by floods following rapid snow melt in the uplands to the west during the last glacial period. If the chenopod pollen is indeed derived from local sources, it can be deduced that a more stable landscape dominated by chenopods and low shrubs followed, as reflected in the Myriophyllum/chenopod pollen record, indicating the presence of a seasonal shallow lake surrounded by a semi-arid or arid herb/shrubland. Onset of Holocene subhumid conditions (recorded in peat above 210 cm depth) led to expansion of eucalypts and grasslands in the surrounding land. Throughout the record Eucalyptus pollen (and for a time, Phyllocladus pollen) rained onto the lake from distant western (and wetter) upland sources.
Most lunettes are developed in quartzo-felspathic aeolian sediments, and, like their mainland counterparts, are clayey if derived from the dry lake bed or sandy if derived from beaches formed during high lake levels (Bowler and Wasson, Reference Bowler and Wasson1984). Exceptions are lunettes derived from clayey weathered doleritic sediments in the subalpine environment of the Central Plateau, notably those at lakes Ada and Augusta at 1100 m asl (TGD sites 2703 and 3144; Bradbury, Reference Bradbury1994).
Lunette sediments provide unique opportunities for deducing climate variation, as their sediment types and rates of accumulation are sensitive to water levels in their associated lakes. Unfortunately, no lunette sediments in Tasmania have been systematically dated, although Lourandos (Reference Lourandos1970), quoted by Sigleo and Colhoun (Reference Sigleo and Colhoun1982), obtained Holocene ages for Aboriginal hearths in the upper part of the sandy lunette at Crown Lagoon, 22 km east of Oatlands. On the basis of wood dated 8.570 ± 0.135 14C ka BP (9.27–10.13 cal ka BP) (Table 1) Cosgrove (Reference Cosgrove1985) deduced that the most recent accumulation of sand on the lunette at Rushy Lagoon occurred in the early Holocene.
At White Lagoon, Sigleo and Colhoun (Reference Sigleo and Colhoun1982) described a basal sandy clay unit overlain by about 30 cm of sand in turn overlain by a younger clay unit. The sequence implies two periods of relative dryness (represented by the clays eroded from the dry lake bed) separated by a period in which White Lagoon was full and sand dunes, derived from remobilised beach sand, accumulated. Sigleo and Colhoun speculated, on the basis of ‘rubification’ of the palaeosol developed in the lower clayey unit, that it accumulated during the last interglacial period, but the layer may well be younger. Dating of the White Lagoon lunette section and palynological examination of the lagoon sediments would provide useful information for elucidating the climate history of the Tasmanian Midlands.
Sandsheets and dunes of southern Tasmania
Lower Derwent estuary
East of the lower Derwent estuary, and notably on South Arm Peninsula and Seven Mile Spit around Frederick Henry Bay, extensive sandsheets and dunes are present.
At Llanherne on Seven Mile Spit, Donaldson (Reference Donaldson2010), reported by McIntosh et al. (Reference McIntosh, Eberhard, Slee, Moss, Price, Donaldson, Doyle and Martins2012, site 23), obtained TL ages of 53.8 ± 3.5 and 26.1 ± 3.5 ka for cross-bedded sands. The older sands accumulated during MIS 3 when sea levels were oscillating at about 50 m below their present level and the younger sands accumulated during MIS 2 when sea levels were ca. 100 m below their present level. The dunes at Llanherne accumulated near the northern limit of a thick sandsheet that draped the wide southern extent of the Coal River valley and probably extended southwards over the area east of the Derwent River that is now partly submerged under Frederick Henry Bay. At Llanherne the sands overlie sandy clays that may have formed in the last interglacial.
The most likely source of these extensive sandsheets and dunesands is the (now flooded) Derwent River floodplain, about 20 km southwest of Llanherne. Deflation and deposition during southerly or southwesterly winds is likely. As no palaeosol is present between the sands dated 53.8 and 26.1 ka at Llanherne, the sands may have accumulated steadily as the Derwent River fan prograded southwards following the fall of sea level to its minimum of about –130 m. The ultimate source of the extensive aeolian deposits of the lower Derwent estuary and east of it is likely to be glacial outwash from the Lake St. Clair region of the upper Derwent River catchment. During the last glacial period the lower reaches of the Derwent River were probably braided and would have carried large volumes of gravel, silt and sand during spring flows. Some sediment was also undoubtedly sourced locally from the lower Derwent valley where massive erosion has periodically occurred in the steep side valleys cut into Permo-Triassic sedimentary rocks, producing alluvial fans many metres thick (Wasson, Reference Wasson1977; Fig. 8).

Figure 8. (colour online) The alluvial fan at Granton, approximately 7 m high, contains a sandy lens (centre of photograph) that may be aeolian in origin. The TL age obtained on the sands (≥134 ± 21 ka) (McIntosh, Reference McIntosh2018) may be older than the actual age of deposition. The TL age supports the interpretation, first proposed by Wasson (Reference Wasson1977) for similar exposures, that the lower 3.5 m of the deposit that has a brown matrix accumulated during the penultimate glacial period and weathered during the last interglacial period (MIS 5e) and the upper 3.5 m of the deposit that has a grey (less weathered) matrix accumulated during the last glacial cycle (MIS 5d–MIS 2).
We surmise that when sea levels rose in the Holocene, many lagoons and lunettes near the coast and their associated uncemented and incompetent sandsheets were eroded, forming the relatively shallow inlets of Frederick Henry Bay and Ralphs Bay. As a result, only the higher remnants of the last glacial aeolian landscape are now preserved, mostly where the sandsheets are underlain by erosion–resistant hard rock formations. Such sandsheet remnants are preserved on the South Arm Peninsula, which has a sand cover which survived rising sea levels because of its underlying dolerite and Permo-Triassic sedimentary rocks. At Pipe Clay Lagoon, Colhoun (Reference Colhoun1977) identified last interglacial marine sands at 3–4 m above present sea level and overlying these were freshwater organic-rich sands radiocarbon dated 25.380 ± 0.640 14C ka BP (28.33–30.90 cal ka BP) to 21.905 ± 0.440 14C ka BP (25.42–27.24 cal ka BP) (Table 1). These sands were in turn overlain by aeolian sands of presumed LGM age. Aeolian activity may have begun earlier than 25 ka, as contamination of the dated organic layers with humic acids was recognised to be a problem.
Nearby, at Mary Ann Bay, 7.5 m of calcareous aeolian sands up to 24 m asl overlie a thin sequence of sands and palaeosols, which in turn overlie weathered dolerite (Slee et al., Reference Slee, McIntosh, Price and Grove2012; Shin, Reference Shin2013). The sands were assigned a last interglacial age and marine origin on the basis of electron spin resonance dating of shells in their upper layers (Murray-Wallace and Goede, Reference Murray-Wallace and Goede1991; Murray-Wallace and Woodroffe, Reference Murray-Wallace and Woodroffe2014, p. 218). (McIntosh et al. [Reference McIntosh, Eberhard, Slee, Moss, Price, Donaldson, Doyle and Martins2012] updated the species list provided by Colhoun et al. [Reference Colhoun, Turner and van der Geer1982], who noted shells of 48 species, ranging from large weathered and damaged Pecten and Ostrea shells to the micro-gastropod Microdiscula.) However, two TL and two OSL ages obtained by Slee et al. (Reference Slee, McIntosh, Price and Grove2012) and Shin (Reference Shin2013), respectively, overlooked by Murray-Wallace and Woodroffe (Reference Murray-Wallace and Woodroffe2014), demonstrate that the sands were deposited around 31–25 ka when sea levels were about 90–100 m below present sea level (Lambeck and Chappell, Reference Lambeck and Chappell2001; Compton, Reference Compton2011) and falling rapidly. This age range for the sands rules out a marine origin, and together with the stratigraphic evidence discussed by McIntosh et al. (Reference McIntosh, Price, Grove and Slee2013) and McIntosh (Reference McIntosh2015b), supports an aeolian origin for the deposits. Particularly relevant is the observation that the sands at Mary Ann Bay are up to 24 m asl, but at Pipe Clay Lagoon, 1 km east of the bay, Colhoun (Reference Colhoun1977) found last interglacial sands near present-day sea level, and between these two sites (and in the greater Hobart region) there is no evidence of the late Pleistocene tectonic uplift postulated by Murray-Wallace and Woodroffe (Reference Murray-Wallace and Woodroffe2014, p. 218) to explain the present elevation of the shelly layer.
The 31–25 ka age for the sandy matrix is not incompatible with the last interglacial age obtained for the shells. The intact shells in the upper part of the aeolian deposit imply that a nearby relict shell bank was eroded during the late last glacial period (after 31–25 ka) and shells were blown up dune stoss slopes to higher altitude by strong westerlies. This interpretation supports the arguments of Petit et al. (Reference Petit, Briat and Royer1981) and Zhou et al. (Reference Zhou, Williams and Petersen1994) that the climate was windier during the LGM than in the preceding period. It is noteworthy that wind gusts of 100 km/h or more have been recorded in every month of the year at Hobart airport (19 km north of Mary Ann Bay; Figure 1) and a maximum wind speed of 130 km/h was recorded in October, 1988 (BOM, 2020; record for station 94008). Experiments on the wind speeds required to move the largest Mary Ann Bay shells could establish the maximum wind speeds in the late last glacial period for this exposed site.
Upper Derwent estuary (New Norfolk to Hobart)
Wasson (Reference Wasson1977) was unable to date the fan deposits he described in the upper Derwent estuary. However, since Wasson's study three TL ages for sediments overlain or enclosed by fan gravels have been obtained. At Granton, a sandy lens, possibly of aeolian origin, in a shallow erosion channel within the fan deposits, was TL dated ≥134 ± 21 ka (McIntosh, Reference McIntosh2018; Fig. 8). The sample did not display a lengthy TL temperature plateau (D. Price, written communication, 21 May 2014), so the TL signal may not have been completely reset before the lens accumulated. Consequently, this age may not represent a true depositional age, which may be younger. Single-grain OSL dating could resolve the age uncertainty.
The gravels below the sandy lens have a brown sandy clay matrix whereas those above have a grey matrix (Fig. 8). The age obtained and the colour difference suggest that the sandy lens marks the boundary between fan gravels that weathered during the last interglacial period but accumulated in the penultimate glacial period (MIS 6), whereas the overlying less-weathered fan gravels accumulated in the last glacial cycle (MIS 5d–2). The sandy lens may have resulted from aeolian activity during the MIS 5e/5d transition as the climate rapidly became colder and drier. The Derwent River has undoubtedly been a source of aeolian deposits at Granton: within 1 km of the Granton fan Colhoun (Reference Colhoun2002, figure 12) recorded a section of aeolian fine sand (since destroyed) which he described as loess.
At New Norfolk, sands preserved under fan gravels were TL dated >87.5 ± 7.4 and 74.1 ± 9.1 ka (McIntosh et al., Reference McIntosh, Eberhard, Slee, Moss, Price, Donaldson, Doyle and Martins2012, fig. 10). The sands are deduced to be part of a dune derived from the Derwent River floodplain which at present is 60 m west of the outcrop.
At Blackstone Point on the east side of the Derwent estuary near Hobart, Sigleo and Colhoun (Reference Sigleo and Colhoun1982) described a 2 m-thick sandsheet covering about 20 ha. It consisted of four sandy layers overlying estuarine sands, silts and gravels assumed to be of last interglacial age. The lower two sand units (Units 1 and 2) contained Aboriginal artefacts, hearths, and transported remains of edible mussels so are likely to be younger than 40 ka. Radiocarbon ages of around 6.5 cal ka BP (Table 1) were obtained for charcoal and mussels in the second oldest layer (Unit 2) and these ages, and the position of the Aboriginal site near the present coastline, suggest that all the sands here are Mid- to Late Holocene.
At Bridgewater, Sigleo and Colhoun (Reference Sigleo and Colhoun1982) described a 2 m-thick sandsheet of similar dimensions to that at Blackstone Point, overlying alluvial gravels and dolerite. It lies immediately east (i.e., downwind) of a broad east-west reach of the Derwent River. Charcoal in an Aboriginal midden at 60 cm depth was dated 4.540 ± 0.105 14C ka BP (4.87–5.47 cal ka BP) (Table 1), but the sands below the midden (which do not contain Aboriginal artefacts) may date to the last glacial period, as the now-drowned floodplain of the Derwent River, which is very wide (1.5 km) for 2.5 km upstream (west) of the deposit, is the obvious source area.
Jordan River Dune
East of the Jordan River at Glenfield is a low dune up to 2.5 m thick in which Sigleo and Colhoun (Reference Sigleo and Colhoun1982) identified four aeolian units with three palaeosols. Aboriginal hearths and artefacts were found in Unit 2 (second from the top) and the oldest radiocarbon age obtained was 2.055 ± 0.120 14C ka BP (1.78–2.33 cal ka BP).
Much older OSL ages (37.5–26.6 ka) were obtained by Paton (Reference Paton2010) for a deposit containing Aboriginal artefacts adjacent to and south of the Jordan River at Brighton, 2 km north of Glenfield. This deposit was described as a levee by Paton (Reference Paton2010) but inspection by the corresponding author of this paper revealed loose fine sands indistinguishable from near-source inland dunes found nearby (e.g., those described by Sigleo and Colhoun, Reference Sigleo and Colhoun1982) or found in the Midlands, and therefore a dune interpretation (McIntosh et al., Reference McIntosh, Eberhard, Slee, Moss, Price, Donaldson, Doyle and Martins2012) is preferred. The OSL ages obtained by Paton (Reference Paton2010) were disputed by Olley (Reference Olley2010) and the dating issue needs to be resolved by resampling and single-grain OSL analysis. If the dunesand with artefacts is confirmed as being close to 40,000 years old it is the oldest non-habitation Aboriginal site in Tasmania and approximately equal in age to the oldest habitation site known at Wareen Cave (Allen, Reference Allen1996). As the 37.5 ka age was obtained close to the base of the dune it is possible that the dune started to accumulate following catchment erosion and increased bedload in the Jordan River resulting from vegetation fires lit by the Aboriginal population.
Near-source dunes and aeolian deposits of the southern forests
In the Arve and Huon valleys east of Geeveston in southern Tasmania, annual rainfall increases from about 1350 mm in the Arve valley to over 1600 mm further west at Warra on the Huon River. At present these areas support dense eucalypt forests with some trees up to 100 m high. Rainforest occurs in areas relatively protected from wildfires. Dunes in both these areas attest to a much drier climate in the past.
Southwood A dune
At the Southwood A site in the Arve valley an isolated dune occurs on a ridge at 190 m altitude and was TL dated 18.7 ± 1.2 ka and 19.1 ± 1.3 ka (McIntosh et al., Reference McIntosh, Price, Eberhard and Slee2008, Reference McIntosh, Eberhard, Slee, Moss, Price, Donaldson, Doyle and Martins2012; Fig. 9), indicating unobstructed movement of sand from a source in the west (the Arve River floodplain) in an open or sparsely vegetated environment during the LGM, possibly during the same brief period of high winds that was responsible for the accumulation of intact shells in the upper (undated) sandy deposits at Mary Ann Bay described above. That the vegetation was sparse enough to allow dune movement implies a semi-arid climate at this location in the LGM. The soils in the area are predominantly shallow and formed in Permian and Triassic siltstones and sandstones, but at Southwood A the deposit underlying the dune is a deeply weathered fan deposit formed in part from dolerite which has weathered to reddish-brown clay (Fig. 8). This clayey soil is likely to have retained more moisture than the surrounding shallow silty and sandy soils and favoured better vegetation cover, which could have been instrumental in trapping aeolian deposits at this location.

Figure 9. (colour online) The Southwood A dune, consisting of quartzose sand overlying red-weathered doleritic fan alluvium. The dune accumulated in the LGM, at ca.19 ka.
Southwood B dune
Further north in the Arve River catchment (Fig. 10) a road section of sandy deposits 3 m deep was TL dated 60–28 ka (McIntosh et al., Reference McIntosh, Price, Eberhard and Slee2009). The section was later redated using OSL and TT-OSL techniques by Neudorf et al. (Reference Neudorf, Lian, McIntosh, Gingerich and Augustinus2019), who also obtained OSL and TT-OSL ages from samples collected from below road level to 5.53 m depth (samples SB4–SB7) (Table 3). The base of the section was not reached.

Figure 10. (colour online) Longitudinal dunes west of Southwood B.
Table 3. Southwood B stratigraphy and ages (from Neudorf et al. Reference Neudorf, Lian, McIntosh, Gingerich and Augustinus2019, table 4).

1 The radiocarbon age is not calibrated. ‘As reported’ TL ages, reproduced from McIntosh et al. (Reference McIntosh, Price, Eberhard and Slee2009) were calculated using dose rates measured using thick source alpha counting (U and Th activities) and atomic emission spectroscopy (K activity). ‘Revised’ TL ages were recalculated using dose rates measured by Neudorf et al. (Reference Neudorf, Lian, McIntosh, Gingerich and Augustinus2019) using neutron activation analysis.
2 OSL sampling was performed on 7 December 2007; sampling depths are those at centres of sampling tubes. Ages shown are the weighted mean of the preferred OSL and TT-OSL ages for each sample (Neudorf et al., Reference Neudorf, Lian, McIntosh, Gingerich and Augustinus2019, table 4).
3 Description according to the Australian Soil and Land Survey Handbook (National Committee on Soils and Terrain, CSIRO, 2019). For a full description see Neudorf et al. (Reference Neudorf, Lian, McIntosh, Gingerich and Augustinus2019).
4 ‘Charcoal’ in these layers dissolved during the pre-treatment basic wash and could not be dated.
5 Tentative.
The source area for the Southwood B deposits is likely to have been the Willamette Creek floodplain (within 100 m of the dune) and the Arve River floodplain approximately 1.5 km to the west. Undated longitudinal quartzose dunes forming east-west ridges approximately 3 m high and up to 600 m long occur on the Arve River floodplain and on terraces of Willamette creek, immediately west of Southwood B (Fig. 10).
Well-developed organic-rich palaeosols are absent in the Southwood B stratigraphic column but several stratigraphic breaks, marked either by an underlying horizon with greater clay content, or better developed soil structure, or charcoal fragments, are interpreted to be weakly-developed palaeosols. There are no indications in the profile of an intensity of weathering resembling that in the present-day soil, or of major disconformities. The original TL age of the topmost sample (27.9 ± 2.1 ka; W4014) is older than the revised OSL and TT-OSL age (19.7 ± 2.2 ka) from the same sample (Table 3). This is probably because the TL ages have not been corrected for any surface (modern) sample residual dose (D. Price, personal communication), and they were measured using multiple aliquot techniques that determine one age value for a sample (Shepherd and Price, Reference Shepherd and Price1990), rather than a distribution of age values, from which a minimum age can be calculated (Galbraith et al., Reference Galbraith, Roberts, Laslett, Yoshida and Olley1999). Therefore, the OSL and TT-OSL age estimate for W4014 (19.7 ± 2.2 ka) is considered most accurate (Neudorf et al., Reference Neudorf, Lian, McIntosh, Gingerich and Augustinus2019); it is similar to the ages (18.7 ± 1.2 ka and 19.1 ± 1.3 ka) obtained for the Southwood A dune (Fig. 8).
One sample (W4013 from 0.96–1.06 m depth) gave a TL age (55.4 ± 3.0 ka) out of the expected age order, which suggested that either there has been local reworking of aeolian sediment without total resetting of the TL signal, or that near-source alluvial grains retaining a previous TL signal have been incorporated into the aeolian deposit with only partial resetting (McIntosh et al., Reference McIntosh, Price, Eberhard and Slee2009). However, when these TL ages were recalculated using dose rates measured by neutron activation analysis from the same samples (Neudorf et al., Reference Neudorf, Lian, McIntosh, Gingerich and Augustinus2019), the ages of samples W4011, W4012, W4013 were equivalent within 1 sigma (see revised figures in Table 3), and the ages of underlying samples W4009 and W4010 were slightly younger (Neudorf et al., Reference Neudorf, Lian, McIntosh, Gingerich and Augustinus2019). Because this apparent age reversal appears to affect all methods of equivalent dose (De) measurement (TL, OSL and TT-OSL), the reversal is likely caused by spatial variations in environmental dose rate that have not been taken into account in our dose rate measurements. Charcoal sampled at ca. 1.5 m depth (the same depth as TL sample W4012) was AMS dated >40 14C ka BP (uncalibrated) (Table 3), i.e., as expected from the revised TL age (49.7 ± 5.9 ka) the charcoal is beyond the range of radiocarbon dating.
Revised TL ages from samples W4009 and W4010 agree (within error) with both the OSL and TT-OSL age estimates of coeval sample SB3, providing confidence in the TL, OSL and TT-OSL dating methods. The OSL and TT-OSL chronology from samples SB4 through SB7 lower in the section increases with depth from 49 ka to 184 ka, which puts the aeolian sediments at ~5.5 m depth into MIS 6.
The Southwood B section is one of the longest known records of aeolian deposition at a non-coastal site in Australia, and demonstrates intermittent deposition of sand and silt for about 165,000 years. The overall rate of accumulation of sediment in the upper portion of the section (0.46 m to 3.35 m depth) is about 0.10 mm per year, five times higher than the rate of accumulation (about 0.02 mm per year) of underlying sediments at 3.85 m to 5.53 m depth. Assuming little or no loss of accumulated sediment by erosion, these data may indicate windier and/or drier conditions during MIS 2–4 than in earlier cold episodes, or, alternatively, greater supply of sand and silt from nearby sources (floodplains) during this period.
Warra
At Warra in the Huon River valley southwest of Hobart, a narrow strip of dunes occurs on a terrace forming the north bank of the Huon River. A dune 2.5 m deep was excavated and a sample of sand taken from 2.0 m depth gave a TL age of 40.6 ± 1.2 ka (W4553; McIntosh, Reference McIntosh2012a). One kilometre west of this site aeolian sands at Slees Cutting were TL dated 34 ± 1.7 ka and 33.5 ± 1.8 ka (McIntosh et al., Reference McIntosh, Price, Eberhard and Slee2009). The ages obtained show that the bouldery terrace underlying the aeolian deposits at both sites is 41 ka old or older. The coincidence of the older age with the arrival of Aborigines in southern Tasmania at ca. 40 ka (Allen, Reference Allen1996) may be significant: it is possible that both in the Huon River catchment, and also in the Jordan River catchment upstream of the site described by Paton (Reference Paton2010), a dry climate and drought-tolerant vegetation, combined with increased fire frequency following Aboriginal arrival (in order to facilitate movement and provide enhanced grazing areas for wildlife; Gammage, Reference Gammage2011; Fletcher et al., Reference Fletcher, Hall and Alexandra2020) led to increased erosion (Macphail and Jackson, Reference Macphail and Jackson1978; McIntosh et al., Reference McIntosh, Price, Eberhard and Slee2009; Fletcher and Thomas, Reference Fletcher and Thomas2010), which in turn increased the supply of sandy source material to river floodplains and led to dune accumulation.
Maynes Junction
At Maynes Junction at 42.776oS (Fig. 11), three prominent white or grey silty or fine sandy layers were dated by radiocarbon and TL methods (McIntosh Reference McIntosh2012b; Table 4). These are overlain and separated by layers formed in gravelly colluvium derived from Permian siltstone, which has weathered to brown-coloured gravelly clays or silty clays, as described by Grant et al. (Reference Grant, Laffan, Hill and Neilsen1995). Published information was supplemented with two new TL ages, particle-size analysis, and chemical analysis (see Supplementary Material for methods and derivation of TL ages).

Figure 11. (A) General view of the Maynes Junction section, showing the three pale layers interpreted to be aeolian, separated by brown colluvium derived from weathered Permian siltstone; foreground spade is 1 m long. (B) Detail of the well-structured palaeosol underlying the top pale layer; tape is marked at 10 cm intervals. (C) Prominent distorted charcoal band and infilled cracks in lowest aeolian layer; tape is marked at 10 cm intervals. (For interpretation of the references to colour in this figure legend, the reader is referred to the web version of this article.)
Table 4. Interpretation of palaeolandscape processes and palaeoclimate from the Maynes Junction site.

An interpretation of the genesis of the Maynes Junction exposure is given in Table 4. The pale layers cannot be explained by current or past pedological processes: the soils are not poorly drained or gleyed, nor do they contain evidence (e.g., angular Permian gravels) indicating that they result from pedogenic clay eluviation from a subsoil horizon formed in gravelly colluvium which is ubiquitous on slopes around this site.
Analysis (Table 5) shows that the top and lowest pale layers contain more than 60% silt and have the lowest clay percentage of any layers in the profile; they are also dominated by quartz, and consequently have high silica content. Permian gravels which are plentiful in the yellowish-brown clayey layers are almost absent in the pale layers; those present may have been derived from upslope. As the pale layers differ both in texture and silica content from the intervening weathered colluvium and from Permian colluvium in nearby soils they are likely to have originated from an allochthonous silica-rich source, i.e., they were probably introduced by aeolian processes. The most likely source for the pale aeolian layers is the wide (2.5 km) combined floodplain of the Tyenna River and Kallista Creek 3–5 km northwest of Maynes Junction, where boreholes up to 30 m deep have revealed intermittent (but undated) accumulations of quartzose silts and sands (figs. 4 and 5 in Walker, Reference Walker2016; Mineral Resources Tasmania cores BH2 and BH3). Sediment supply to floodplains may have been enhanced during periods of snow melt on nearby mountains, for example from the glaciated Mt. Mueller (1245 m asl).
Table 5. Particle-size analysis and silica content of layers at Maynes Junction.

1 Note that the section analysed did not intersect the middle pale layer described in Table 4.
That dry conditions prevailed when the aeolian layers were deposited is illustrated by the cracks developed in the lowest aeolian layer (Figure 11C) (64% silt and 15% clay, Table 5). Such cracks (called “gammations” in New Zealand) are typical of Pallic soils developed in widespread silty loess of similar particle size distribution that accumulated during the dry and cold last glacial period on the terraces and rolling land of the eastern South Island of New Zealand lowlands in seasonally dry areas (Bruce, Reference Bruce1971; fig. 2 in McIntosh, Reference McIntosh1984; Manaaki Whenua Soils Portal, 2020).
Noteworthy is the TL age of the upper aeolian deposit (19.6 ± 1.4 ka) which closely matches the two TL ages (18.7 ± 1.2 and 19.1 ± 1.3 ka) for the isolated dune at Southwood A and the OSL/TT-OSL age for the topmost layer at Southwood B (19.7 ± 2.2 ka). (These ages are within the range [24 ± 2 to 19 ± 2 ka] of siliceous aeolian sand accumulation north of Bass Strait at Cape Liptrap on the Victorian coast [Gardner et al. {Reference Gardner, Webb, Davis, Cassel, Pezzia, Merrits and Smith2006}] and within the range [23.8 ± 1.6 to 16.8 ± 0.9 ka] of the ages of the Ainslie Dunes in northeast Tasmania.) Like the Southwood A isolated dune, Maynes Junction is distant from likely sources such as floodplains, indicating accumulation in a dry semi-arid environment with sparse vegetation cover between the site and the source area, but sufficient vegetation at the accumulation site to trap airborne or saltating sediment during the late LGM.
A palaeosol with well-developed soil structure (blocky peds) immediately underlies the topmost pale layer at Maynes Junction (Fig. 11). The high clay content and well-developed soil structure of the palaeosol resembles soils formed under forest cover today, suggesting that it was formed in a moist climate, possibly under forest vegetation, and was buried when dry conditions and aeolian deposition recommenced at around 20 ka. A period of moister conditions immediately prior to a final episode of dry cold stadial conditions after 22.5 ka is also recorded in the Dunlin Dune record, where a podzol formed after 21.0 ± 1.5 ka, before being buried by renewed dune-building which began before 15.9 ka. If the prominent palaeosol at Maynes Junction can be assigned to the same post-21.5 ka wet period as that recorded at Dunlin Dune, then the moist period at Maynes Junction must have occurred between about 21.0 ± 1.5 ka and 19.6 ± 1.4 ka, i.e. it lasted about 1000–2000 years.
Evidence from other sites (Fig. 12) supports a moist interval between approximately 21 and 20 ka: (1) the Antarctic (EPICA C) dust record is highly variable in the 21–19.6 ka period, with dust levels varying almost tenfold (149 μg/kg to 1470 μg/kg) in this time interval (Delmonte et al., Reference Delmonte, Basile-Doelsch, Petit, Maggi, Revel-Rolland, Michard, Jagoutz and Grousset2004), implying climatic instability over sub-millennial periods of time; (2) at Lake Surprise (39.06oS) in Victoria, Australia, Falster et al. (Reference Falster, Tyler, Grant, Tibby, Turney, Lőhr, Jacobsen and Kershaw2018, figure 4) recorded low aeolian Si inputs and moister conditions for plants between 21 and 20 ka; (3) speleothem records from Mt. Arthur (41.22oS) in New Zealand indicate that forest productivity increased rapidly for a short period between 21 and 20 ka between two δ18O excursions (MD3/5 and MD3/4) that correlate with glacial advances (table 2 and fig. 7 in Hellstrom et al., Reference Hellstrom, McCulloch and Stone1998); (4) at Galway Tarn in south Westland, New Zealand (43.41oS), Vandergoes et al. (Reference Vandergoes, Newnham, Denton, Blaauw and Barrell2013) also record a brief interstadial period (Gt5) immediately preceding the final LGM stadial, but it occurs earlier (ca. 22.6–21.8 cal ka BP); as does (5) a peak of eucalypt cover at 18.240 ± 0.100 14C ka BP (22.37–21.85 cal ka BP) recorded at Hazards Lagoon (42.17oS) on the Tasmanian east coast (Mackenzie and Moss, Reference Mackenzie and Moss2014).

Figure 12. Suggested correlations of Maynes Junction palaeosols and Dunlin Dune palaeosol with other climatic indicators: (A) the red line indicates the TL age (19.6 ± 1.4 ka) of the upper aeolian deposit at Maynes Junction; this is the minimum age of the palaeosol below; (B) the blue line indicates the TL age (21.0 ± 1.5 ka) of the sediment in which a palaeosol has formed in the Dunlin Dune; this is the maximum age of the palaeosol; (C) the EPICA dust record from Dome C, Antarctica (Delmonte et al., Reference Delmonte, Basile-Doelsch, Petit, Maggi, Revel-Rolland, Michard, Jagoutz and Grousset2004); (D) percentage of Si in the Lake Surprise core, Victoria, Australia (Falster et al., Reference Falster, Tyler, Grant, Tibby, Turney, Lőhr, Jacobsen and Kershaw2018); (E) δ13C in a speleothem from Mt. Arthur, South Island, New Zealand (Hellstrom et al., Reference Hellstrom, McCulloch and Stone1998); (F) the green arrow indicates the median radiocarbon age (22.1 cal ka BP) of eucalypt increase in the Hazards Lagoon core, Tasmania (Mackenzie and Moss, Reference Mackenzie and Moss2014) and the median radiocarbon age (22.2 cal ka BP) of the small trees and shrubs peak in the Galway Tarn record from South Island, New Zealand (Vandergoes et al., Reference Vandergoes, Newnham, Denton, Blaauw and Barrell2013). (For interpretation of the references to colour in this figure legend, the reader is referred to the web version of this article.)
A likely influence on rainfall and vegetation cover at Maynes Junction is oscillation of the subantarctic front: its retreat southwards would be accompanied by milder and wetter conditions while its advance northwards over Tasmania would increase aridity on account of the cooler waters around southeast Australia (Falster et al., Reference Falster, Tyler, Grant, Tibby, Turney, Lőhr, Jacobsen and Kershaw2018, p. 119). Such changes can cause surface sea temperature changes of ca. 6oC within 100 years (Barrows et al., Reference Barrows, Juggins, De Dekker, Calvo and Pelejero2007).
The middle pale layer at Maynes Junction (Table 4, Figure 11) (AMS dated 26.931 ± 0.351 14C ka BP [30.50–31.50 cal ka BP]) probably formed during the same dry episode that gave rise to the deep silty and sandy aeolian gully infill at Cradoc Hill (TL dated 31.8 ± 1.4 to 25.3 ± 1.3 ka) (McIntosh et al., Reference McIntosh, Kiernan and Price2004); the partly aeolian gully infill at Maynes Hill (AMS dated 24.475 ± 0.288 14C ka BP [29.47–28.17 cal ka BP]); similar infill at Sharps Gully (TL dated 30.1 ± 0.3 to 23.5 ± 1.7 ka and AMS dated 25.175 ± 0.261 14C ka BP [28.64–29.93 cal ka BP]) (McIntosh et al., Reference McIntosh, Price, Eberhard and Slee2008, Reference McIntosh2012); the younger deposits at Llanherne (TL dated ca. 26 ka); and the extensive aeolian deposits at Mary Ann Bay (TL and OSL dated in the range 31–25 ka). These six sites indicate that from about 30 ka to 23 ka (spanning the late MIS 3 and early MIS 2) conditions favouring deflation from source areas and accumulation at vegetated or protected downwind sites prevailed in southern Tasmania. Significantly, there was also a phase of deposition at ca. 27 ka on southern Prime Seal Island. As discussed for particular sites, increased droughtiness, increased sediment supply (from fluvial sources) and/or land exposure from receding sea levels, and increased windiness may all have played a part in inducing wind erosion and concurrent deposition of aeolian sediment at this time.
Aeolian deposits dating to MIS 4 are not present in the Maynes Junction record. The lowest pale layer at Maynes Junction with the TL age of 90.2 ± 10.2 ka has not been described as a distinct layer elsewhere, but it may correspond with the deposit dated 84.1 ± 5.5 ka at Southwood B (Table 3). It indicates a dry period favouring aeolian activity in MIS 5c.
CONCLUSIONS
Tasmania has extensive aeolian deposits. Remnants of longitudinal desert dunes that formed at the margins of the now-flooded Bassian Plain are found in northern mainland Tasmania. Last glacial ages (24–16 ka) have been obtained, mostly from upper layers of these dunes, but they probably started forming much earlier. Sands dated 56 ka on Prime Seal Island in the Furneaux Group, and 60 ka at Rocky Point on King Island, are also likely to be remnants of Bassian Plain inland dunes formed when the sea level was much lower, but their original form has been largely destroyed by later erosion and dune building. The location and age of these deposits suggest a widespread and broadly concurrent onset of semi-arid or arid conditions conducive to aeolian transport of sediment across northern Tasmania and the Bassian Plain commencing late in MIS 4 and continuing to MIS 2.
Other extensive aeolian terrains on King Island, and those on Flinders Island, lungtalanana (Clarke Island) and Hunter Island provide further evidence for the scale and timing of aeolian influences on the Bassian Plain. The aeolian deposits on these islands are mostly poorly described and undated, but many deposits are assumed to have a last glacial age, based on ages obtained for similar deposits on Prime Seal Island and in northeast Tasmania. In contrast, the field evidence indicates that inland dunes located at the eastern margin of the Yellow Rock River basin on King Island are interglacial deposits formed during high sea levels, probably in MIS 9.
Sandsheets, dunes and deflation basins with associated lunettes on their downwind (eastern) sides are common in eastern Tasmania and the subhumid Tasmanian Midlands but none have been dated, except for charcoal relating to late Aboriginal occupation. Under the present subhumid climate these deposits are stable; they indicate a period of semi-arid climate when tree cover was minimal and chenopod grasslands with intervening bare ground dominated (Macphail and Jackson, Reference Macphail and Jackson1978), allowing greater supply of sediment from eroding streams and bare floodplains, particularly where the deflation basins were fed by runoff and erosion from adjacent uplands.
Dunes are extensive in inland Tasmania and in coastal areas of the south and west. The most complete record is at the Southwood B site in the Arve River catchment, where deposition over a period of 165 ka is recorded. The presence of both isolated and longitudinal inland dunes in areas of the Arve and Huon valleys that now receive >1350 mm of rain per annum attest to the greater extent of dry conditions in the last glacial period. Many coastal dunes are Holocene in age, but remnants of dunes dating to 60–56 ka on the Tasmanian west coast including King Island indicate widespread aeolian activity on the much wider coastal plains that existed in the last glacial period. Other dunes and aeolian deposits (sandsheets and gully infills) date to 40 ka and later, with several sites having aeolian deposits dating to 31–23 ka. The most extensive and thickest deposits in this period are those dated 31–25 ka at Mary Ann Bay on the South Arm Peninsula (Slee et al., Reference Slee, McIntosh, Price and Grove2012; Shin, Reference Shin2013). These deposits are part of a widespread and probably continuous cold-climate sandsheet that formed east of the lower Derwent River estuary (their assumed source) and included aeolian deposits at other sites nearby (Donaldson, Reference Donaldson2010). Low-lying parts of this area have since been eroded and inundated by rising sea level, leaving only higher aeolian remnants.
The Maynes Junction section in southern Tasmania has recorded repeated episodes of aeolian deposition and intervening periods of hillslope instability. The aeolian deposits are deduced to be derived from deflation of quartzose silt and fine sand from upwind floodplains. Extensive deposition on these floodplains is likely to have resulted from snow melt in the mountains west of Maynes Junction, e.g., from Mt. Mueller (1245 m asl). The stratigraphy at Maynes Junction allows climatic changes to be interpreted from 90 ka to the Holocene: three periods of aeolian deposition around 90 ka, 30 ka, and 19.7 ka are recorded, separated by two milder periods. In one of these periods, pronounced soil development occurred, probably under forest vegetation, indicating that within the LGM, at approximately 21–20 ka, there was a short-lived relatively mild and wet period likely to have been caused by a southerly shift of the subantarctic front, favouring higher rainfall in the west and southwest (and probably concurrent expansion of forests) due to the more frequent passage of depressions over Tasmania. This brief mild interval was followed by resumed dry conditions in the coldest period of the LGM which induced a final phase of aeolian activity at around 19 ka. The deduced climatic oscillations at Maynes Junction match those recorded at Lake Surprise in Victoria (Falster et al., Reference Falster, Tyler, Grant, Tibby, Turney, Lőhr, Jacobsen and Kershaw2018) and in New Zealand (Hellstrom et al., Reference Hellstrom, McCulloch and Stone1998), but the mild interval in New Zealand dated by Vandergoes et al. (Reference Vandergoes, Newnham, Denton, Blaauw and Barrell2013) was earlier than that recorded at Maynes Junction.
The observations summarised in this review raise several issues regarding the climatic conditions required to induce formation of dunes and other aeolian deposits. The formation of coastal dunes is undoubtedly largely supply-dependent, and some inland dunes, such as those at Warra (close to the Huon River) and the longitudinal dunes west of the Southwood B deposit (downwind of the Arve River floodplain) may also be largely explained by pulses of sediment supply resulting from sparse vegetation cover on floodplains and on uplands where seasonal snow melt may have been a major factor inducing flooding and erosion on lowlands. Early Holocene transverse dunes dated 10.1 ± 1.2 ka near Strahan are also likely to have accumulated as a result of increased sediment supply to lowland floodplains during the final stages of glacial ice melt on the West Coast Range. The evidence from other sites, such as the Southwood A dune perched relatively high in the landscape over a patch of water-retentive doleritic soils in a sandstone landscape with shallow soils, suggest that sparse cover of vegetation in the surrounding area, probably induced by a semi-arid climate, has facilitated dune movement over several kilometres. In contrast the many lunettes (all undated) downwind (east) of ephemeral lakes in the Tasmanian Midlands have accumulated close to sources (lagoons), which may indicate the presence of stabilising vegetation at lake margins. However, associated with these lunettes are more subtle dune forms and sandsheets, and these landforms, along with the only pollen record for an ephemeral lake in the area (Macphail and Jackson, Reference Macphail and Jackson1978), are evidence for a semi-arid climate with an intermittent land cover of low vegetation, probably in late last glacial period.
Whether wind speeds were higher during the last glacial period is uncertain. Petit et al. (Reference Petit, Briat and Royer1981) and Zhou et al. (Reference Zhou, Williams and Petersen1994) argued for higher wind speeds to explain aerosol deposition in East Antarctica and Victoria, Australia, respectively, and Fletcher and Thomas (Reference Fletcher and Thomas2010) suggested that an expanded high pressure system over the Australian mainland coupled with greater extent of sea ice to the south of Tasmania could have resulted in stronger westerly winds (and higher rainfall) than at present on the west coast of Tasmania and stronger and drier foehn winds in the east. Bowden (Reference Bowden1983) calculated that the wind speeds required to explain particle size distribution in the Ainslie dunes in northeast Tasmania must have been about 30% stronger than at present. Hesse (Reference Hesse1994) initially accepted that wind speeds were probably higher during glacial periods, but in later papers (Hesse and McTainsh, Reference Hesse and McTainsh1999, Reference Hesse and McTainsh2003) proposed that mid-latitude westerlies in the Australian region were no stronger during the last glacial period than in the Holocene, and argued that dust supply rather than wind speed was the prime driver of aeolian sedimentation in mainland Australia and the Tasman Sea. However Bowden's conclusions (Bowden, Reference Bowden1983) have not been refuted, and his study, and the inclusion of shells in the aeolian deposits of the exposed site at Mary Ann Bay, suggest that in Tasmania higher wind speeds may well have contributed to the extensive aeolian deposits found in the state, although patchy low vegetation (partly induced by drought and partly by low CO2 concentrations [Bragg et al., Reference Bragg, Prentice, Harrison, Eglinton, Foster, Rommerskirchen and Rullkőtter2012]), greater deflation from unvegetated river floodplains fed by snow melt, and burning of vegetation by the Aboriginal population are also likely to have had an influence.
ACKNOWLEDGMENTS
This study was partly supported by research funds provided by the board of the Forest Practices Authority, Tasmania. O.B. Lian acknowledges support from a Natural Sciences and Engineering Research Council (NSERC) of Canada Discovery Grant and an NSERC Research Tools and Equipment Grant. C.M. Neudorf was supported by a Hakai Postdoctoral Fellowship while at the University of the Fraser Valley, BC, Canada. D.P. Price of the University of Wollongong undertook the TL analyses. The cooperation of Sustainable Timbers Tasmania (formerly Forestry Tasmania) in allowing research and sampling within state forests is gratefully acknowledged. We thank J. Shulmeister and D. Booth and two anonymous reviewers for their constructive suggestions for improving the manuscript.
SUPPLEMENTARY MATERIAL
The supplementary material for this article can be found at https://doi.org/10.1017/qua.2020.83.


