

The following study investigates the relationship between ideological orientation, disposition, and behavior by manipulating group inequality during a public goods game. In focusing on inequality, the intention is not to reduce ideological difference to a unidimensional concept but to investigate the dispositions associated with a single attitudinal dimension that is important to the larger ideological landscape (Feldman & Johnson, 2014). Attitudes toward inequality are chosen as the target of manipulation because of their connections to ideological differences across social (Anderson et al., Reference Anderson, Mellor and Milyo2008), physiological (Oxley et al., Reference Oxley, Smith, Alford, Hibbing, Miller, Scalora and Hatemi2008), and genetic levels of analysis (Hatemi et al., Reference Hatemi, Medland, Klemmensen, Oskarsson, Littvay, Dawes and Christensen2014). Collectively, the correlation of attitude scales with psychophysiological measures across multiple levels of analysis suggests that deeper evolutionary psychological processes such as threat or error management may contribute to the expression of ideological differences (Barkow, Reference Barkow2005; Hibbing et al., Reference Hibbing, Smith and Alford2014; Janoff-Bulman, Reference Janoff-Bulman2009; Mansell, Reference Mansell2018; Tuschman, Reference Tuschman2013). Rather than being adaptive themselves, different attitudes may be by-products of variation in how individuals perceive or respond to information about their environment (McElreath & Strimling, Reference McElreath and Strimling2006; Tooby & Cosmides, Reference Tooby and Cosmides1990, p. 24). This study is intended to make a small but important contribution to research on the dispositional as well as ultimate causes of ideological variation by identifying a single instance in which the reception of social information leads to differences in behavioral outcomes among liberals and conservatives.
As part of the experiment, liberal and conservative orientations are defined by participants’ attitudes as measured on the Wilson-Patterson Index (Wilson & Patterson, Reference Wilson and Patterson1968). The Wilson-Patterson Index captures orientation using operational ideology, a series of one’s views on specific matters of policy or government responsibility, as opposed to symbolic ideology, the ideological label with which one most closely identifies (Chen & Goren, Reference Chen and Goren2016; Ellis & Stimson, Reference Ellis, Stimson, Sniderman and Highton2011). During a public goods game, the conditions are manipulated to create an inequality between participants to observe the effect on individuals’ tendency toward self-interested versus prosocial behavior. The purpose is to answer the following question: do individuals with different attitudes toward inequality display differences in social behavior in response to unequal social conditions or in response to the rectification of these conditions?
Ideology and dispositions
Dispositions are the tendencies or states of readiness to respond to different environmental stimuli in different ways. A dispositional approach understands ideological differences as a consequence of variation in individuals’ tendencies to respond to or characterize information. Consistent with this approach, studies on the cognitive and psychological differences between liberal- and conservative-oriented individuals suggest that these two groups have very different sensitivities and responses to socioenvironmental stimuli (Castelli & Carraro, Reference Castelli and Carraro2011; Hibbing et al., Reference Hibbing, Smith and Alford2014). Research on environmental learning shows that conservatives employ a more focused learning strategy and that they are more likely to learn from negative stimuli, while liberals employ a more generalized learning strategy (Shook & Fazio, Reference Shook and Fazio2009). A study of trust behavior by Mansell (Reference Mansell2018) finds that trust in liberal-oriented individuals increases in response to cues that a potential partner shares similar values, while trust in conservative-oriented individuals decreases in response to cues that a potential partner does not share similar values. In a different study, using a test of cognitive flexibility, liberals are shown to have a more flexible cognitive style than conservatives. For example, liberals are more likely to change their habitual response when presented with a novel stimulus (Amodio et al., Reference Amodio, Jost, Master and Yee2007). Furthermore, studies on physiological responses to environmental stimuli using a measure of skin conductance find an association between conservative social attitudes, such as support for military spending or military intervention, and a greater sensitivity to negative stimuli. This same study finds an association between liberal attitudes toward foreign aid and welfare spending and reduced sensitivity to negative stimuli (Oxley et al., Reference Oxley, Smith, Alford, Hibbing, Miller, Scalora and Hatemi2008).
At the level of cognition, research into human cognitive activity using functional magnetic resonance imaging finds that liberals and conservatives differ in the volume and activity of key brain regions involved in decision-making (Kanai et al., Reference Kanai, Feilden, Firth and Rees2011). These studies find that greater liberalism is associated with an increase in gray matter volume in the anterior cingulate cortex, whereas greater conservatism is associated with an increase in volume in the right amygdala. The anterior cingulate cortex (ACC) is an area of the brain linked to affective decision-making and altering habitual response patterns. The right amygdala is an area of the brain linked to the processing of negative emotional stimuli as well as the identification of threat (Adolphs et al., Reference Adolphs, Tranel, Damasio and Damasio1995; Schreiber et al., Reference Schreiber, Fonzo, Simmons, Dawes, Flagan, Fowler and Paulus2013; van der Plas et al., Reference van der Plas, Boes, Wemmie, Tranel and Nopoulos2010). Finally, research into the decision-making behavior of liberals and conservatives by Schreiber et al. (Reference Schreiber, Fonzo, Simmons, Dawes, Flagan, Fowler and Paulus2013) finds that while the behavior of liberals and conservatives does not differ during a risk-taking task, the associated brain activity does differ. Specifically, liberals show significantly greater activity in the left insula cortex, while conservatives show significantly greater activity in the right amygdala. The left insula cortex is involved in the representation of internal bodily cues for subjective feeling states and emotional regulation, related to signaling potential changes in interceptive states, as well as to changes in possible decision-related outcomes (Schreiber et al., Reference Schreiber, Fonzo, Simmons, Dawes, Flagan, Fowler and Paulus2013).
In sum, the literature on the psychological differences in liberals and conservatives shows that a complex set of processes contribute to ideological expression (Hibbing et al., Reference Hibbing, Smith and Alford2014, p. 297). What remains unknown is whether these impact social behavior, and if so, what conditions may trigger these outcomes?
Ideology and inequality
This study manipulates inequality during a public goods game to investigate how dispositions associated with ideological orientation impact social behavior and the conditions that trigger these outcomes. Inequality is selected as the target of manipulation because of its close association with different ideological orientations. Social attitudes and values are among the most reliable traits associated with liberal and conservative ideological orientations. Numerous studies show that ideological orientation, as well as voting behavior, can be predicted on the basis of attitudes and values related to inequality, redistribution, and universalism (Jost et al., Reference Jost, Federico and Napier2009; Jost et al., Reference Jost, Glaser, Kruglanski and Sulloway2003; Piurko et al., Reference Piurko, Schwartz and Davidov2011; Schwartz et al., Reference Schwartz, Caprara and Vecchione2010; Smith et al., Reference Smith, Oxley, Hibbing, Alford and Hibbing2011; Thorisdottir et al., Reference Thorisdottir, Jost, Liviatan and Shrout2007). This is true across a variety of social contexts.
These studies find that a liberal ideological orientation is associated with attitudes and values for a more egalitarian social environment, while a conservative orientation is associated with the tolerance or justification of social inequality, competition, and hierarchy, or a greater preference toward meritocracy (Jost et al., Reference Jost, Federico and Napier2009; Jost et al., Reference Jost, Glaser, Kruglanski and Sulloway2003; Schwartz et al., Reference Schwartz, Caprara and Vecchione2010; Smith et al., Reference Smith, Oxley, Hibbing, Alford and Hibbing2011; Thorisdottir et al., Reference Thorisdottir, Jost, Liviatan and Shrout2007). Studies on the heritability of attitudes and values find that attitudes and values toward inequality, redistribution, or universalism not only are strong predictors of ideological orientations, but also that these attitudes and values also share a “common genetic influence” in addition to the influence of environmental factors (Hatemi et al., Reference Hatemi, Medland, Klemmensen, Oskarsson, Littvay, Dawes and Christensen2014, p. 291). This relationship between genes and attitudes is subject to repeated validation (Alford et al., Reference Alford, Funk and Hibbing2005; Alford et al., Reference Alford, Funk and Hibbing2008; Bell et al., Reference Bell, Schermer and Vernon2009; Friesen & Ksiazkiewicz, Reference Friesen and Ksiazkiewicz2015; Hatemi et al., Reference Hatemi, Alford, Hibbing, Martin and Eaves2009; Hatemi et al., Reference Hatemi, Hibbing, Medland, Keller, Alford, Smith and Eaves2010; Hatemi et al., Reference Hatemi, Gillespie, Eaves, Maher, Webb, Heath and Montgomery2011; Hatemi et al., Reference Hatemi, Medland, Klemmensen, Oskarsson, Littvay, Dawes and Christensen2014).
While the connection between attitudes, values, and ideology is well established, in-depth explorations of the psychological factors underlying this relationship are recent (Hibbing et al., Reference Hibbing, Smith and Alford2014). Previous studies investigated the effect of ideologically relevant conditions on social behaviors, such as religious practice, general conditions of inequality, and social competition (Anderson et al., Reference Anderson, Mellor and Milyo2008; Dawes et al., Reference Dawes, Johannesson, Lindqvist, Loewen, Ostling, Bonde and Priks2012; Fung & Au, Reference Fung and Au2014; Loewen, Reference Loewen2010; Sosis, Reference Sosis2000; Sosis & Bressler, Reference Sosis and Bressler2003; Sosis & Ruffle, Reference Sosis and Ruffle2004; West et al., Reference West, Gardner, Shuker, Reynolds, Burton-Chellow and Sykes2006); however, researchers have yet to directly consider whether conditions of inequality produce heterogeneous outcomes in the social behaviors of liberals or conservatives.
Testing this effect is potentially rewarding. Attitudes and values are inherently social positions. If we observe that socioenvironmental conditions (which reflect the content of these different views) produce heterogeneous social behaviors in liberal- and conservative-oriented individuals, then this may enable researchers to better understand the psychological motivations and functional causes underlying these different attitudes and values (Petersen, Reference Petersen2009; Petersen et al., Reference Petersen, Sznycer, Cosmides and Tooby2012). Consequently, investigating the heterogeneous effects of inequality on the social behavior of liberals and conservatives makes a small but important contribution to future research on attitudes, values, and ideological formation.
Experimental objectives
This experiment has three objectives: (1) to evaluate the effect of inequality on contributions to public goods, (2) to evaluate whether this effect is disproportionately expressed among liberal- or conservative-oriented individuals, and (3) to evaluate the effect of prosocial and self-interested social cues on contributions by liberal- and conservative-oriented individuals. As noted, by investigating the heterogeneous effect of inequality on social behavior, this study hopes to gain insight into the psychological factors and functional causes underlying the liberal/conservative dimension of the ideological spectrum. For example, do liberals and conservatives differ in their sensitivity to general social inequality? Or are differences in attitudes toward inequality more strongly associated with the sensitivity to different kinds of socioenvironmental information?
Public goods game
The experimental interaction is based on a standard one-shot public goods game (Camerer & Fehr, Reference Camerer, Fehr, Henrich, Boyd, Bowles, Camerer, Fehr and Gintis2004). Participants are randomly assigned to groups of six and awarded 20 tokens. The total payout for the experiment is based on both the number of tokens that participants retain and the number of tokens that participants receive from the public goods. Participants may choose to retain or allocate to the public goods any number of their tokens. All tokens kept by participants have a value of 1. All tokens allocated to the public goods are pooled with the contributions of all other group members, multiplied by 1.5, and then divided evenly among all players in the group. These tokens are then added, with a value of 1, to each player’s remaining tokens. The total number of tokens earned by a participant reflects the number of tokens retained plus the number tokens received from the public goods. Players earn real money in U.S. dollars for each token they have at the end of the interaction. Prior to the interaction, participants are given detailed instructions about the public goods (see the online appendix) and complete a series of questions to ensure that they correctly understand the interaction. This study was implemented online.
A common interpretation of public goods games is that they measure individuals’ tendencies toward self-interest (Camerer, Reference Camerer2003). This experiment is interested in how environmental conditions and social cues affect prosocial and self-interested tendencies. Prosociality and self-interest are defined by an individual’s contributions during the public goods game, with higher contributions representing prosociality and lower contributions representing self-interest. This study induces an inequality within groups of players during the public goods game by manipulating across treatments (matched pairs of treatments) the monetary value that different players receive per token. These values are $0.13, $0.11, $0.10, or $0.07 per token. This method introduces an inequality between group members that is independent of their specific contribution to the public goods—the inequality between players is independent of the number of tokens they earn during the public goods game. This allows for comparison of the effect of treatment on contribution that does not need to account for the relative difference in number of tokens—an important consideration given the objective to examine the change in prosociality of individuals’ responses to cues.
An alternative method is to vary the total number of tokens, giving high-payout players 30 tokens and low-playout players 20 tokens. However, this method requires consideration of both absolute and relative levels of contributions, complicating the interpretation of results. Mean and median contributions in economic games tend to be 50% of endowment, so if all players contribute 50%, then high-payout players contribute 15 tokens and low-payout players contribute 10 tokens. While the high-payout players clearly contribute a greater absolute number of tokens, their relative contributions are the same as the low-payout players. This makes it difficult to establish the intentions of high-payout individuals. Is it their intention to contribute more tokens than other participants, or are they just contributing half?
As this study is interested in how cues affect tendencies toward prosocial behavior, this complication is avoided by manipulating the value of each token. During the study, participants are not aware of the ideological orientation of their group members, nor are they aware that ideological differences are the target of the study. Players can earn between $0.35 and $5.85 in total from the game. Most players complete the study in less than 20 minutes. The average payment is $2.33, with payment ranging from $0.67 to $4.85.
Treatments
Before the public goods game, players are randomly assigned to one of two conditions: (1) a control condition, in which all players earn the same value ($0.10) per token, or (2) a treatment condition, in which the value ($) per token varies among members of the same group. Within the treatment conditions, one-half of the group will initially receive a high payout ($0.13) per token, and the other half will initially receive a low payout ($0.07) per token. Each treatment condition, therefore, is part of a matched set, and each treatment number corresponds to the payout per token that a participant is assigned to receive. For example, in Treatment 1, the control, all players earn ($0.10) per token. Players assigned to the control are matched into groups, and each player will receive the same payout ($0.10) per token. In comparison, Treatments 2 and 3 correspond to a matched set. During the public goods game, three players assigned to Treatment 2, “High Payout,” are matched with three players assigned to Treatment 3, “Low Payout.”
In each of the conditions, players are informed prior to the interaction that they will be randomly assigned to a player position that corresponds to the payout they will receive per token earned during the experimental interaction. After assignment participants are informed of their payout per token and the payout of all other members of their group. Participants are not aware that payouts vary outside their group.
In total, there are seven treatment conditions. With the exception of Treatment 1, the control, each treatment is part of a matched set. In Treatment 1, all participants earn $0.10 per token. Treatments 2 and 3, 4 and 6, and 5 and 7 represent matched pairs (see Table 1).
Table 1. Treatment pairs and assigned payouts.

In Treatments 2 and 3, the players assigned to Treatment 2 will earn $0.13 per token from the public goods, while the players assigned to Treatment 3 will only earn $0.07 per token. Treatments 2 and 3 allow for comparison of the effect of a general and randomly assigned inequality on levels of contribution by liberals and conservatives.
Treatments 4 and 6 are a matched pair. In Treatment 4, “Fair Payout,” participants are initially assigned to receive the low payout ($0.07) but are informed prior to the start of the public goods game that the high-payout players from Treatment 6 are “given the option to redistribute payouts” and “have chosen to do so.” Players in Treatments 4 and 6 each receive $0.11 per token. In this study, the redistribution of the payouts is assumed to constitute a prosocial “positive” cue of the intentions of high-payout individuals, as this decision is accompanied by a direct cost of $0.02 per token. Treatments 4 and 6, therefore, allow for observation of the effect a strong prosocial cue on overall contributions.
Treatments 5 and 7 are a matched pair. In Treatment 5, “Unfair Payout,” participants are initially assigned to receive the low payout ($0.07). However, prior to the interaction, these participants are informed that the high-payout players from Treatment 7 are “given the option to redistribute payouts” and “have not chosen to do so.” Players in Treatment 5 receive $0.07 per token, while players in Treatment 7 receive $0.13 per token earned. In this study, not redistributing the payouts is assumed to constitute a self-interested “negative” cue about the intentions of high-payout individuals. This is because all participants in the group are aware that the inequality in payouts per token is assigned at random and because this decision has a detrimental effect on their individual utility. Treatments 5 and 7, therefore, allow for observation of the effect of a strong self-interested cue on overall contributions.
In Treatments 6 and 7, participants are initially assigned to receive the high payout ($0.13). However, just prior to the start of the public goods game, these participants are given the option to redistribute the payout so that all players in the group, including themselves, earn the same payout, $0.11 per token. Unlike Treatments 2 and 3, in which the existence of inequality is a consequence of random external factors, in Treatments 6 and 7, the inequality is conditional on the decisions of other group members. Treatment 6, “Redistribution,” is a grouping of all participants who chose to redistribute the payouts, and Treatment 7, “No Redistribution,” is a grouping of all participants who did not choose to redistribute the payouts.
Importantly, assignment to Treatment 6 or 7 is not a consequence of random assignment but of the decisions made by each individual participant. In strictest terms, this presents a problem of inference, as it is impossible to determine whether individuals who self-selected into the “Redistribution” or “No Redistribution” conditions actually increased or decreased their levels of contribution as a result of treatment relative to the control. Consequently, no predictions are made with respect to Treatments 6 or 7. Additionally, the results of Treatment 6 and 7 are not included in the discussion of statistical results. The results are recorded in the statistical tables but without indications of significance.
Expectations and hypotheses
Based on research on their observed cognitive differences, this study has two general expectations about the behavior of liberal- and conservative-oriented individuals during the economic game. First, liberal-oriented individuals should increase their contributions if they are primed by a cue about the prosocial intentions of other actors. Second, conservatives should decrease their contributions if they are primed by a cue about the self-interested intentions of other actors. Following from these prospects, this study has the following expectations and makes the following predictions (see Table 2).
Table 2. Summary of hypotheses and their corresponding treatments.

Expectations 1 and 2
While research in political science demonstrates that liberals and conservatives differ in their attitudes toward inequality, research on the psychological traits associated with liberal and conservative ideological orientations offers no evidence that either group should be sensitive to conditions of a general and randomly assigned inequality. This expectation is preceded by two further considerations. First, the inequality is independent of the actions of group members. Second, prior to the experiment, participants are informed that during the interaction, members of their group will be randomly assigned to receive different payouts. As a result, while participants may be unhappy about the impact of the inequality on their individual payoffs, they should not perceive it as a negative cue about the intentions of other group members. Contributions in Treatments 2 and 3 should therefore be similar to the control.
As discussed by Anderson et al. (Reference Anderson, Mellor, Milyo and Morgan2005), “stereotypical” characterizations of liberals often portray them as altruistically motivated actors who should react strongly to inequality in all its forms. In practice, however, this view overshadows the complex nature of social behavior that often leads to selfish outcomes. Treatments 2 and 3 therefore provide an assessment of whether liberals are sensitive to conditions of general inequality or whether their reported sensitivity depends on additional socioenvironmental dynamics.
Expectation 1: Treatments 2 and 3
* Compared with the control conditions, the contributions by liberals will not be affected by a general intragroup inequality. (null effect)
Expectation 2: Treatments 2 and 3
* Compared with the control conditions, the contributions by conservatives will not be affected by a general intragroup inequality. (null effect)
Hypotheses 1 and 2
Greater volume in the ACC as well as greater activity in the insula cortex suggest that liberals may be more likely to (1) perceive social information as positively valenced (affectively positive) or (2) update their behavior or decision-making in response to a new or positive stimulus (Cacioppo et al., Reference Cacioppo, Gardner and Berntson1999; Kanai et al., Reference Kanai, Feilden, Firth and Rees2011; Schreiber et al., Reference Schreiber, Fonzo, Simmons, Dawes, Flagan, Fowler and Paulus2013). As previously noted, the ACC is a brain region associated with affective response (approach-avoid behavior), affective cognition, attention shifting, and conflict monitoring and error detection (Botvinick et al., Reference Botvinick, Nystrom, Fissell, Carter and Cohen1999; Elliott et al., Reference Elliott, Zahn, Deakin and Anderson2011; Kondo et al., Reference Kondo, Osaka and Osaka2004; Polli et al., Reference Polli, Barton, Cain, Thakkar, Rauch and Manoach2005). Defined as “reflecting an interface at which emotional and cognitive processes are integrated to generate behavior,” affective cognition is important for perception, labeling, and response to emotional stimuli (Elliot et al., Reference Elliott, Zahn, Deakin and Anderson2011). Through these functions, the ACC is also important for the expression of cooperative behavior (Rilling et al., Reference Rilling, Gutman, Zeh, Pagnoni, Berns and Kilts2002). Similarly, the insular cortices are important for emotional awareness and social emotions in particular (Gu et al., Reference Gu, Hof, Friston and Fan2013; Lamm & Singer, Reference Lamm and Singer2010). The activation of these cortices is linked to prosocial behaviors, including fairness and cooperation (Lamm & Singer, Reference Lamm and Singer2010). Generalized to this experimental context, these findings suggest that if primed by a prosocial stimulus about the intentions of other actors—that is, the redistribution of payouts by high-payout players—liberal-oriented individuals should be more likely to view these stimuli as positively valenced and to show a corresponding increase in prosocial behavior.
By comparison, the greater levels of amygdala activity observed in conservative individuals suggest that conservatives are more focused on threat-related outcomes. As a result, conservatives in general should be less likely than liberals to view stimuli as prosocial or positively valanced and less likely to update their behavior in response to the same stimuli. These conclusions are supported by the results of Mansell (Reference Mansell2018). Therefore, the expectation is that the decision by high-payout group members to redistribute the group’s payout will be viewed by liberal- but not conservative-oriented individuals as a signal of prosocial intention (Cacioppo et al., Reference Cacioppo, Cacioppo and Gollan2014; Schreiber et al., Reference Schreiber, Fonzo, Simmons, Dawes, Flagan, Fowler and Paulus2013).
H1: Treatment 4
* Compared with the control conditions, the contributions by liberals in the low-payout position will increase in response to a prosocial cue—the decision of other group members to redistribute the payout equally.
H2: Treatment 4
* In response to a prosocial cue—the decision of other group members to redistribute the payments equally—the contributions by liberals in the low-payout position will increase in comparison with conservatives in the low-payout position.
Hypothesis 3
The greater volume and activation of the amygdala in conservative individuals suggest that these individuals will be more likely to (1) characterize cues as negatively valenced (affectively negative) or (2) update or adjust their behavior or decision-making in response to new and negative information or negative emotion. As previously noted, the amygdala is an area of the brain linked to the processing of negative emotional stimuli as well as the identification of threat (Adolphs et al., Reference Adolphs, Tranel, Damasio and Damasio1995; Schreiber et al., Reference Schreiber, Fonzo, Simmons, Dawes, Flagan, Fowler and Paulus2013; van der Plas, et al., Reference van der Plas, Boes, Wemmie, Tranel and Nopoulos2010). On the basis of these characteristics, as well as previous research on the psychology associated with conservative-oriented individuals (Dodd et al., Reference Dodd, Balzer, Jacobs, Gruszczynski, Smith and Hibbing2012; Hibbing et al., Reference Hibbing, Smith and Alford2014; Jost et al., Reference Jost, Federico and Napier2009), the expectation is that the decision by high-payout players not to redistribute the inequality will constitute a negative or threatening signal about the self-interested intentions of these players. This condition is tested in Treatment 5, “Unfair Payout.”
H3: Treatment 5
* Compared with the control conditions, the contributions by conservatives in the low-payout position will decrease in response to a self-interested social cue—the decision of other group members not to redistribute the payouts.
No prediction is made about whether liberal-oriented individuals will show a decrease in contribution in response to a self-interested cue. Common sense expects that liberals will reduce their contributions in response to the decision not to redistribute resources (Johnson et al., Reference Johnson, Blumstein, Fowler and Haselton2013; McDermott et al., Reference McDermott, Fowler and Smirnov2008). Of interest to research on ideological differences is whether the decrease in contribution in conservatives exceeds the decrease of liberals. Observing this outcome would be meaningful for current discussions about the relationship between the structure of the ideological spectrum and the “negativity bias” (Hibbing et al., Reference Hibbing, Smith and Alford2014; Lilienfeld & Latzman, Reference Lilienfeld and Latzman2014).
Participants
A sample of n = 1,245 online U.S. participants was recruited from Amazon Mechanical Turk (MTurk). Participants were drawn from a larger sample of 4,000 MTurk participants who completed a 2-minute demographic survey prior to the study. Research from Berinksy et al. (2012) as well as a paper by Beramendi et al. (Reference Beramendi, Duch and Matsuo2014) show that the behavior of participants recruited from online study pools such as MTurk closely approximates the behavior of in-lab participants and that online and in-lab participants display similar behaviors in response to the same experimental task. A further study shows that ideological subjects from MTurk show “substantively identical” behavior to traditionally nationally representative samples (Clifford et al., Reference Clifford, Jewell and Waggoner2015, p. 1). As this study is interested in the dispositions of ideological subjects toward prosocial and self-interested cues, an online environment is an ideal location in which to conduct this study because it minimizes possible confounds related to face-to-face interactions, such as participants’ attractiveness, gender, ethnicity, or socialization prior to treatment.
Participants were paid ($0.10) for completing the short survey. Participants were recruited based on a self-reported liberal/conservative orientation using a 7-point Likert scale with the specific intention to avoid selecting participants with a self-reported neutral orientation. No deception was used during this study. In keeping with the strategy method (Brandts & Charness, Reference Brandts and Charness2011), participants were matched with participants based on actual responses during the study. All participants were made aware of this prior to the interaction. Participants also read a short statement about the norms against the use of deception in experimental research.
Experimental trials were completed over a four-month period between April and July 2015. A series of control questions were employed throughout the study to screen out participants who were not answering truthfully. Participants were also required to answer a series of questions to ensure that they correctly understood the experimental interaction. No participants in the sample were removed as a result of failing the control questions. Ethical approval for this research was obtained through the Central University Research Ethics Committee. No methods, measures, and exclusions are withheld in the reporting of this study.
Survey and demographic questions
The total sample is n = 1,245, with a mean age 35.74 (SD = 11.65) and a slight sex skew (male 50.68%). Sample size is based on a statistical power test using a two-sample, two-mean equality (1 – β = 0.80, α = 0.05). Tests indicated a minimum sample of n = 75 participants per treatment. The test is based on a mean of 10 units and assumes a 1.6 unit affect size, a standard deviation of 3.5 units, and a sampling ratio of 1. Effect size and standard deviation are estimated based on the result of a separate pilot study involving 60 participants. The information on these 60 participants is not included in the final study. Drawing on the seven treatments in this experiment, a base sample of N = 1,036 is required. A total of 1,600 participants of the 4,000 participants who completed the demographic pilot received an invitation to complete the study. Prior to the interaction, participants completed a 19-item demographic questionnaire, including age, education, ethnicity, income, religious affiliation, religious observance, political orientation, and a 10-factor personality model (Gosling et al., Reference Gosling, Rentfrow and Swann2003). Postinteraction, participants completed a 21-question Wilson-Patterson Index (Smith et al., Reference Smith, Oxley, Hibbing, Alford and Hibbing2011). Possible scores on the overall Wilson-Patterson Index range from –21 to +21. A score of –21 is strongly associated with a liberal orientation and a score of +21 with a conservative orientation (see the online appendix for correlations between Wilson-Patterson Index and self-reported ideological orientation). A 50-second delay separated the end of the comprehensive questions and the start of the experimental interaction. There was no delay between assignment to treatment and the start of the public goods game.
In the statistical analysis, ideological orientation is assessed using participants’ overall responses to the Wilson-Patterson Index (see the appendix). The Wilson-Patterson Index is one of the most commonly used measures of ideological orientation within social or political psychology (Smith et al., Reference Smith, Oxley, Hibbing, Alford and Hibbing2011). The Wilson-Patterson Index captures ideological orientation using specific political attitudes. This is appropriate as this study is primarily interested in understanding the structure of ideologies by observing behavioral differences associated with different ideological positions rather than the effectiveness of self-report measures for capturing ideologies. This approach has the additional benefit of avoiding potential confounding effects between ideological orientation and political identity, which may have been associated with the terms “liberal” and “conservative” in the American political context during the 2016 presidential election campaign (Ellis & Stimson, Reference Ellis, Stimson, Sniderman and Highton2011).
Scores on the Wilson-Patterson Index within this sample range from –19 to +16, with a mean score of –2.275. As this study is primarily interested in comparing how liberal and conservative ideological groups respond to social information, these responses were recoded (based on the mean value of responses) into three categorical variables, where –21 to –3 = 1 (liberal); –2 to +1 = 3 (neutral); and +2 to +21 = 2 (conservative). The asymmetric distribution of the categories is meant to code around the mean while ensuring a sufficient number of participants in the conservative category. The ideological breakdown of the full Wilson-Patterson model is liberal, n = 631; conservative, n = 416; neutral, n = 198. A regression model with an alternative coding is listed in the appendix (–21 to –2 = 1 [liberal], n = 667; –1 to +1 = 3 [neutral], n = 162; +2 to +21 = 2 [conservative], n = 416); the results of the model in the appendix are consistent with the findings of the model listed in the main text of this article.
An additional model in the appendix assesses ideological orientation based on individuals’ support for four sociopolitical issues related to inequality: (1) women’s equality, (2) social welfare, (3) tax cuts, and (4) foreign aid. Possible scores on this measure range from –4 to +4. Scores on the measure within the sample range from –4 to +3, with a mean score of –0.439. These responses were recoded into three categorical variables, where –4 to –2 = 1 (liberal), n = 296; –1 = 3 (neutral), n = 716; and 0 to 4 = 2 (conservative), n = 233. The inequality model is meant to capture the effect of general social inequality on individuals with a strong intolerance of inequality, a trait that strongly predicts liberal versus conservative ideological orientation (Jost, Reference Jost2009). As the results of this model are consistent with the predicted outcomes of the full Wilson-Patterson model, they are listed in the appendix.
As an additional robustness check, continuous models of both the full Wilson-Patterson and inequality models are also listed in the appendix. These results are consistent with both the categorical models. In generating the models, the coding of tax cut approval was reversed so that approval of tax cuts resulted in a score of 1 and disapproval a score of –1.
Statistical model
Results are modeled in Stata using standard ordinary least squares regression with robust confidence intervals. The dependent variable is the level of contribution, which ranges from 0 to 20, with 0 representing no contribution and 20 representing a full contribution to the public goods. In line with standard practice, treatment effects are calculated as a two-way interaction between treatment and ideological orientation (see Table 6). Treatment is coded 1–7, with Treatment 1, the control, coded as the reference category. Orientation is coded 0–2, with liberals coded as the reference category. In reporting the results, the discussion focuses on the effects in Treatments 1–5 that are the product of random assignment. Information about the outcomes in Treatments 6 and 7 is reported in the statistical tables. Both between-ideology and within-ideology effects are calculated for liberals, neutrals, and conservatives. This calculation is based on a linear combination of coefficients (lincom function) using a fitted model. This calculation allows for the measurement of effect sizes while accounting for any initial differences in contribution observed in the control groups.
In this context, within-ideology effects report the difference in the contribution for individuals with the same ideological orientation between control and treatment conditions. Between-ideology effects report differences in the contributions of individuals with different ideological orientations by looking at the change in contributions between the control and treatment, for each ideological group, and then comparing these differences. This approach is analogous to a difference-in-differences statistical model. Within-ideology effects are important for H1 and H2. Between-ideology effects are important for H2.
Experimental results
The experimental outcomes in this study are consistent with other public goods games (Fehr & Gachter, Reference Fehr and Gachter2000). Contributions range from 0 to 20, with the majority of participants contributing 0, 10, or 20 tokens. Generally, public goods have means of around 10 units; in the overall results of this study, the mean is 9 units and the median is 8 units (n = 1,245). In the control treatment (n = 178), the mean is 9.5 units and the median is 10 units.
Overall results
The results without differentiation by ideology are summarized in Table 3. Looking at each treatment, significant effects are observed in Treatment 5, in which overall levels of contribution are lower in comparison with the control (T5, coeff. = –2.607, SD = 0.715, p < .00). This indicates that in response to information that high-payout players are not redistributing the payouts, low-payout participants significantly decrease their contributions relative to the control. In Treatment 4, “Fair Payout,” levels of contribution show a positive trend relative to the control; however, this effect fails to reach significance.
Looking at the combined treatment pairs (Table 3), no difference in contribution is observed in Treatments 2 and 3, indicating that the effect of a general inequality is not significant on participants’ contributions. A significant positive effect is observed in Treatments 4 and 6, “Fair Payout” and “Redistribution” (T4 and T6, coeff. = 1.333, SD = 0.637, p < .033), and a significant negative effect is observed in Treatments 5 and 7, “Unfair Payout” and “No Redistribution” (T5 and 7, coeff. = –3.052, SD = 0.637, p < .001).
Table 3. Linear regression of the overall effect of treatment on contribution.

† p < .10;
** p < .05;
*** p < .001.
Expectations 1 and 2
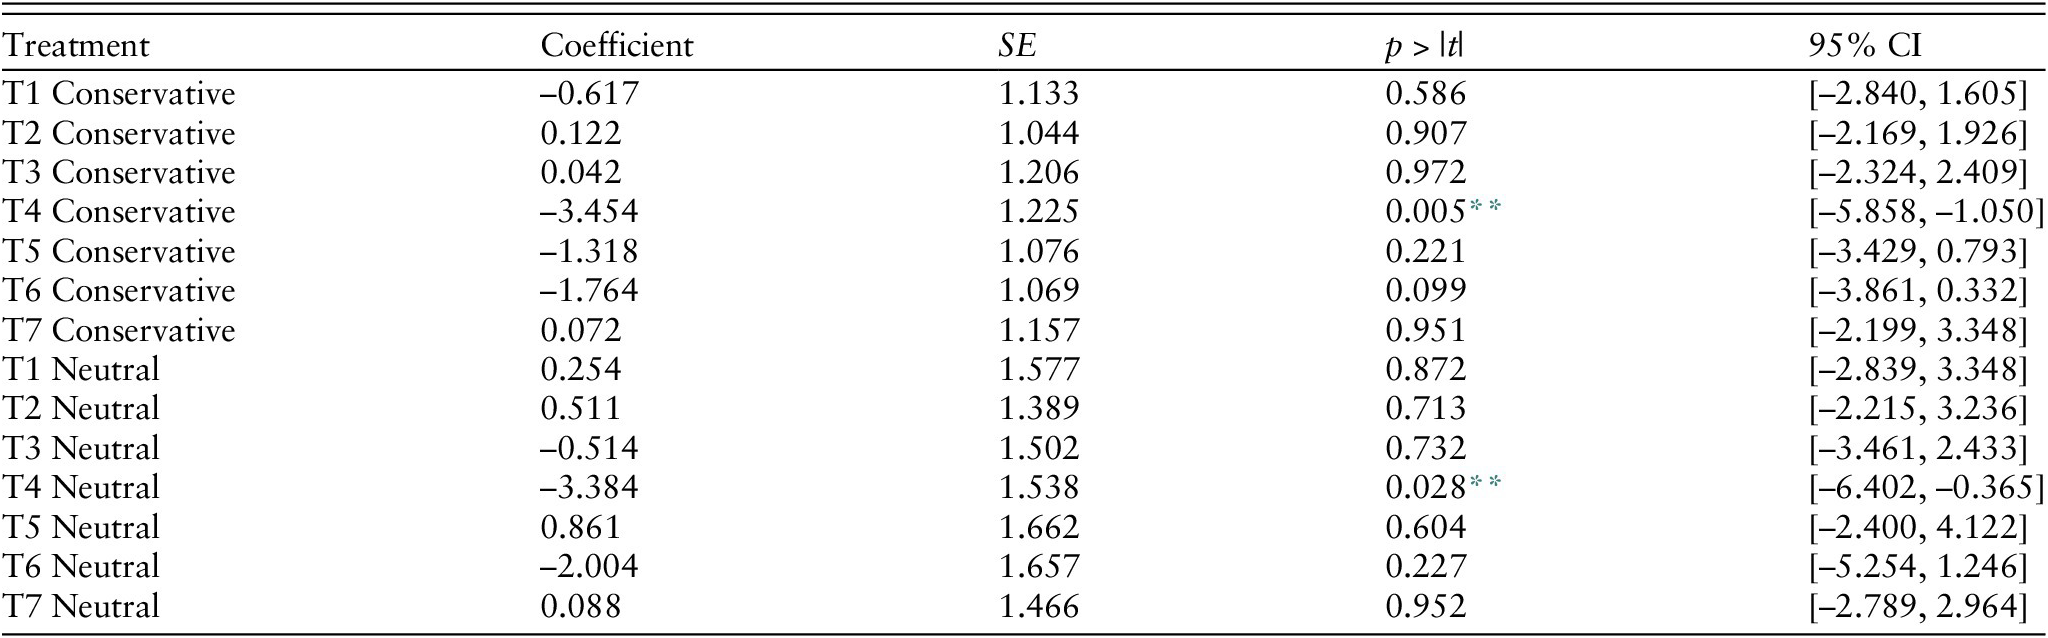
Looking at the results with differentiation by ideology (Table 4), no significant differences are observed in the contributions of liberals and conservatives in Treatment 2, “High Payout,” or Treatment 3, “Low Payout,” relative to the control. Beginning with the between-ideology effects (Table 5 and Figure 1), the difference in contributions between liberals and conservative in Treatment 2 and Treatment 3 is negligible (T2, coeff. = 0.122, SD = 1.044, p < .907; T3, coeff. = 0.042, SD = 1.206, p < .972). Similarly, looking at the within-ideology effects (Table 6 and Figures 2 and 3), there is no difference in contributions between Treatments 2 and 3 and the control among liberals (T2, coeff. = –0.225, SD = 1.023, p < .826; T3, coeff. = –1.163, SD = 1.034, p < .261) or conservatives; (T2, coeff. = 0.271, SD =1.151; p < .814; T3, coeff. = –0.504, SD = 1.292, p < .697). Consequently, as expected, the contributions of neither liberal- nor conservative-oriented individuals are affected by a general intragroup inequality.

Figure 1. Between-Ideology Effects.
Table 4. Linear regression of the effect of a two-way interaction between treatment and liberal/conservative ideology based on score on the full Wilson-Patterson Scale.

† p < .10;
** p < .05;
*** p < .001.
Hypotheses 1 and 2
As predicted in H1, in Treatment 4, “Fair Pay,” in response to the redistribution of their payout, contributions by liberals significantly increase relative to the control (T4, coeff. = 2.640, SD = 1.040, p < .011) (Table 6 and Figure 2). This effect is not observed in conservatives (T4, coeff. = –0.197, SD = 1.305, p < .880) (Table 6 and Figure 3). Furthermore, as predicted in H2, in Treatment 4, the difference in contributions between liberals and conservatives is also significant, with conservatives showing significantly lower levels of contribution compared with liberals (T4, coeff. = –3.454, SD = 1.225, p < .005) (Table 5). Consequently, for H1 and H2, this study rejects the null; in response to a positive cue—information that high-payout members of their group are redistributing the payouts equally—the contributions of liberals significantly increase relative to the control, while the contributions of conservatives stay unchanged.
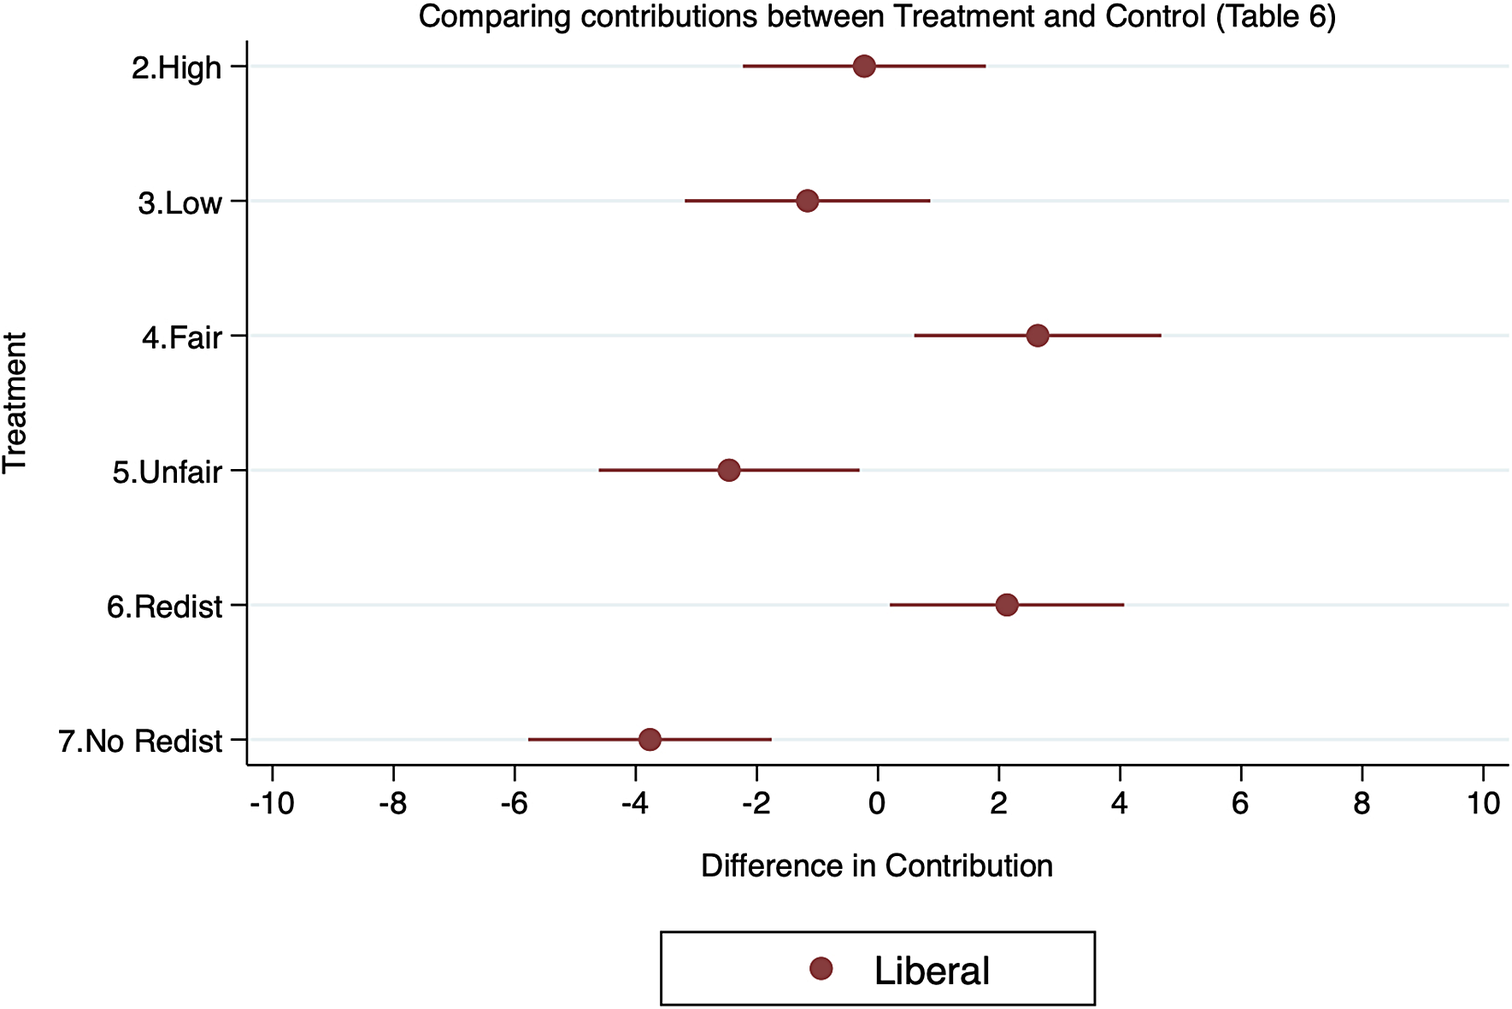
Figure 2. Liberal Within-Ideology Effects.

Figure 3. Conservative Within-Ideology Effects.
Table 5. Between-ideology effects, linear regression of the effect of treatment on contribution (orientation based on the full Wilson-Patterson Scale).
† p < .10;
** p < .05;
*** p < .001.
Table 6. Within-ideology effects (orientation based on the full Wilson-Patterson scale).

† p < .10;
** p < .05;
*** p < .001.
Hypothesis 3
As predicted, in Treatment 5, “Unfair Pay,” in response to the knowledge that their pay is not redistributed, the contributions of conservatives significantly decrease relative to the control (T5, coeff. = –3.158, SD = 1.111, p < .005) (Table 6 and Figure 3). Consequently, for H3, this study rejects the null; the contributions of conservative-oriented individuals in the public goods game decrease in response to a negative social cue. Importantly, in Treatment 5, contributions by liberals also significantly decrease relative to the control (T5, coeff. = –2.458, SD = 1.098, p < .025) (Table 6 and Figure 2). Furthermore, the difference between these effects is not significant, indicating that liberals and conservatives responded similarly to a negative social cue (T5, coeff. = –1.318, SD = 1.076, p < .221) (Table 5 and Figure 1). Addressed further in the discussion sections, the fact that liberals and conservatives respond similarly to a negative cue has implications for future research on the relationship between ideology and the negativity bias.
The decision to redistribute
Looking at the decision to redistribute the group’s payouts, Table 7 shows the difference in predicted probability to redistribute or not to redistribute the payouts (0 = yes, redistribute; 1 = no, do not redistribute). The results show no significant differences between the probability of liberals and conservatives redistributing the payouts. Between liberals and neutrals, neutrals are significantly more likely not to redistribute payments than liberals (coeff. = 0.668, SD = 0.334, p < .039).
Table 7. Logistic regression comparing the probability of voting to redistribute payouts between liberals, neutrals, and conservatives (orientation based on the full Wilson-Patterson scale).

Notes: 0 = redistribute, 1 = not to redistribute. Liberals are coded as the reference category.
† p < .100;
** p < .05;
*** p < .001.
Discussion
This article investigates whether the dispositions associated with liberal and conservative ideological orientations have a differential effect on social behavior in response to different levels of inequality and in response to how others address inequality. Drawing from research in neuroscience and psychology on the cognitive differences between ideological subjects, this article hypothesized that in response to a positive “prosocial” cue, liberals, but not conservatives, would increase their contributions. Overall, the results are consistent with the predicted outcomes. As expected, neither liberals nor conservatives show differences in contributions in response to a general and randomly distributed inequality. However, in response to the knowledge that group members voted to redress the inequality, levels of contribution in liberals significantly increased in comparison to the control. This was not true for conservatives.
Because of the use of an online sample, some caution is required when generalizing these findings. By relying on an online sample, this study may be underrepresenting conservative-oriented individuals, who, as a consequence of their dispositions, may be less likely to participate in online research. Potentially, this could bias the results if these individuals are more likely to increase their contributions in response to the positive cue in Treatment 4. Currently, this conclusion is not supported by the literature on ideological dispositions, which suggests the opposite trend may occur. However, it is important that this possibility is given consideration in future research.
As a whole, this study makes several small but important contributions to research into the psychological motivations underlying ideological differences. First, the finding that liberals, but not conservatives, increase their contributions in response to a prosocial cue provides empirical, and sociopolitically relevant, evidence that ideological orientation is linked to differences in cognition, including dispositions toward different types of socioenvironmental stimuli (Cacioppo et al., Reference Cacioppo, Cacioppo and Gollan2014; Hibbing et al., Reference Hibbing, Smith and Alford2014; Jost & Amodio Reference Jost and Amodio2012; Kanai et al., Reference Kanai, Feilden, Firth and Rees2011; Schreiber et al., Reference Schreiber, Fonzo, Simmons, Dawes, Flagan, Fowler and Paulus2013). This finding suggests that differences in ideological orientation are not, at least not exclusively, a consequence of threat sensitivity in conservative-oriented individuals (Lilienfeld & Latzman, Reference Lilienfeld and Latzman2014). Rather, liberals and conservatives appear to prioritize or respond to different sets of environmental stimuli. This finding suggests that understanding the differences in political preferences and behaviors between liberals and conservatives may require understanding the causes of individual-level variation in social cognition and decision-making. Besides contextualizing the differences in behavior, the variation in the sensitivity to environmental stimuli may provide a proximate mechanism, via the differential processing and reception of information, to explain how an individual’s socioenvironmental experiences develop into political attitudes. For example, liberals’ greater sensitivity to prosocial cues may help explain the development of negative attitudes toward inequality. Similarly, the lack of such a sensitivity in conservatives, in combination with the differential sensitivity to threat, may help explain the greater tolerance of inequality or increased emphasis on meritocracy.
One consideration not addressed in this study is how best to understand the cognitive variations associated with liberal and conservative ideological differences. Are these variations the result of random chance, concomitants of habitualization, from individuals’ life experiences? Or does the variation in traits reflect a deeper operative function? (Cacioppo et al., Reference Cacioppo, Cacioppo and Gollan2014, p. 309; Hibbing et al., Reference Hibbing, Smith and Alford2014; Jost, Reference Jost2009; Petersen & Aarøe, Reference Petersen and Aarøe2014). Within the life sciences, the heritability of a trait is, under certain conditions, an indication that a trait has been selected for on the basis of its contribution to fitness (Grafen, Reference Grafen1984; Tooby & Cosmides, Reference Tooby and Cosmides1990). For example, the different dispositions may reflect alternative strategies for environmental interaction. Viewed within this framework, the heritability of ideological attitudes and values, or their associated dispositions—leading to differences in how individuals experience or process the conditions of their surrounding environment—may reflect a set of adaptive characteristics to a set of historical environmental problems (Gintis et al., Reference Gintis, Smith and Bowles2001; Petersen, Reference Petersen, Peterson and Somit2017; Tooby et al., Reference Tooby, Cosmides and Price2006; Van Vugt & Van Lange, Reference Van Vugt, Van Lange, Schaller, Kenrick and Simpson2006). For example, Petersen and Aarøe (Reference Petersen and Aarøe2014) suggest that the increased sensitivity to negativity, or “negativity bias,” in conservative individuals may be consistent with an approach to environmental experiences such as adaptive error management. By observing the effect on social behavior, this research has contributed indirectly to the question of how best to understand the cognitive variations underlying ideological differences; however, given the growing literature linking ideology to variations in cognition, physiology, and genetics, future studies in political science must investigate the “functional” causes of these variations. Ultimately, understanding how and why differences in individual traits influence social behavior, and potentially social preferences such as attitudes and values, may provide crucial insight into understanding the basis of ideological differences (Cacioppo et al., Reference Cacioppo, Cacioppo and Gollan2014, p. 309; Hibbing et al., Reference Hibbing, Smith and Alford2014; Jost, Reference Jost2009; Petersen & Aarøe, Reference Petersen and Aarøe2014).
Supplementary Materials
To view supplementary material for this article, please visit http://dx.doi.org/10.1017/pls.2019.24.


