INTRODUCTION
Otoliths are natural data loggers that record and store information on their microstructure at different spatiotemporal scales of growth and habitat interactions for fish (Kalish, Reference Kalish1989; Campana, Reference Campana1999; Berg et al., Reference Berg, Sarvas, Harbitz, Fevolden and Salberg2005). Otoliths provide information on growth, movement patterns and habitat interactions, which is essential in fisheries management. Age and growth information provides an integrated evaluation of environmental and endogenous conditions affecting a fish (Dervies & Frie, Reference Dervies, Frie, Murphy and Willis1996). Otolith microincrements have been used to estimate the age of larval and juvenile fish (Jones, Reference Jones, Stevenson and Campana1992; Campana, Reference Campana2001).
Shallow waters are suitable as shelters and foraging sites for juvenile fish and as spawning grounds for adult fish (Ayvazian et al., Reference Ayvazian, Deegan and Finn1992). The survival of fish during early life stages have been estimated as a probable source of variability in recruitment to adult stocks (Hjort, Reference Hjort1914). In this period, survival rates are very low and it is very difficult to estimate catchable stock size. Young of the year (YOY) who survive early life stages are the most likely to recruit into the stock. It is essential to monitor growth and mortality rates of YOY in order to ensure ecologically and economically sustainable fishing.
The striped sea bream, Lithognathus mormyrus (Linnaeus, 1758) is a protandric hermaphrodite fish species belonging to the Sparidae family (Bessau, 1990; Besseau & Bruslesicard, 1991, 1995) It is a demersal fish species living in groups over various types of sea bottoms, especially sand, rocks and seagrass beds, at depths ranging from 0 to 150 m (Bauchot & Hureau, Reference Bauchot, Hureau, Whitehead, Bauchot, Hureau, Nielsen and Tortonese1986, Reference Bauchot, Hureau, Quero, Hureau, Karrer, Post and Saldanha1990). This species is distributed in the eastern Atlantic (from the Bay of Biscay to the Cape of Good Hope, and around the Canaries and Cape Verde) and the western Indian Ocean (from southern Mozambique to the Cape of Good Hope). It is also present in the Mediterranean, Black, Azov and Red Seas (Bauchot & Hureau, Reference Bauchot, Hureau, Whitehead, Bauchot, Hureau, Nielsen and Tortonese1986, Reference Bauchot, Hureau, Quero, Hureau, Karrer, Post and Saldanha1990; Harmelin-Vivien et al., Reference Harmelin-Vivien, Harmelin and Leboulleux1995).
The main spawning period of the striped sea bream from the Thracian Sea is between May and September, with a peak in June, July and August (Kallianiotis et al., Reference Kallianiotis, Torre and Argyri2005). These results are in agreement with studies on striped sea bream on the Spanish Mediterranean coast (Suau, Reference Suau1970). Maximum gonad activity has been reported by Lorenzo et al. (Reference Lorenzo, Pajuelo, Mendez-Villamil, Coca and Ramos2002) in the central east Atlantic between August and September. In the Canaries archipelago, the spawning season of the striped seabream extends from June to November, with maximal gonadal activity occurring in August and September (Pajuelo et al., Reference Pajuelo, Lorenzo, Mendez, Coca and Ramos2002).
Striped sea bream (Sparidae) are commercially valuable and an important catch for the coastal and lagoon fisheries in Turkey (Emre et al., Reference Emre, Balik, Sumer, Oskay and Yesilcimen2010). This species has high commercial value, with commercial landings reaching 113.4 t in 2012, representing about 39.9% of total landings of striped sea bream from the Canakkale Strait (Tüik, 2012). Along the Turkish coasts, the striped sea bream is mainly caught by trammel nets, gill nets and longlines. In spite of its importance for the fisheries, the population dynamics of this species has never been described for the Canakkale Strait, Turkey.
Some biological aspects of adult L. mormyrus have been studied, such as age, growth, reproduction and mortality, in the northern and middle Adriatic Sea (Kraljevic et al., Reference Kraljevic, Dulcic, Pallaoro, Cetinic and Jugdujakovic1995, Reference Kraljevic, Dulcic, Cetinic and Pallaoro1996), in the Thracian Sea (Kallianiotis et al., Reference Kallianiotis, Torre and Argyri2005), in eastern Spanish coastal waters (Suau, Reference Suau1970), in the central–eastern Atlantic (Lorenzo et al., Reference Lorenzo, Pajuelo, Mendez-Villamil, Coca and Ramos2002, Pajuelo et al., Reference Pajuelo, Lorenzo, Mendez, Coca and Ramos2002), on Sicilian coasts (Vitale et al., Reference Vitale, Arkhipkin, Cannizzaro and Scalisi2011), in southern Portuguese coastal waters (Abecasis et al., Reference Abecasis, Bentes, Coelho, Correia, Lino, Monteiro, Gonçalves, Ribeiro and Erzini K.2008, Monteiro et al., Reference Monteiro, Bentes, Coelho, Correira, Erzini, Lino, Ribeiro and Gonçalves2010), in the Beymelek Lagoon (Emre et al., Reference Emre, Balik, Sumer, Oskay and Yesilcimen2010) and in Iskenderun Bay (Türkmen & Akyurt, Reference Türkmen and Akyurt2003). Growth of juvenile striped sea bream on the Croatian Adriatic coast has been studied by assuming the hatching date as 1 July, and age in months was determined as the difference between the date of capture and the birth date (Matic-Skoko et al., Reference Matic-Skoko, Ferri, Kraljevic and Dulcic2007). However, using an assumed hatching date may not provide accurate individual growth rate.
Therefore, the aim of this paper is to estimate the growth, mortality and hatching periods of the striped sea bream from Canakkale Strait, Turkey, using daily growth increments counts on sagittal otoliths. Seasonal changes in growth rates and the correlation between somatic growth and otolith growth will also be investigated.
MATERIALS AND METHODS
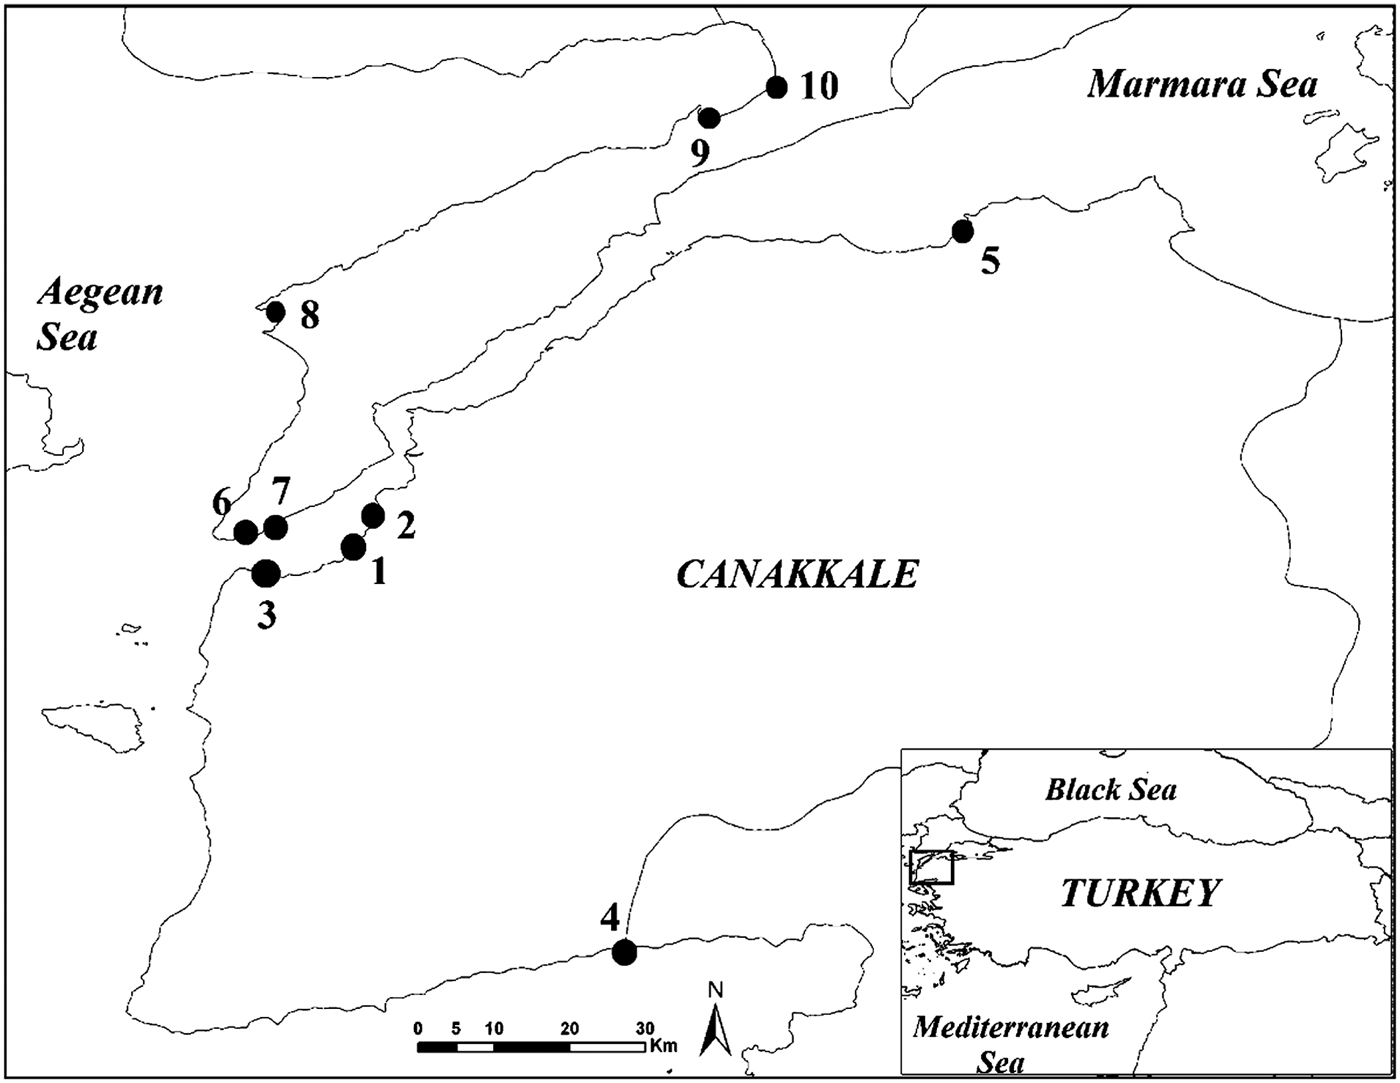
Fish were obtained from a survey originally designed to collect juvenile fish from nursery habitats of shallow waters (<2 m) in the Marmara Sea, the Dardanelles Strait and the northern Aegean Sea between September 2006 and December 2007 (Figure 1). All samples were collected in the daytime with a beach seine with a total wing length of 32 m, a height of 2 m and a 2 m long bag, with 13 mm mesh at the wings and 5 mm mesh at the bag. The hauls were made parallel to the shore, twice, haphazardly and non-overlapping. The surface water temperature was measured with a Hach Lange HQ40d probe during samplings.

Fig. 1. Map of Canakkale coastline showing sampling stations of young of the year striped sea bream.
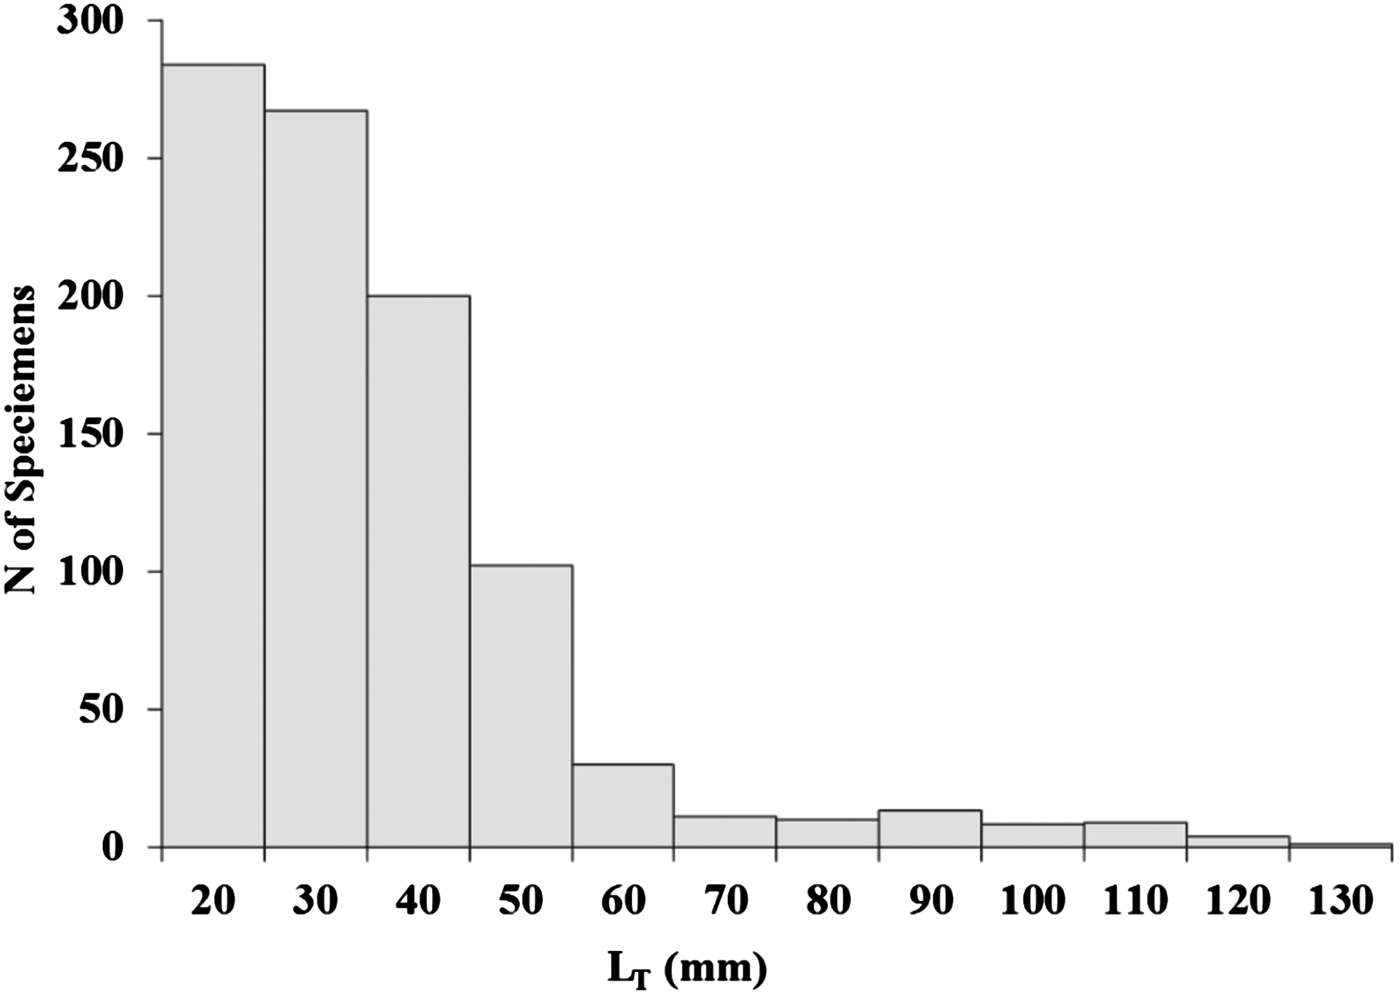
A total of 938 YOY striped sea bream, L. mormyrus, ranging from 20 to 139 mm in total length (LT) were collected during the 16 months in Canakkale shallow waters (Figure 2). Fish were killed with an overdose of quinaldine and stored in 70% alcohol. Total length (LT) of the collected YOY striped sea bream was measured to the nearest 0.1 mm below and weighed to the nearest 0.01 g below. A total of 463 pairs of otoliths were removed, cleaned of adhering tissue, dried and stored in clean micro vials. From each pair, one otolith was randomly selected and mounted on glass slides with thermoplastic cement. Each otolith was polished with a series of abrasive papers of decreasing roughness, from 12 µm, to 9 µm, to 3 µm and finishing with 0.3 µm alumina paste on a polishing cloth, until daily rings were discernible from the centre to the edge (Miller & Storck, Reference Miller and Storck1982; Secor et al., Reference Secor, Dean and Laban1991; Jones, Reference Jones, Stevenson and Campana1992; Hayes, Reference Hayes1995). The process was checked frequently under a light microscope to avoid over-polishing the centre. An experienced reader counted the rings twice to ensure robustness of the analysis. Ring counts were done using a light microscope at 20 × , 40× or 100× magnifications.

Fig. 2. Length–frequency distribution of young of the year striped seabream collected in the Canakkale shallow waters during the whole sampling period (September 2006 to December 2007). N = 938.
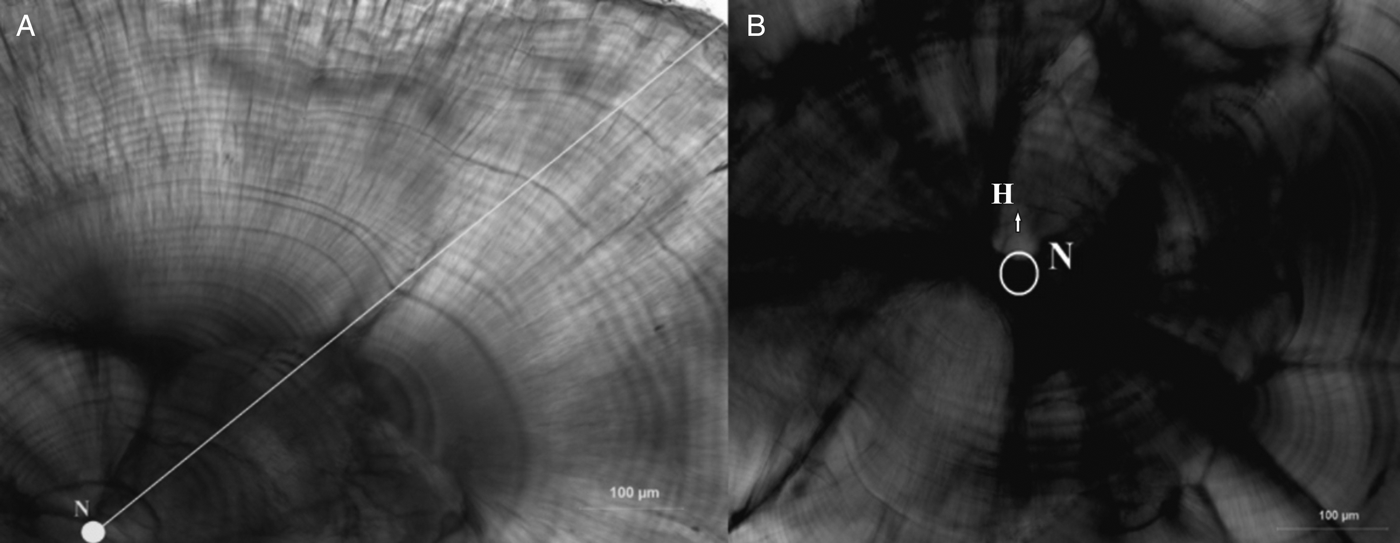
Age was determined by counting the number of increments from a more prominent dark ring near the nucleus; this was assumed as the hatching check (Figure 3B) and increments were assumed to be formed daily. Although daily ring formation has not been validated for L. mormyrus, it has been widely demonstrated for many fish species (Pannella, Reference Pannella1971; Campana & Neilson, Reference Campana and Neilson1985). All increment counts could not take place along the same axis, but most of them took place in the dorso-posterior axis of the otolith (Figure 3A).

Fig. 3. Polished sagittal otolith of 39 mm LT young of the year striped seabream aged 58 d; (A) growth increment counts were made from N (nucleus) to dorso-posterior axis (arrow); (B) circle shows nucleus and H is hatching check (arrow).
Otolith length (OL), width (OW) and radius (OR) were measured to the nearest 0.001 mm below using Q Capture Imaging Software. OL was defined as the longest axis between the anterior and the posterior otolith edge and OW as the distance from the dorsal to the ventral edge taken perpendicular to the length through the otolith focus. OR was measured as the longest axis between the nucleus and the posterior edge. The relationship between somatic growth and otolith growth was investigated by linear regression.
The relationship between fish size (LT) and age (d) was assessed by linear regression, which corresponds to an average growth rate (mm d−1). In order to determine seasonal changes of somatic growth rates, aged fish were grouped into cohorts based on hatch date. The significance of differences in growth equations among seasons was tested by analysis of covariance (ANCOVA).
For determination of the instantaneous mortality coefficient (Z), fish size was converted to age (d) according to the length–age relationships. Juvenile abundance was grouped into 5 d intervals. Estimates of Z were obtained using the age-based catch curve method of Ricker (Reference Ricker1975). A linear regression analysis was computed to the ln-transformed data set, and the slopes of regression lines represented the instantaneous mortality coefficients. Daily mortality percentages (D M) were expressed as:
The weight specific growth coefficient (G T) was estimated as (Houde & Zastrow, Reference Houde and Zastrow1993):
where WT is the weight (g) at time t (d), W0 is the weight of juveniles in the previous age group in consideration, and G T is the weight-specific growth coefficient. Changes in the M: G T ratio have been suggested as a predictor of whether or not a cohort is increasing its biomass (Houde, Reference Houde, Watanabe, Yamashita and Oozeki1996, Reference Houde1997), where M is the instantaneous mortality rate and G T is the weight-specific growth coefficient.
Hatch date distributions were back-calculated by subtracting the number of rings from the date of capture and plotting monthly intervals.
RESULTS
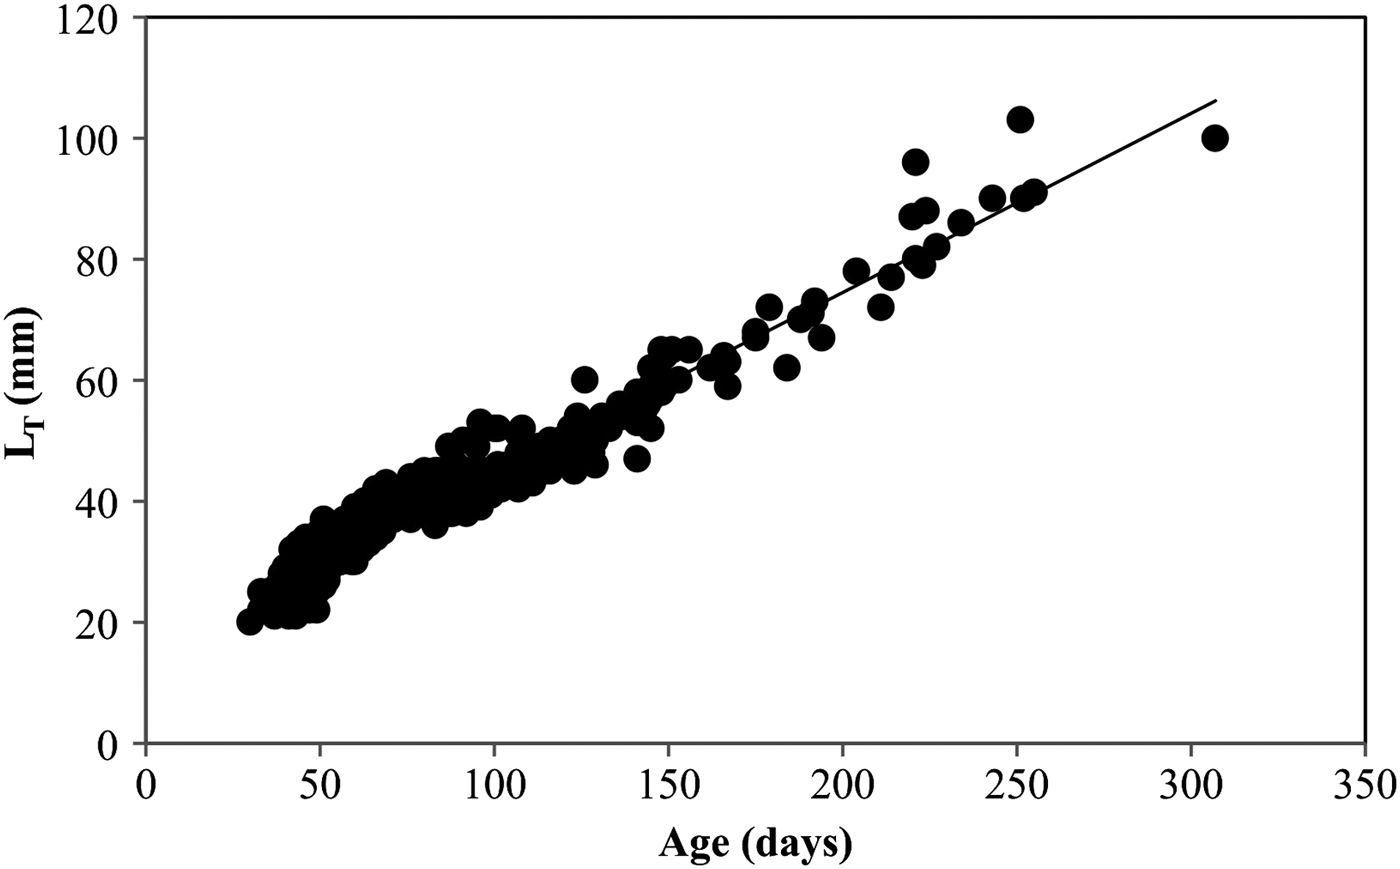
A total of 416 specimens ranging from 20 to 103 mm LT were aged, and age estimates ranged from 30 to 307 d (Table 1; Figure 3). The youngest fish (30 d) collected was 20 mm LT and caught in August, while the oldest YOY (307 d) was 100 mm LT and caught in July. The age group 40–59 d (20–39 mm) was the dominant age group (39.9%). Specimens of age groups 260–279 d and 280–299 d were absent. The first ring was observed at mean 14.39 μm (SE ± 0.408) from the core and it was assumed to be the hatching check (Figure 3B).

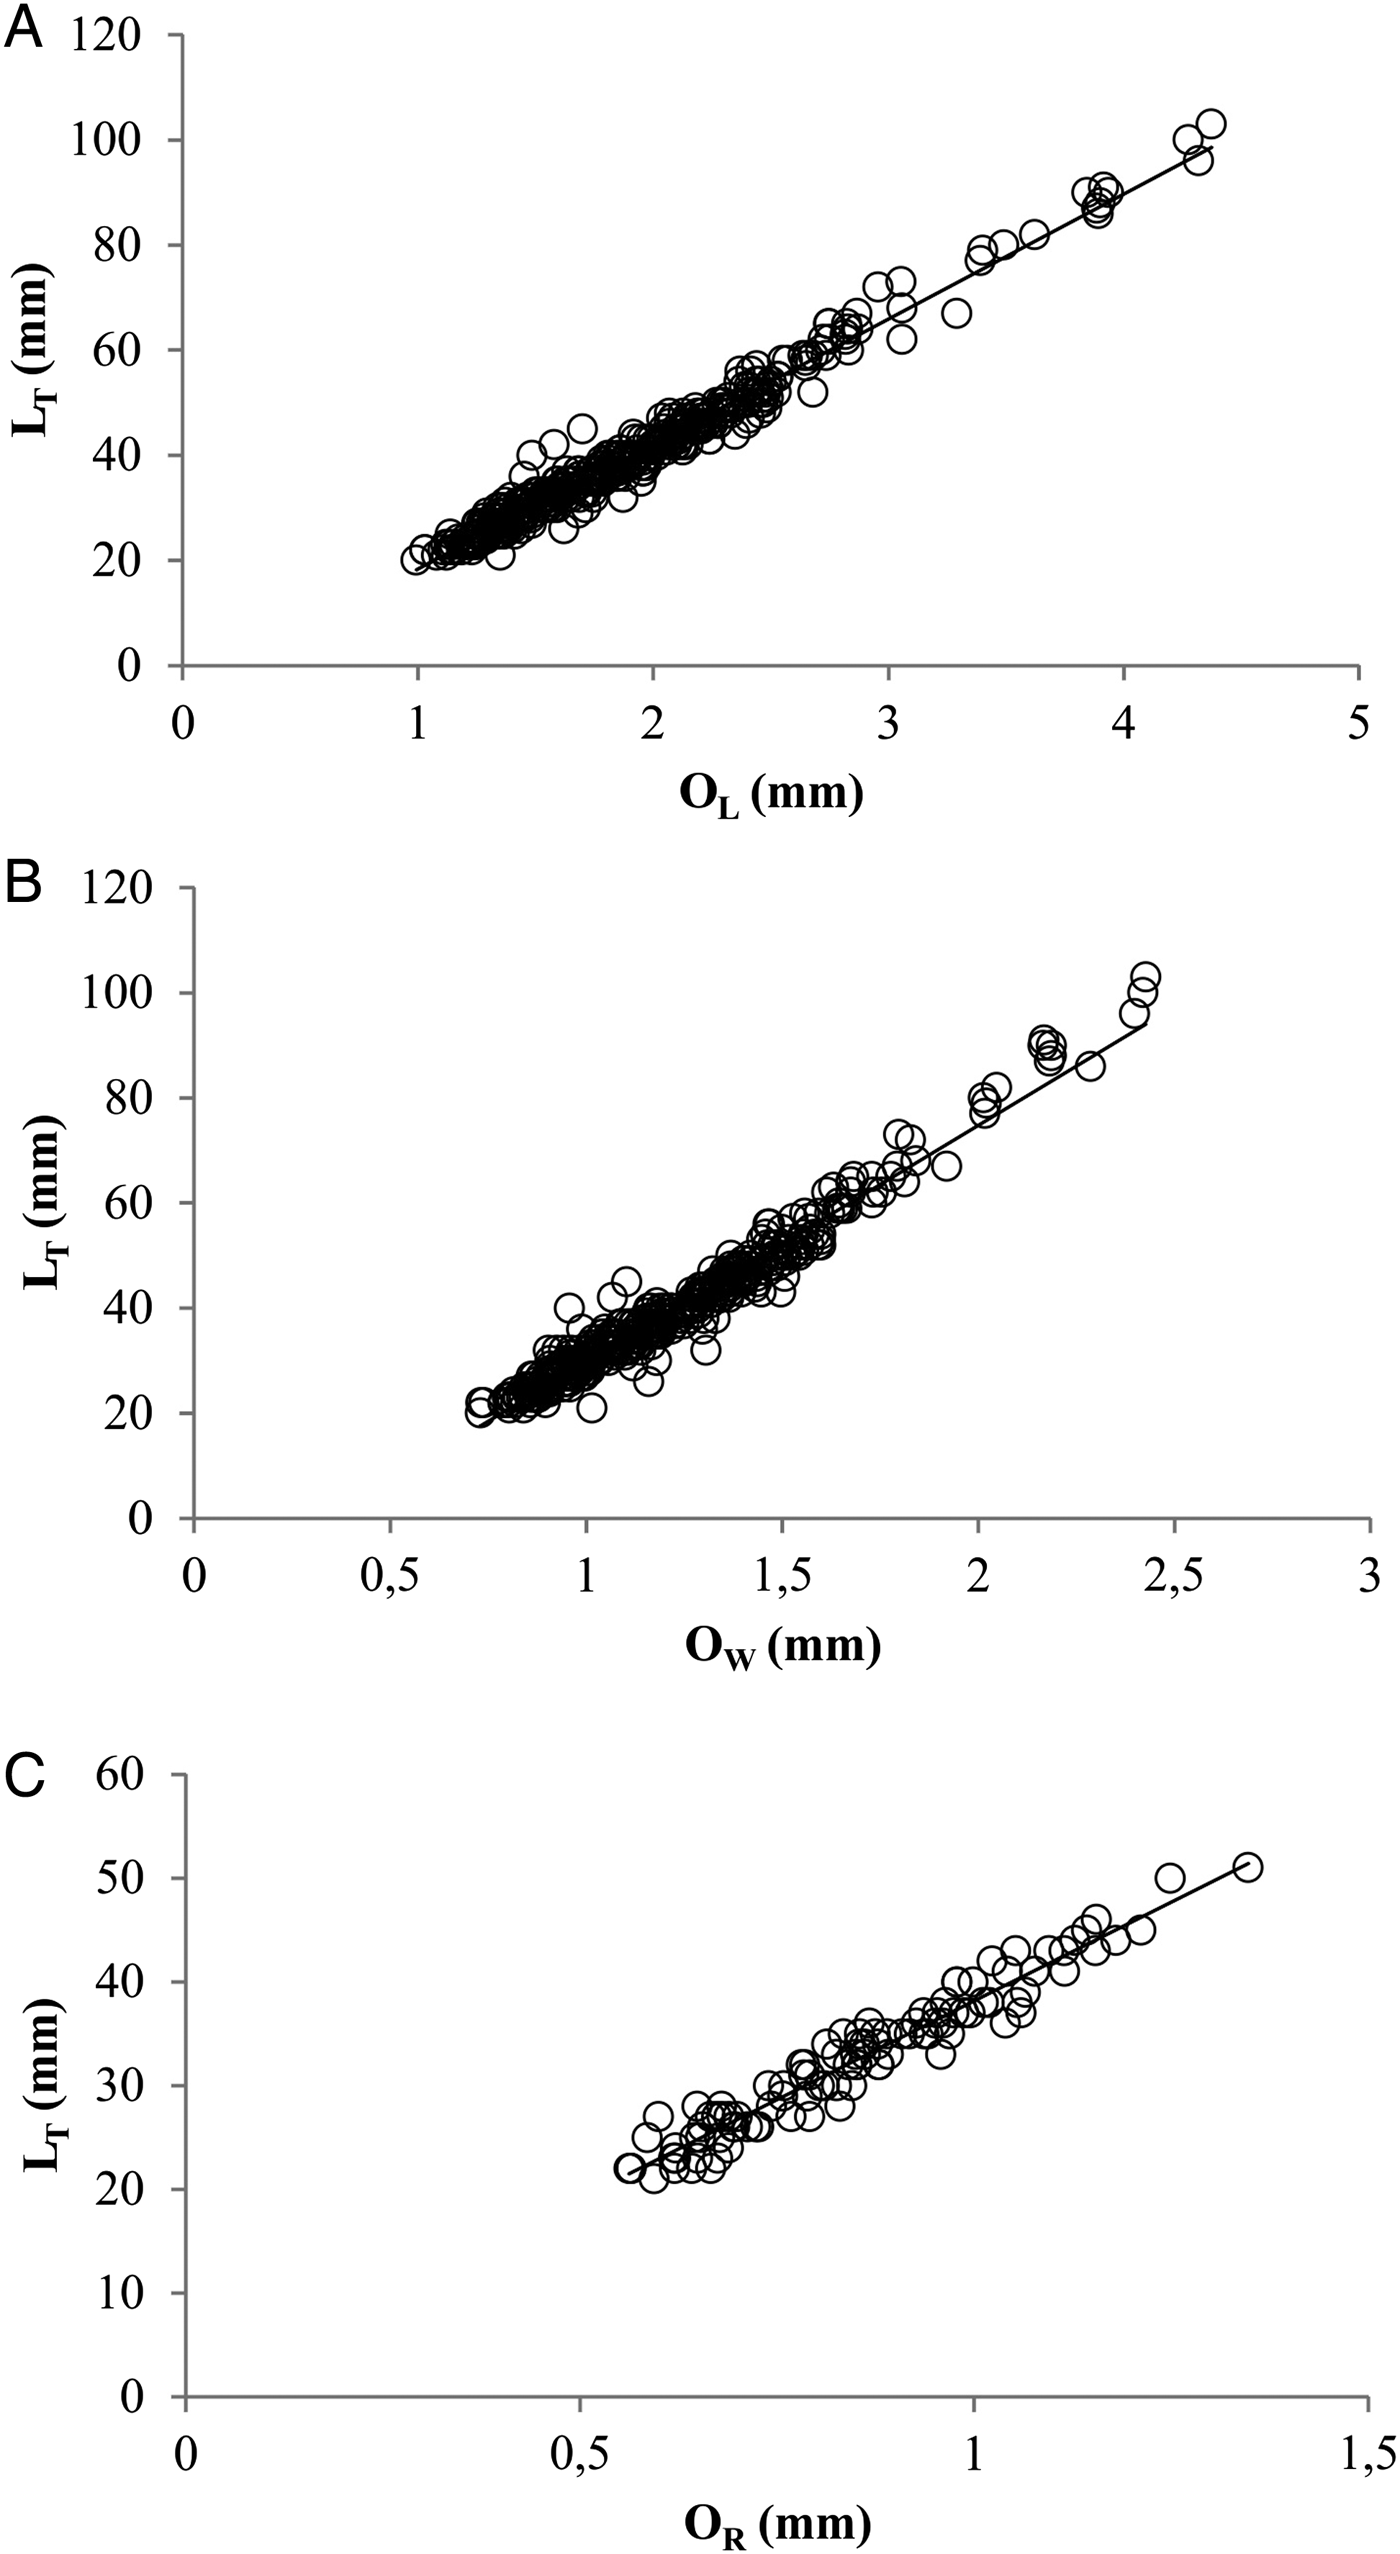
Fig. 4. Linear relationships between LT (mm) and otolith length, OL (A), otolith width, OW (B) and otolith radius, OR (C), of young of the year Lithognathus mormyrus.
Table 1. Age–length key for young of the year Lithognathus mormyrus. N, total number of specimens per length/age group.

The different otolith length measurements (OL, OW, OR) showed significant linear relationships with the fish length (LT) (Figure 4; Table 2).
Table 2. Parameters of the otolith length measurements (otolith length, OL; otolith width, OW; otolith radius, OR) linear relationships with the fish length (LT) of striped seabream from Canakkale Strait, Turkey. N is the number of specimens, a is the slope of the regression line, b is y-intercept and R2 is the coefficient of determination.

The growth rate of YOY striped sea bream was estimated by fitting a linear regression to the whole age–length data set (Figure 5). Length–age regression analysis resulted in growth rates of 0.325 mm d−1. To test for seasonal changes in the growth rate of YOY striped sea bream, linear regressions were fitted to age–length data for larvae hatched during each of the four seasons, as defined by the hatch distribution.

Fig. 5. Age–length relationship estimated for YOY Lithognathus mormyrus collected in the shallow waters of Canakkale Strait, Turkey.
According to the length–age regression analysis, maximum growth rates (G) were found 0.416 mm d−1 in the summer hatched cohort and minimum values of 0.312 mm d−1 were observed in the winter hatched cohort (Table 3). ANCOVA indicated that there was significant difference between the seasons (P < 0.001).
Table 3. Parameters of the length-at-age linear relationships for different seasons of striped seabream in Canakkale Strait, Turkey. N is the number of speciemens, a is the slope of the regression line, b is y-intercept and R 2 is the coefficient of determination.

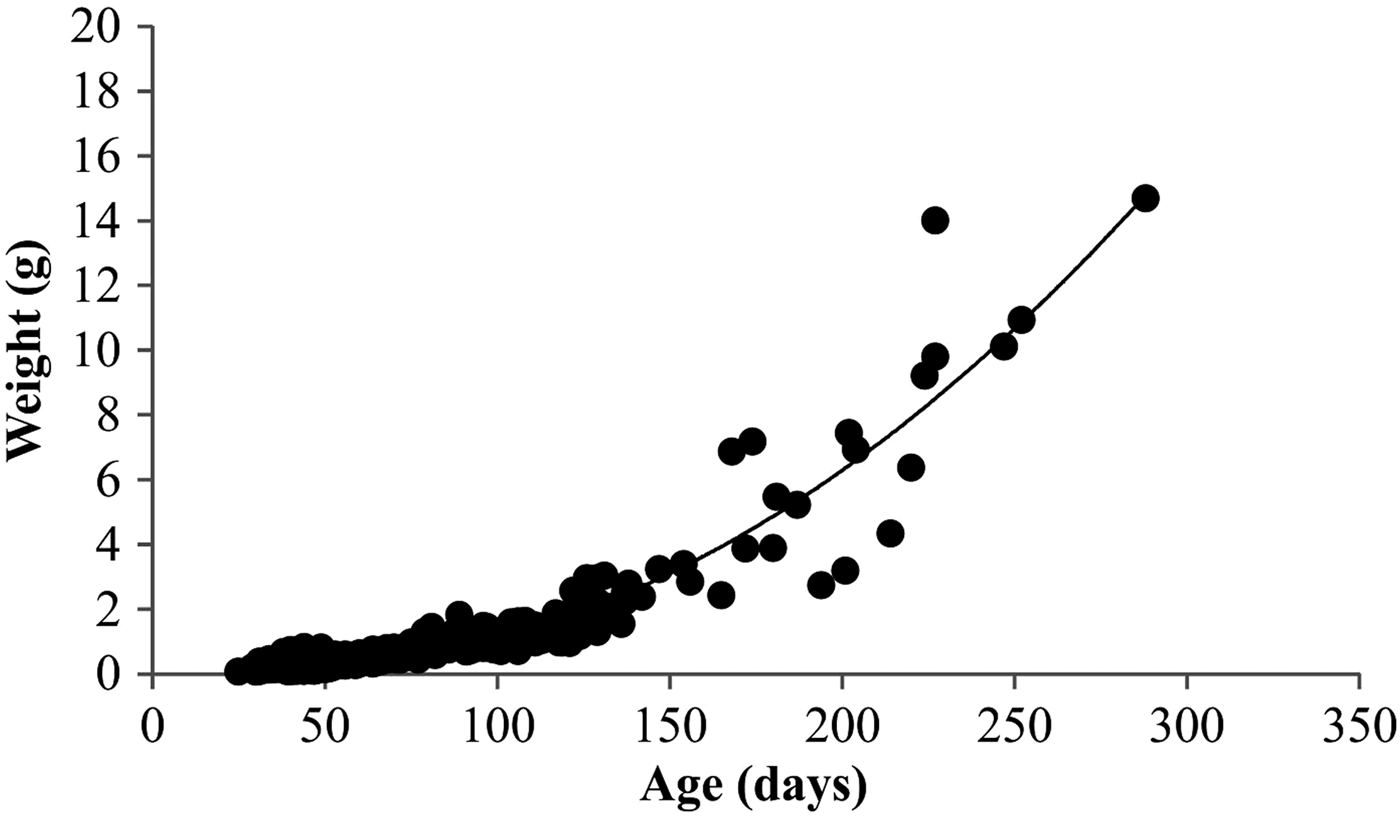
Relationships between YOY body weight (g) and age (da) were expressed as (Figure 6): W = 0.0989e0.0222.

Fig. 6. Relationships of estimated age (d) and body weight (g).
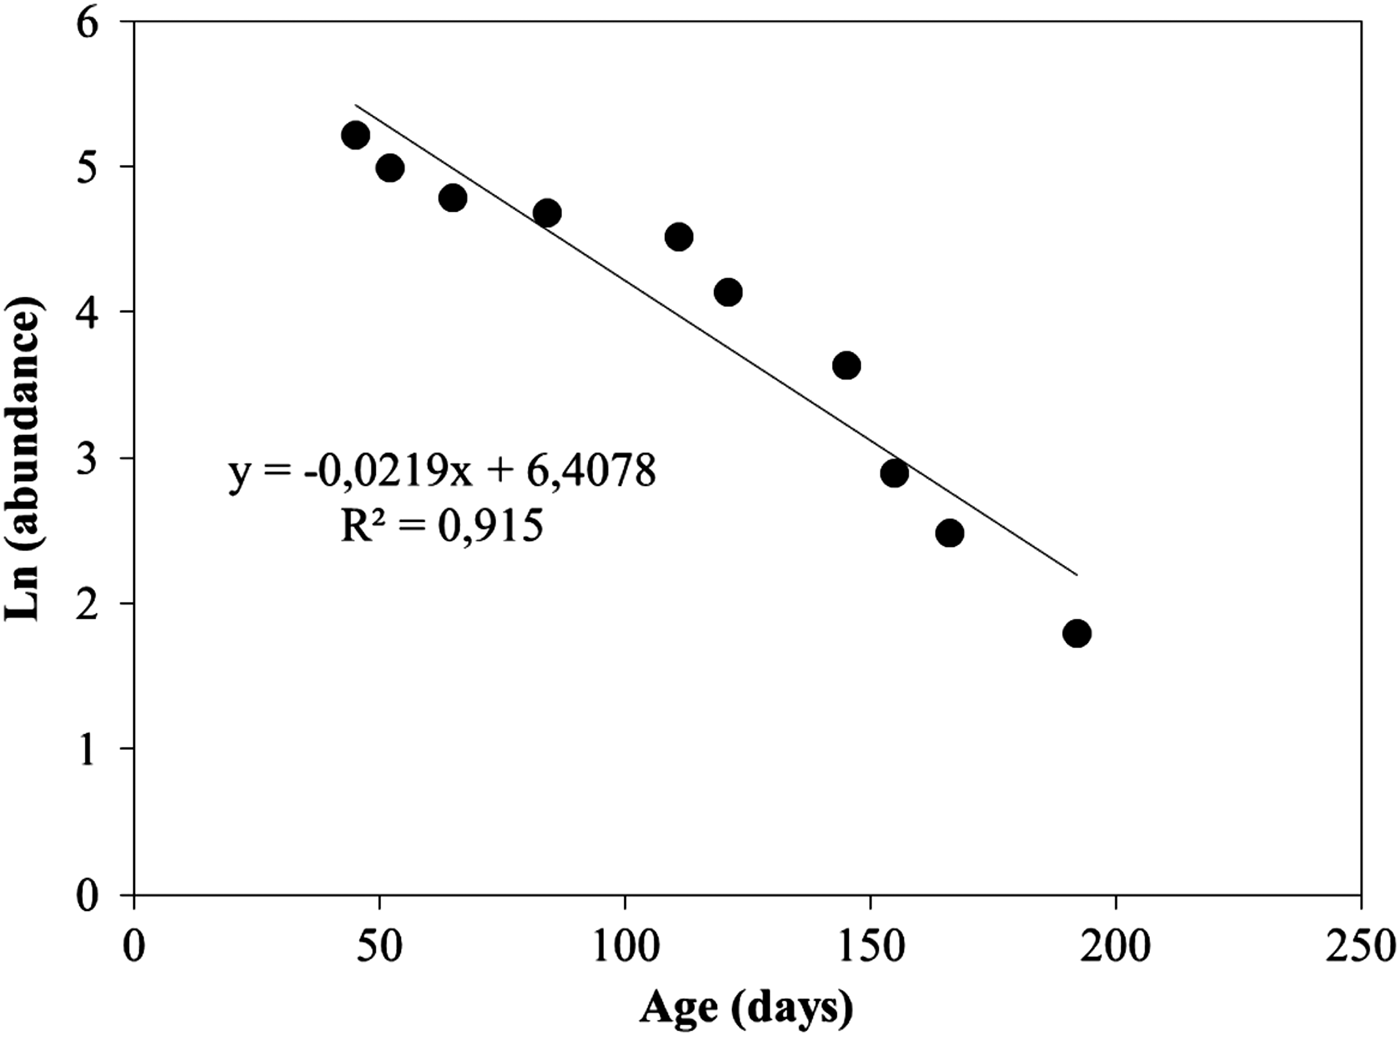
Data of natural logarithm of juvenile abundance were plotted against age, and the mortality coefficients were estimated as the slopes of these linear regressions (Figure 7). The juvenile instantaneous mortality coefficient was 0.0219, which represented around 2.16% of daily mortality.

Fig. 7. Relationships of ln abundance at age.
The hatching period of the striped sea bream was estimated to occur between April and January, with relatively higher hatching frequency in August (Figure 8).

Fig. 8. Hatch date monthly distributions of young of the year Lithognathus mormyrus back-calculated from age estimates and date of capture with mean surface water temperature. The line corresponds to temperature and the boxes to numbers of larvae hatched.
DISCUSSION
The sagittal otoliths of the juvenile striped sea bream show distinct opaque and hyaline bands which can be used for age determination. In the absence of a validation study, the daily increment formation of striped sea bream otoliths cannot be confirmed. Otolith daily increment formation is a general phenomenon which has been validated for many species (Pannella, Reference Pannella1971; Brothers, Reference Brothers1978; Campana & Neilson, Reference Campana and Neilson1985; Geffen, Reference Geffen, Summerfelt and Hall1987; Jones, Reference Jones, Stevenson and Campana1992). In this study, otoliths of the striped sea bream showed a regular growth pattern with clearly identifiable increments (Figure 3). The youngest fish was estimated 30 d and caught in August, while the oldest YOY was 307 d and caught in July. A general decline in numbers was apparent as the fish got older (Table 1). Matic-Skoko et al. (Reference Matic-Skoko, Ferri, Kraljevic and Dulcic2007), suggested that individuals were recruited at ~6–7 cm LT, from shallow waters to deeper habitats. Therefore, the decline in the number of the older fish might partially be due to movements of the larger size fish to deeper waters.
The relationships between otolith and fish size reveal the ecological aspects of larval and juvenile fish. Two important relationships are used in fisheries: first, the allometric relationship between the otolith and fish size, and second, the individual growth rate of fish or population per day (Jones, Reference Jones, Stevenson and Campana1992). The relationship between fish length and otolith radius of the larval stage of many species is allometric (Campana & Neilson, Reference Campana and Neilson1985; Thorrold & Williams, Reference Thorrold and Williams1989; Jenkins & Davis, Reference Jenkins and Davis1990) but in the juvenile stage isometric growth has been reported to be more common (Campana & Neilson, Reference Campana and Neilson1985). In this study the otolith length–fish length relationship was significantly linear, demonstrating that otolith growth was proportional to the growth of fish for L. mormyrus. This result showed that fish size can be estimated using the otolith size and also that individual growth patterns of juveniles back-calculated using the biological intercept method are reliable.
The microstructure of otoliths provides a major contribution to our understanding of growth in fish (Sponaugle, Reference Sponaugle2010). In the larval and juvenile stage period, the length and other morphological features of fish change very fast. In this regard, determination of daily growth in the sizes can be used to predict survival percentages of YOY individuals until they become mature (Houde, Reference Houde1989). Growth is one of the most important factors for survival in larval and juvenile fish in early life stages. Faster-growing fish get past this period more quickly and thus have higher chances of survival (Takahashi & Watanabe, Reference Takahashi and Watanabe2004). In this study, assuming a daily rate of increment formation, growth rates were found as 0.325 mm d−1. There is no information about age and growth of YOY striped sea bream. So we compared the growth rates with similar species belonging to the same family. Growth rate estimates obtained from snapper, Pagrus auratus, gave 0.37 mm d−1 in Australia (Lenanton, Reference Lenanton1974), 0.26 mm d−1 in New Zealand (Paul, Reference Paul1976) and between 0.33 and 0.37 mm d−1 in Shijiki Bay, Japan (Kato et al., Reference Kato, Sudo, Azeta and Matsumiya1991). From these results we can see that the growth rates of striped sea bream and snapper are quite similar.
Regarding the formation of daily rings, some authors have found that increments were not formed on a daily basis, and thus, that the age of the larvae were underestimated (Fox et al., Reference Fox, Folkvord and Geffen2003). Environmental variations (e.g. temperature) can result in changes in actual growth rates (Campana, Reference Campana1984). In some (unstable) environments such as the Baltic Sea, ring deposition can be halted due to slow growth, which makes ring counts unreliable for age estimations (less than one ring is formed per day) (Fox et al., Reference Fox, Folkvord and Geffen2003). In this study, YOY striped sea bream growth rates have been found to be 0.416, 0.374, 0.317 and 0.312 mm d−1 for individuals who hatched in summer, spring, autumn and winter, respectively. The higher growth rates of the summer-hatched larvae are in correspondence with higher average temperatures (Figure 8). Matic-Skoko et al. (Reference Matic-Skoko, Ferri, Kraljevic and Dulcic2007) reported that growth is directly and indirectly related to sea temperature fluctuations. Changes in environmental conditions (mainly temperature, salinity and food availability) in the different habitats may be connected with growth pattern (Wootton, Reference Wootton1990).
The estimated instantaneous mortality coefficient (M = 0.0219) was almost equal to the weight-specific growth coefficient (G T = 0.0222), resulting in an M:G T ratio of <1.0 (M:G T ratio of 0.9864). Changes in the M:G T ratio have been suggested as predictors of a cohort's biomass trend (Houde, Reference Houde1997). Cohort biomass is declining when M:G T > 1.0 and is increasing when M:G T < 1.0 (Houde, Reference Houde1997). This M:G T ratio suggests that the YOY striped sea bream cohort biomass is increasing. Werner & Gilliam (Reference Werner and Gilliam1984) suggested that the M:G T ratio is a powerful indicator of larval fitness.
In this study, the hatching period of the YOY striped sea bream was estimated to occur between April and January, with relatively higher hatching frequency in August. According to Wootton (Reference Wootton1990), temperature is the most important environmental factor driving reproductive success in fish. The maximum hatching frequency in striped sea bream was in summertime where temperature is highest (Figure 9), perhaps indicating that hatching is correlated with, or influenced by, temperature. The differences of spawning period reported in different studies could be related to geographical area, sampling methods or estimation methods (e.g. GSI, ichthyoplankton and otolith microstructure).
These results are based on the assumption of daily increment formation, but the fact is that this has not been validated yet for the striped sea bream. A study investigating this should be conducted in order to ensure correct age and growth rate estimations. Such a study could be based on rearing larvae from hatching (Vigliola, Reference Vigliola1997; Pajuelo & Lorenzo, Reference Pajuelo and Lorenzo2011; Duffy et al., Reference Duffy, McBride, Hendricks and Oliveira2012; Ellender et al., Reference Ellender, Taylor and Weyl2012; Parkinson et al., Reference Parkinson, Booth and Lee2012; Dodson et al., Reference Dodson, Sirois, Daigle, Gaudin and Bardonnet2013; Farley et al., Reference Farley, Williams, Clear, Davies and Nicol2013).
ACKNOWLEDGMENT
Thanks to Alkan Oztekin for logistical support in the field.
FINANCIAL SUPPORT
This work was supported by the Scientific and Technological Research Council of Turkey (grant number 106T123) and also has been prepared as part of a PhD thesis.


