


1 Introduction
RP's phonetic and phonological details are probably the most well-known and thoroughly-described of any accent variety of English, due to a descriptive history now stretching back almost one hundred years (Jones Reference Jones1918, Reference Jones1932, Reference Jones1956; Gimson Reference Gimson1962, Reference Gimson1970, Reference Gimson1980; Wells Reference Wells1982; Cruttenden Reference Cruttenden1994, Reference Cruttenden2001) to an early period in the accent's history, which dates from the latter part of the nineteenth century, at the height of the Victorian age (Mugglestone Reference Mugglestone2003). The RP accent, over time, has exhibited diachronic change. Because of advances in recording and computing technology during the course of the twentieth century, phoneticians and sociolinguists now have the possibility of observing recorded speech data from speakers born at the very beginning of the century, and comparing them with speakers born in the latter part of the century. This enables observations of generational changes in real time (Labov Reference Labov1994: 73–112), and assists researchers in distinguishing genuine diachronic change more accurately from other types of speech variation evident in the community, such as age-grading. The work carried out in New Zealand on the ONZE (Origins of New Zealand English) corpus is one example; real-time comparisons of the first New Zealand-born generation of white settlers with later generations have contributed to a deeper understanding of the sociolinguistic processes behind new dialect formation and generational change (Gordon, Campbell, Hay, Maclagan, Sudbury & Trudgill Reference Trudgill2004).
The present empirical study examines the short or checked vowels of RP as a subset of the vowel system. Wells (Reference Wells1982: 119), for example, distinguishes checked vowels from free vowels on the basis of the well-known phonotactic constraint that checked vowels are limited to syllables with at least one coda consonant. Labov (Reference Labov1994: 161) also singles out the short vowels as structurally unified in a subsystem because of their occurrence only in checked positions. Since the data here are used to examine the relative juxtapositions of two checked vowels, it was felt to be unnecessary to examine all vowels in the system of English, as the proliferation of vowel positions could cloud the point being examined (see Section 6 below).
Several previous studies have examined the phonetic trajectories of these short vowels in RP over the course of the twentieth century. It has been widely reported in the literature (e.g. Wells Reference Wells1982: 291f.; Bauer Reference Bauer1985, Reference Bauer1994; Harrington, Palethorpe & Watson Reference Harrington, Palethorpe and Watson2000: 74) that the typical value of the trap vowel has lowered and centred from a higher and more front position within the vowel space during that time. The foot vowel, as well as trap and strut, has also been the subject of recent attention in studies of regional varieties close to London in the Southeast of England, Ashford and Reading (Torgersen Reference Torgersen1997, Torgersen & Kerswill Reference Torgersen and Kerswill2004). As will be discussed below, there is less agreement on historical movements in the strut vowel's position. Wells (Reference Wells1982: 291), for instance, reported that trap was moving into strut's area during the 1970s and 1980s, citing anecdotal accounts of pronunciations heard as ‘bunk bulences’ for ‘bank balances’. Tollfree (Reference Tollfree, Foulkes and Docherty1999: 165) reports her middle-class SELRS (Southeast London Regional Standard) speakers as showing a range of strut values from [ɐ] to [![]() ], which she contrasts with the ‘fully back [ʌ] standardly given for RP’ (although, as the discussion above shows, this is perhaps a simplification of the RP situation). strut is at any rate quite distinct from trap in her description; the latter is shown unequivocally as [æ]. The past and present relationships between these two short vowels are the focus of the present study.
], which she contrasts with the ‘fully back [ʌ] standardly given for RP’ (although, as the discussion above shows, this is perhaps a simplification of the RP situation). strut is at any rate quite distinct from trap in her description; the latter is shown unequivocally as [æ]. The past and present relationships between these two short vowels are the focus of the present study.
An important feature of this paper is that the data presented here come from different sources and recording conditions, and from both controlled experimental conditions and spontaneous speech. From a mainstream phonetic perspective, this raises the issue of comparability of the data and opens up for potential differences in recording media or recording techniques which sociolinguistic and forensic linguistic analysts are just beginning to explore. Moreover, sometimes historical data will be scanty and not as full as one would wish, due to arbitrary historical circumstances. The embeddedness of sound change in a speech community, however, makes it necessary to take up the challenge of examining real-time change in more everyday-occurring as well as laboratory-situated data, and confronting the methodological issues arising thereby.
The issue of the comparability of recordings separated by time gaps is one that is addressed constantly in forensic phonetic studies. Hollien & Schwartz (Reference Hollien and Schwartz2000), for example, examined the effects on listener's performance on speaker identification tasks of recordings produced over time gaps of varying lengths from four weeks to twenty years. Their findings ‘underscore the argument that noncontemporary speech samples can be used effectively in nearly all types of speaker identification’ (Hollien & Schwartz Reference Hollien and Schwartz2000: 207). A recent study of the forensic phonetic investigations carried out in the case of the conviction of the Yorkshire Ripper hoaxer, John Humble (French, Harrison & Windsor Lewis Reference French, Harrison and WINDSOR Lewis2006) also documents extensive phonetic similarities of different types in linguistic performances more than twenty-five years apart (1978–79 and 2005). Another aspect of the comparability issue is the effect on acoustic phonetic characteristics of various technological parameters in different recordings. With constant technological advances, there are a multitude of possible parameters of investigation. For example, Künzel (Reference Künzel2001) is an empirical study of the considerable acoustic effects of telephone transmission on vowel formants (on F1, especially); Byrne & Foulkes (Reference Byrne and Foulkes2004) examine effects on formant values by mobile phones compared to landline phones. An ongoing study of the effects of different microphone placements and recording situations (Foget Hansen & Pharao Reference Foget Hansen and Pharao2006) will also contribute to clarification of this issue. Sociolinguists concerned with real-time recordings will also have to take such aspects into account.
The normalisation, angle and distance calculation methodologies introduced here enable unified and abstract patterns of change to emerge, despite the disparate origins of the data sets. That is, similar generational trends emerge in the formant-plot positions of the trap and strut vowels, with a discernable and replicably measurable change in the relative alignment of the two. The present paper's considerable data corpus, encompassing 52 speakers in all (25 of whom are represented in average formant values from Wells Reference Wells1962), also supports the generality of its findings.
2 Isolating and identifying RP
Despite various claims to the effect that the RP accent's form and status have changed so much that the name should be considered obsolete (see, for example, Milroy Reference Milroy2001, Macaulay Reference Macaulay1988), RP for many analysts remains a phonetically, phonologically and sociolinguistically identifiable accent variety (or set of varieties) of (British or English) English. In common with Wells (Reference Wells1982), Cruttenden (Reference Cruttenden2001) and Roach (Reference Roach2004), the present paper takes the position that RP is a definable, albeit variable, accent variety of British English. Definitions of it rely firstly on phonological and phonetic criteria, as codified in pronunciation dictionaries such as Roach & Hartman (Reference Roach and Hartman1997) and Wells (Reference Wells2000). The system comprises 24 consonants, 11 pure vowels, five closing diphthongs, three centring diphthongs, and two weak vowels which represent neutralisations between long and short vowels in certain positions (Roach Reference Roach2004: 242). RP exhibits such distributional features as start in the bath words, a distinction between strut and foot, a contrast between schwa and strut, and no non-pre-vocalic /r/. One important phonetic feature is smoothing of triphthongs (Wells Reference Wells1982: 238). As noted above, phonological and phonetic criteria are sometimes used in tandem with social characteristics such as socioeconomic status, ‘public’ or independent school education, or other socially exclusive circumstances (e.g. Gimson Reference Gimson1980, Wells Reference Wells1982: 279). Roach's (Reference Roach2004: 244) example speaker was educated at a private preparatory school, a ‘traditional girls’ grammar school’ and Oxford University, for instance. Aesthetic definitions can also play a part in the accent's definition, so that RP is sometimes identified with speech that is regarded by gatekeepers as being ‘correct’ or ‘good’; see for example Wells (Reference Wells1990: xii, 1997), although these perceptions of construct RP are not sufficient in themselves and need to be kept distinct from variability and change in native RP (Fabricius Reference Fabricius2002b).
All the data samples presented here have been independently identified as samples of RP. Deterding (Reference Deterding1997) is the source of formant data from speakers in the Machine Readable Spoken English Corpus (MARSEC) consisting of BBC World Service broadcasts in the 1980s, where ‘the accent of all the speakers is RP or close to it’ (Roach, Knowles, Varadi & Arnfield Reference Roach, Knowles, Varadi and Arnfield1993: 48). Two identified individuals from the MARSEC corpus are used in this study, and the present author confirmed their coming from RP-speaking social and educational backgrounds (in the case of male c, by personal communication). Harrington et al. (Reference Harrington, Palethorpe and Watson2000) examined recordings of HM Queen Elizabeth II. In their study of four age cohorts, Hawkins & Midgley (Reference Hawkins and Midgley2005) identified their subjects as RP speakers through comparison with the second author's native RP system as well as speakers’ own self-identifications. Wells (Reference Wells1962) identified the study's 25 speakers as ‘speakers of that dialect of British English generally known among phoneticians as RP (Received Pronunciation) and referred to by the layman in such terms as “speaking perfect English” or “speaking English without any accent”’.Footnote 1 The speakers in the final data set, from the present author's Cambridge study, Fabricius (Reference Fabricius2000: 36f., 78f.) were identified as modern RP speakers on the basis of comparison with existing phonological descriptions of RP, and on the basis of independent confirmation by other phonetically-trained judges.
3 Previous descriptions of phonetic changes in trap and strut
We turn now to early descriptions of the two vowels in question. Jones’ (Reference Jones1909, Reference Jones1918, Reference Jones1932, Reference Jones1956) charts illustrating the relative positions of the vowels of English are a useful starting point here (see also the discussion in Collins & Mees Reference Collins and Mees1999: 210–213). In the first edition of the Pronunciation of English (Jones Reference Jones1909), and the first edition of An Outline of English Phonetics (Jones Reference Jones1918), strut [ʌ] was included among the back vowels, in both cases placed behind schwa and nurse (the latter represented as long schwa), which are here classified as Mixed vowels, in Jones’ early terminology. In Jones (Reference Jones1909) strut was shown as being at the same height level as nurse and schwa, a position it retains in Jones (Reference Jones1918). The figure from Jones (Reference Jones1909: xiii) is reproduced in figure 1.
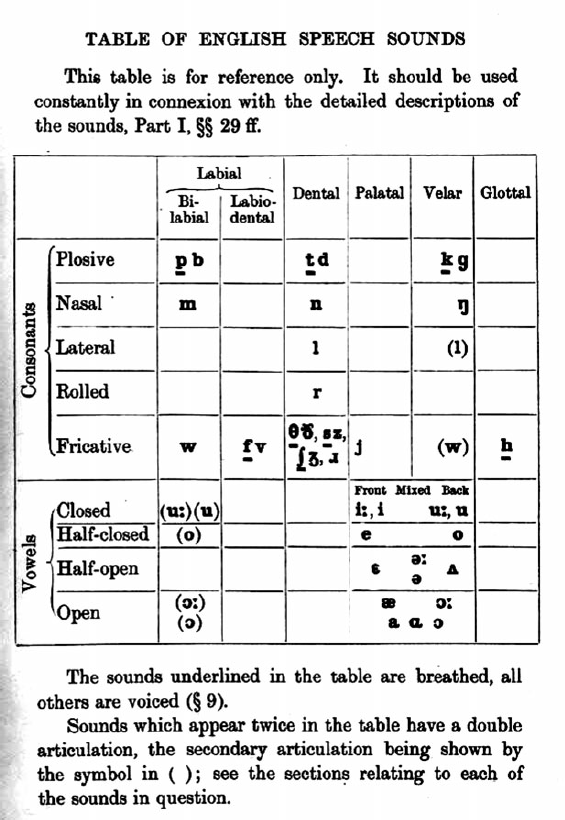
Figure 1 ‘Table of English speech sounds’ reproduced from Jones (Reference Jones1909: xiii).
By contrast, in the third edition of An Outline of English Phonetics (Jones Reference Jones1932), and its eighth edition (Jones Reference Jones1956), strut is placed in the set of central vowels, in the same series as schwa and nurse. Jones’ (Reference Jones1932: x) chart from the 3rd edition of the Outline is reproduced in figure 2. More detail of Jones’ understanding of the position of the strut vowel can be seen in his discussion. Collins & Mees note that in the first edition of the Outline (Jones Reference Jones1932: 85), Jones’ advice to foreign learners reveals that he is aware of variant pronunciations which Collins & Mees gloss as ‘more up-to-date’, in that he writes ‘If all efforts to obtain the precise sound ʌ fail, the best substitute is a’ (Collins & Mees Reference Collins and Mees1999: 231).

Figure 2 Phonetic chart reproduced from Jones (Reference Jones1932: x).
Later commentators distinguish between different strut vowel qualities, most often assigning them to different varieties of RP. Gimson (Reference Gimson1970: 107) notes that ‘[c]onservative RP speakers will often use a more retracted vowel [for strut], i.e. an unrounded and centralized type of C[ardinal] [ɔ][i.e. number 6]’. Wells (Reference Wells1982: 281) also describes the U-RP (the upper-class sociolect) strut vowel as back rather than central. Mainstream RP strut, on the other hand, is described as more front, and closer phonetically to younger speakers’ variant of trap, perhaps close enough for partial merger with strut (Wells Reference Wells1982: 292). Since it is closer to Jones’ earlier descriptions, the conservative strut vowel of U-RP (Wells Reference Wells1982: 281) could perhaps be understood as a relic variant.
Some subsequent research focussed on finding instrumental evidence of the fronting of strut in the first half of the twentieth century. Bauer (Reference Bauer1985) analysed recordings of subjects’ rendering of the reading passage, Arthur the Rat, made in successive years (from 1949 to 1966) in the Department of Linguistics at the University of Edinburgh. The corpus encompassed male and female speakers born between 1909 and 1947. However, the data revealed no convincing diachronic change in any direction. Bauer (Reference Bauer1985: 79) states that ‘[t]here is no change currently taking place within RP to /[ʌ]/’. Bauer (Reference Bauer1994: 121), however, reconsidered these and other data and concluded that strut had indeed already fronted. It should perhaps be noted that the three tokens of strut used in the acoustic measurements are all in the environment of nasal consonants (young, come, coming) (Bauer Reference Bauer1985: 63), which may have made them problematic as points of comparison with other vowel tokens that were not in nasal environments.
Harrington et al. (Reference Harrington, Palethorpe and Watson2000) present acoustic analyses of recordings of Queen Elizabeth II's Christmas messages in the decades between 1950 and 1990. Their analyses reveal a significant gradual increase in F1 for open vowels and a decrease in F2 for front vowels. In common with other earlier observers, they conclude that trap has retracted and lowered from its position in the earlier recordings. Moreover, they argue that the Queen's strut vowel had backed (a decrease in F2) and lowered (an increase in F1) from the 1950s to the 1980s, so that this vowel, like most other lax and tense vowels, came closer to the typical values of female BBC newsreaders speech in the 1980s (Deterding Reference Deterding1997). Note that there is a lack of congruence between these different reports. Jones’ (Reference Jones1909, Reference Jones1918, Reference Jones1932, Reference Jones1956) charts showed that strut had fronted and lowered, while Harrington et al.'s claim is that strut in the Queen's speech had retracted and lowered from the 1950s to the 1980s. One possible explanation for this incongruence is discussed at length below in Section 7.2
In their recent acoustic study of RP monophthongs, Hawkins & Midgley (Reference Hawkins and Midgley2005) find evidence of the lowering and backing of trap over the generations, but only tentative evidence of incipient change in the strut vowel in the youngest age group (born 1976–1981). This group showed a so-called ‘break-group’ distribution, in F1 alone, corresponding approximately to vowel height (although this is not completely straightforward, since factors such as lip-rounding also have an influence on vowel formants’ positions, see e.g. Ladefoged & Maddieson Reference Ladefoged and Maddieson1996: 285). Hawkins & Midgley (Reference Hawkins and Midgley2005: 192) use the designation ‘break-group’ to refer to any age cohort within their data set which exhibits wide ranges in formant frequencies for vowels, distinct from other groups whose frequency values cluster more closely. They posit that a break group represents a generational group who have a range of variants available to them because of incipient rapid diachronic change in the community. The individual alignments that speakers choose, whether more conservative or more progressive, in the authors’ terms) could then be investigated for sociolinguistic or psychological factors (Hawkins & Midgley: 192f.). The spread of F1 values for the strut vowels in Hawkins & Midgley's youngest cohort is, however, across the whole range of the earlier generational cohorts, so it is not clear what direction of change in strut's F1 (whether raising or lowering) can be inferred from their data.
On the basis of these reports, it is apparent that there is scope for a re-examination of the trap and strut vowels in earlier and more recent recordings of RP speech data, and a renewed attempt to come to terms with their variability and the trends which may emerge. This study gathers previously published acoustic data and newly-analysed interview data recorded in the late 1990s, in order to amass an extensive real-time data sample. As it comprises formant data from 52 speakers in all, the study brings together a considerable population on which to base diachronic generalisations.
4 The acoustic data sets
The data compared in the present paper derive from instrumental acoustic measurements of vowel formants in speech obtained from the following corpora:
-
(a) Radio broadcasts by two male RP speakers from the MARSEC corpus (Roach et al. Reference Roach, Knowles, Varadi and Arnfield1993) analysed in Deterding (Reference Deterding1997);
-
(b) Elicited citation forms spoken by a homogenous set of 25 male RP speakers born before 1945 – representing average values for the 25 speakers in the corpus (Wells Reference Wells1962);
-
(c) Elicited citation forms spoken by 20 male RP speakers in four age groups – representing individual values (Hawkins & Midgley Reference Hawkins and Midgley2005);
-
(d) Broadcast speech from Queen Elizabeth II's Christmas broadcasts over three decades: the 1950s, 1960s and 1980s (Harrington et al. Reference Harrington, Palethorpe and Watson2000);
-
(e) Sociolinguistic interview speech from four male speakers of modern RP conducted in Cambridge, UK, in 1997 and 1998 (for details, see Fabricius Reference Fabricius2000).
In three of these corpora, previously published vowel formant values were available in Hertz: Deterding (Reference Deterding1997),Footnote 2 Wells (Reference Wells1962), and Hawkins & Midgley (Reference Hawkins and Midgley2005). Corpus (d), from Harrington et al. (Reference Harrington, Palethorpe and Watson2000), consisted of vowel formant values in Bark calculated according to the formula in Zwicker (Reference Zwicker1961). These data were transformed to Hertz using a conversion table between Hertz values and Bark values, again based on Zwicker (Reference Zwicker1961).
5 Method
5.1 Formant analysis
In the case of corpus (e), acoustic measurements were carried out by the author. These measurements were carried out on digitized versions of the original analogue taped interviews, sampled at a rate of 22 Khz as recommended in Johnson (Reference Johnson1997: 27). The interviews were originally recorded in a sound-treated room in the Phonetics Laboratory, Department of Linguistics, University of Cambridge, UK, in October 1997 and October 1998 (for details of the recording situation, see Fabricius Reference Fabricius2000: 72–78). For the present analyses, the first five minutes of the recordings were ignored, in order to avoid the more monitored factual information elicitations which began the interview, in favour of more spontaneous conversational data. Tokens of the vowels kit, dress, trap, strut, lot, and foot were identified in phrasal-accented lexical or content words. Content words were chosen on the basis of Labov's observation that ‘[o]ne important finding for the general study of historical processes is the distinction between open and closed word classes . . . the mechanism of vowel shifting is particularly sensitive to this dimension’ (Labov Reference Labov1994: 77). Moreover, syllables were selected where the onset and coda were stops or fricatives. This was done to avoid co-articulation effects from sonorant consonants, such as nasals, liquids or approximants, whose formant structure is known to affect the formants of vowels in their immediate environments (Nolan Reference Nolan1983). Similar token sets were also collected for fleece and start, as individual measurements of these vowels were needed for the normalisation procedure (see the discussion in Section 5.2 below).
Instrumental acoustic analysis was carried out using SIL's Speech Analyzer software. Vocalic segments were identified from simultaneous inspection of four displays of the recording (raw waveform, spectrum, spectrogram and a F2 versus F1 plot). The formant values calculated by the program's LPC algorithm, using a window of 20 ms and a bandwidth of 300 Hz, were read off the spectrum display and recorded on Excel spreadsheets. The values for F1 and F2 as calculated by the programme were read off the Speech Analyzer display at a point judged as indicating the main tendency of the vowel without consonantal interference, following a procedure described by Harrington et al. (Reference Harrington, Palethorpe and Watson2000: 67). For high front vowels, the F2 maximum was located; for open vowels, the F1 maximum. In the case of high back vowels (foot for the older speakers), the F2 minimum was identified. If horizontal formant bands were visible throughout the vowel's spectrogram, the mid-point of the vowel was used for measurement. This set of measuring conventions is also commonly used in sociophonetic investigations (see e.g. Labov Reference Labov1994: 165). The F1 and F2 data were then averaged for each keyword set. Table A1 specifying the details of the data samples is presented in the appendix. Table A2, also in the appendix, specifies the numbers of vowel tokens analysed for each individual speaker in the corpora (with the exception of Wells Reference Wells1962, which is presented as average values for 25 speakers). Table A3 in the appendix gives the raw data results in the form of average F1 and F2 values in Hertz for the six short vowels analysed.
5.2 Normalisation procedure and the S-centroid
Since the analyses presented here represent data from different individuals of different ages with varying vocal tract sizes (note that all are male speakers bar one), a normalisation procedure was employed to transform the data and enhance visual comparability of the data for sociophonetic purposes. The S-procedure (Watt & Fabricius Reference Watt and Fabricius2002) was used in the present study. This procedure calculates each speaker's vowel space ‘centre of gravity’, or centroid S (following Koopmans-van Beinum Reference Koopmans-Van Beinum1980), using F1 and F2 values to represent the ‘limits’ of an individual's vowel space. Three point vowels are derived by obtaining average values for: the speaker's minimum F1 and maximum F2, which is taken to represent the (i) point vowel; the speaker's maximum F1 value, with its accompanying F2, the (a) point vowel; and, finally, the minimum F1 value and minimum F2 value which designates a hypothetical (u) point vowel, on the basis that a speaker by definition cannot have an F2 value lower than F1 (Watt & Fabricius Reference Watt and Fabricius2002: 164). Calculation of S therefore requires averaged measurements of the most extreme and stable high front vowel (usually fleece), plus the vowel which has the highest F1 (either trap, start or strut for the data presented here). A theoretical back/close limit to the vowel space is defined as having the same F1 and F2 as the F1 of the front point vowel (fleece). Figure 3, reproduced from figure 2 in Watt & Fabricius (Reference Watt and Fabricius2002: 164), illustrates the normalised vowel space which these point vowels define. The procedure is then to calculate the ‘grand mean’ values of F1 and F2 by averaging the point vowel values. In a worked example based on the speaker born in 1909, the S-centroid formant values are calculated as in table 1.

Table 1 S-centroid calculation, Speaker born 1909 (based on Deterding Reference Deterding1997).

Figure 3 Schematised representation of the ‘vowel triangle’ used for the calculation of S. i = min. F1, max. F2 (average F1 ~ F2 for fleece); a = max. F1 (average F1 ~ F2 for trap); uˈ = min. F1, min. F2, where F1 (uˈ) and F2 (uˈ) = F1 (i). Schematised representation of the three point vowel triangle used to calculate centroid S, reproduced from Watt & Fabricius (Reference Watt and Fabricius2002: 164, figure 2).
The full set of S-centroid calculations is presented in Table A4 in the appendix. Average vowel measurements for each keyword vowel category can then be normalised by dividing each average formant value by its corresponding S-centroid formant value, so that the formant values are then expressed as ratios of the value of S. Thus, for the speaker born in 1909, we get the full set of short vowel formant averages as in table 2.

Table 2 Average formant values for short vowels in Hz and S, Speaker born 1909 (based on Deterding Reference Deterding1997).
While the S-procedure is relatively new, and remains to be tested further, it has already been compared with linear Hertz measurements and Bark-normalised values, and shown to be superior on two criteria which are important for sociophonetic research: approaching agreement in vowel triangle area and obtaining vowel triangle overlap (on two speakers in Watt & Fabricius Reference Watt and Fabricius2002: 168; on nine speakers in Kamata Reference Kamata2006: 25f.). Interestingly, the S-procedure also meets Adank, Smits & van Hout's (Reference Adank, Smits and Van Hout2004) criteria for an optimal vowel normalisation process for sociolinguistic purposes. As the authors explain, a standard classification of normalisation algorithms is according to the type of information used for their calculation. Vowel-intrinsic normalisation procedures, such as the Bark scale, ‘use only acoustic information contained within a single vowel token to normalize that vowel token’ (Adank et al. Reference Adank, Smits and Van Hout2004: 3099). Vowel extrinsic procedures on the other hand take information from a range of vowels to normalise a single vowel token, in a manner reminiscent of the S-procedure, using, for example point vowels. Well-known normalisation procedures such as those in Lobanov (Reference Lobanov1971) and Nearey (Reference Nearey1978) are cases in point. Extending this standard classification into extrinsic versus intrinsic procedures, Adank et al. (Reference Adank, Smits and Van Hout2004: 3106) make a further, cross-cutting division of normalisation procedures into those which a) use information from several formants to normalise a single formant (labelled formant-extrinsic), and those which b) use information from just the single formant to normalise that formant (formant-intrinsic). The procedures which performed best in preserving phonemic information, reducing anatomical/physiological variation, and preserving regional or sociolinguistic information (Adank et al. Reference Adank, Smits and Van Hout2004: 3105) were those which were classified as vowel-extrinsic and formant-intrinsic. The S-procedure, in common with these most successful procedures, is vowel-extrinsic and formant-intrinsic.
The present paper's choice of the S-procedure is not intended as a criticism of the Bark scale in any other respect, however. The S-transform is to be regarded merely as a means of enabling better visual comparisons of a set of disparate data. As Watt & Fabricius (Reference Watt and Fabricius2002: 169) state, they ‘do not claim it has any psychoperceptual validity (e.g. that it mimics the normalisation process assumed to exist for the auditory processing of speech signals . . . Instead, [they] see it solely as a useful tool for researchers wishing to reduce inter-speaker differences resulting from variations in V[ocal] T[ract] L[ength]’.
5.3 Plotting the relative positions of trap and strut
Using these normalised S values for F1 and F2, the short vowels kit, dress, trap, strut, lot and foot were initially plotted on one Excel chart per individual speaker (or, in the case of the data deriving from Wells Reference Wells1962, an average value for 25 speakers). It became clear that there was considerable diachronic variation in the relative positions of trap and strut. The pressing question then became how to capture this variation in a replicable way.
Within sociolinguistic research into phonetic variation and change (Labov Reference Labov1994, Thomas Reference Thomas2001), formant plots of vowel positions tend to be compared visually, so that vowels are typically referred to as being ‘in front of’, ‘behind’, ‘below’ or ‘above’ others, for example. For the purposes of making this type of two-dimensional description more precise and independent of the analyst viewing the data, a method was developed by the present author to obtain a value for this variation in the relative placement of two points. Using trap as the anchor point (although in more general application of this method, any vowel could be used as the anchor), a calculation was made of the angle of the line from trap to strut relative to the horizontal. This was obtained using the following formula:
-
Tan Θ = ((F1 trap − F1 strut)/(F2 trap − F2 strut))
where Θ is the value of the angle relative to horizontal. The tan Θ value can then be used to derive the value of the angle in radians, using for example Microsoft Excel's ATAN (= arctan) function. Excel's DEGREE function was then used to convert the angle from radians to degrees. The angle value thus represents the placement of a strut average value vis-à-vis a horizontal line originating at the average position of trap.
Again using the example of the speaker born in 1909, the calculation is as follows:
-
Tan Θ = ((1.3922−1.6512)/(1.2447−0.9727))
-
Tan Θ = (−0.25907/0.272085)
-
Tan Θ = −0.952156714
-
ARCTANGENT (−0.952156714) = 0.7609 (radians)
-
0.7609 (radians) = −43.5961 degrees (rounded to −44 degrees in table 3)
In order to confirm the validity of the angle measurements, a calculation of the Euclidean distance between two points was made. This was obtained using the following formula:
In the worked example, this gives

In one data set presented below, a male speaker born in 1973 from the author's Cambridge corpus, revealed an angle calculation which differed greatly from the others (at 0.098; see table 3). In this case, the Euclidean distance was so relatively small as to make comparison of the trap and strut average positions effectively meaningless. While this set of data is included for the sake of completeness, it should be disregarded in the context of the general discussion (see Section 7 below). Euclidean distance thus provides a useful additional and complementary measure for determining the actual separation of the two points in question. With this method, visual plots of F1/F2 are still central to demonstrating the juxtaposition of the vowels; angle measurements and Euclidean distances contribute extra precision to the descriptive enterprise.

Table 3 Angle measurements in degrees and Euclidean distances, calculated on S-normalised data points for all data sets.
These procedures using angle and distance calculations to represent the relationship between two vowel positions can also be distinguished from common techniques in phonetic studies of vowel formant variation. The latter tend to compare normalised formant values on a single dimension or plane at a time (either the F1 or F2/F2–F1 planes), using statistical comparisons such as analyses of variance and post-hoc t-tests, to demonstrate changes in values across groups or over time (as in Harrington et al. Reference Harrington, Palethorpe and Watson2000: 70). These procedures again contrast with the widespread sociolinguistic technique described above, which plots vowel measurements and compares them visually for changes in two dimensions. This has been widely used in Labovian-influenced quantitative sociolinguistics, beginning with Labov, Yaeger & Steiner (Reference Labov, Yaeger and Steiner1972) and ongoing in work within this paradigm, both in the U.S. (such as Labov Reference Labov1994) and in the U.K (e.g. Watt & Tillotson Reference Watt and Tillotson2001, Fabricius Reference Fabricius2002a, Torgersen & Kerswill Reference Torgersen and Kerswill2004). Viewed objectively, both methods have advantages. The phonetic method has the advantage of precision and replicability through the use of statistics, while the sociolinguistic method has the advantage of allowing visual comparison between data sets on the horizontal and vertical dimensions at once, a crucial aspect for studies of related vowel positions over time. The inspiration for the methodology presented here was the goal of contributing to sociolinguistic methodology by introducing precision in the spirit of phonetic methodology in this crucial area of representing relationships between vowel positions.
In summary then, through comparisons of different two-dimensional plots using angle and Euclidean distance calculations, differences in the relative placements of two vowels can be expressed simultaneously on both the F1 and F2 dimensions. The methodology is to be seen as a supplement to the standard sociophonetic method, as it quantifies the juxtaposition of two vowel points, a central concern for understanding changes in vowel configurations over time. It unites the two coordinates represented by F1 and F2 into a single polar representation, which captures the two-dimensionality of the (F1, F2) space in a single quantified relative position. Moreover, it is an abstraction which can be normalised across speakers and perhaps even recording types, potentially opening up for its application in forensic work (see Section 1 above).
The data presented in this study are based on normalised average F1 and F2 measurements and do not take standard deviations into account. This is perhaps a weakness, since means can obscure different degrees of deviation. However, as this technique relies on having single points to use as the basis of comparison, it is offered as a methodological starting point which could be developed and refined further. Further, as will be demonstrated below, similar tendencies in the mean values can be seen in data averaged from four measurements per keyword vowel (Hawkins & Midgley Reference Hawkins and Midgley2005) and in data based on over 20 measurements per keyword vowel (as in some of the Cambridge interview analyses). For that reason, the presentation here will use means alone as a first approximation in uncovering patterns in the data.
6 Results
The angle calculation and Euclidean distance data derived from the present corpus are presented in table 3. These values will be now be illustrated and discussed further by means of a selection of speakers’ F1/F2 plots and accompanying descriptions of relative placements of vowels in a two-dimensional space, where vowels will be described as lower, higher, more front or more back relative to each other, employing the conventional relationship of vowel height to F1 and frontness/backness to F2 familiar from other studies.
For the sake of a simple initial comparison, we can compare two averages which illustrate the overall diachronic trend discussed in more detail below. An average value of the angle from trap to strut was calculated for those speakers born before and after the end of World War 2 (excluding the speaker born in 1973 for the reason discussed in Section 5.3 above). The average for speakers born before 1945 was −2 degrees, that is, two degrees below the horizontal moving from left to right. In this configuration, the two vowels would be almost horizontally aligned, with trap forward of strut. This is in contrast to the averaged angle for all speakers born after World War 2, +38 degrees. In this configuration, strut would be above and rightward of trap.
The charts below, illustrating the different relative configurations of trap and strut, are scaled so that distances are identical on both x- and y-axes. Both axes originate at 0 in the top right corner. Only in this way can the charts illustrate the calculated angles with an accurate visual impression. This requires a somewhat different scaling than is usually used in phonetic and sociolinguistic presentations of such data, since the lowest F1 and F2 values are much higher than 0. One aim in the present paper, however, is to demonstrate the usefulness and replicability of the angle calculation methodology. For this reason, it was necessary to scale the charts so that they illustrated the calculated angles and distances as accurately as possible.
The remainder of this section will discuss a subset of the individual speakers chronologically. We begin with the oldest speaker, born in 1909 (Deterding's 1997 male h; see figure 4). Here the angle of a line drawn from trap to strut is calculated at 44 degrees below the horizontal (−44 degrees), with trap higher and more front than strut. strut itself is not as far back as lot and foot.

Figure 4 Short vowel system for Speaker born 1909 (based on Deterding Reference Deterding1997).
Moving through the data chronologically according to birth year, other configurations emerge. If we examine the speakers born in the period from 1928 to 1936, two patterns are apparent. In the first, trap is higher in the vowel space than strut (as was also evident with the speaker born in 1909 shown in figure 4) so that a line drawn from trap to strut forms an angle below the horizontal; in this one case the angle is at −24 degrees (see figure 5).

Figure 5 Short vowel system for Speaker 1–1 (based on Hawkins & Midgley Reference Hawkins and Midgley2005).
The majority pattern for this age group, however, is apparent in data from the other four speakers in Hawkins & Midgley's (Reference Hawkins and Midgley2005) oldest age group. Here trap is lower than strut, so that a line drawn from trap to strut forms a shallow positive angle, in all cases +19 degrees or below. The four other cases of data from speakers born in the same period (the late 1920s) fit into the range defined above, since all show configurations where the line drawn from trap to strut falls within the same range of shallow negative and shallow positive angles. Deterding's (Reference Deterding1997) male c, for instance, born in 1927, calculates at +6 degrees, and the three separate decades of broadcast messages by the Queen (−18, +2 and −11 respectively for the 1950s, 1960s and 1980s; see further discussion of this data below in Section 7.2)
Figure 6 presents Speaker 1–3, again from Hawkins & Midgley's group born between 1928 and 1936. The particular angle from trap to strut here fits into the category of shallow positive angles (+14 degrees).

Figure 6 Short vowel system for Speaker 1–3 (based on Hawkins & Midgley Reference Hawkins and Midgley2005).
A similar vowel juxtaposition appears in the data from Wells (Reference Wells1962), where the values represent average formants for citations forms of short vowels, as spoken by 25 speakers of RP born in 1944 or earlier. Figure 7 shows a plot of the average values for the six short vowels (using an S-normalisation based on trap) with the relative positions of trap and strut conforming to the majority pattern in Hawkins & Midgley's generational group born between 1928 and 1936. The angle between the two vowel positions is here +10 degrees above the horizontal.

Figure 7 Average short vowel system for 25 RP speakers born before 1945 (based on Wells Reference Wells1962).
Moving to subsequent generations of RP speakers, it can be seen that Hawkins & Midgley's middle age groups (groups 2 and 3 in table 3) born in the periods 1946–1951 and 1961–1966 show variation between three patterns. In Hawkins & Midgley's (Reference Hawkins and Midgley2005: 192) terms they might be termed ‘break groups’ in the data as presented here. The first of the three patterns is a shallow negative angle as already seen in the older age group above, and exemplified in figure 5. This is found for two speakers from group 2 (speaker 2–3 at −21 degrees and speaker 2–4 at −27 degrees) and from two speakers from group 3 (speaker 3–2 at −26 degrees and speaker 3 at −2 degrees). None of these negative angles are as steep as the angle of −44 found for the speaker from 1909. A shallow positive angle also occurs (+8 degrees for speaker 2–1; +27 degrees for speaker 3–5), similar to that exemplified in figure 6. The third pattern consists of a steeper positive angle, between +40 and +70 degrees above the horizontal, a configuration which was neither found in the oldest age group from Hawkins & Midgley's (Reference Hawkins and Midgley2005) data (group 1, born 1928–1936), nor in the other data sources from speakers born before 1928. This pattern is illustrated in figure 8, where the angle between trap and strut is calculated at +61.5 degrees. This type of configuration occurs in two speakers’ data from group 2 (speakers 2 and 5) and two speakers’ data from group 3 (speakers 1 and 4).

Figure 8 Short vowel system for Speaker 3–1 (based on Hawkins & Midgley Reference Hawkins and Midgley2005).
Two speakers from the Fabricius Cambridge corpus, born in 1956 and 1966, show configurations of trap and strut showed angles of +41 and +52 degrees respectively. This also matches the newer pattern illustrated above in figure 8. Figure 9 illustrates this with data from the speaker born in 1966.

Figure 9 Short vowel system for Speaker born 1966 (Fabricius’ Cambridge corpus of interview speech).
Finally, in the group of youngest speakers in Hawkins & Midgley's (Reference Hawkins and Midgley2005) data (group 4, born between 1976 and 1981) we find that all speakers show the third pattern, already illustrated in figures 8 and 9. The shallowest angle evident in this group is +56 degrees, the steepest +84 degrees. Figure 10 exemplifies this using the example of speaker S4–4, with an angle of +79 degrees.

Figure 10 Short vowel system for Speaker 4–4 (based Hawkins & Midgley Reference Hawkins and Midgley2005).
Again, the Cambridge speaker born in 1980 matches this pattern, as can be seen in figure 11, which illustrates the calculated angle of +70 degrees.

Figure 11 Short vowel system for Speaker born 1980 (Fabricius’ Cambridge corpus of interview speech).
7 Discussion
7.1 Summary of results
In the data overall, then, the trend is towards a diachronic realignment of the relative positions of trap and strut. At the earliest stage, trap is higher and more front than strut, so that, with trap as the anchor point, strut's position forms a negative angle to the horizontal. This is seen in the data from the oldest speaker in the data, as well as from other speakers, illustrated in figures A1 and A2 in the appendix. strut in this vowel configuration is the lowest open vowel in the system. Contrast this with the second stage exemplified in figures A3 and A4 in the appendix, where strut is immediately behind trap and more or less on the same level or slightly above, so that the two vowels together form a horizontal lower base of the vowel space. In the third stage, in the youngest speakers’ data, trap and strut are approaching another alignment, such that strut occupies a mid, non-peripheral position in the short vowel space, while trap occupies an open peripheral position. Here trap is the lowest open vowel. This pattern is exemplified in figures 8–11. strut is moreover now apparently non-peripheral, in Labov's terms (Labov Reference Labov1994).
In summary then, these data show the short vowel space in RP over the course of the twentieth century undergoing a change from
-
• an early configuration with strut as the lowest point, and both trap and strut peripheral, through a phase with
-
• a configuration in the mid-twentieth century, with trap and strut both peripheral and on a similar level, to, finally,
-
• a late configuration, with trap lowest and strut non-peripheral, characteristic of the later twentieth century.
On the basis of the present analyses, we can return to the earlier reports of diachronic changes affecting trap and strut. As in Bauer (Reference Bauer1985), there is no evidence of strut fronting from the fully back position which appears in Jones’ earliest diagrams (see figures 1 and 2 above). Harrington et al. (Reference Harrington, Palethorpe and Watson2000) found that strut had backed and lowered in the Queen's speech (but see further below); from the perspective of the whole twentieth century, the overall impression from the present set of data is that strut has indeed backed, but, contrary to Harrington et al.'s findings, it has raised and possibly moved into the non-peripheral part of the vowel space. A hint of this raising is present in the youngest generation of Hawkins & Midgley's (Reference Hawkins and Midgley2005) data, but their results showed a spread on the F1 dimension alone (approximating vowel height), with no suggestion of the corresponding backing of strut over the four age cohorts which is demonstrated here, also in the present re-analysis of Hawkins & Midgley's data.
The label ‘trap/strut rotation’ is thus proposed here for the historical trend seen in the present study. It represents a process whereby the lowering and backing of trap is accompanied by the backing and raising/centring of strut. While the movement of trap over the course of the twentieth century has been described in many publications (see the summary in Section 3 above), the historical trajectory of strut has remained elusive. This paper is the first to investigate the two vowel positions in coordination within the context of the short vowel system as a whole, and the first to base these observations on a large corpus of elicited and spontaneous speech recordings in real time. The sociophonetic methodology employed here, involving comparisons and measurements in two dimensions simultaneously, has proved crucial in helping to identify this integrated movement of two vowels. It is by choosing to view the vowel space as containing a related set of vowel positions that the coordinated trajectories of the trap and strut vowel over the twentieth century can be meaningfully described.
The lowering of the trap vowel observed here is moreover in accordance with Labov's Principle II on universal processes of vowel chain-shifting (Labov Reference Labov1994: 116) in its preliminary formulation in that volume: ‘in chain shifts, short vowels fall’. The raising of strut, however, obviously does not fit here; see also Torgersen & Kerswill's (Reference Torgersen and Kerswill2004: 39f.) description of a chain shift in Ashford which contradicts Labov's descriptions of patterns 3 and 4, which themselves derive from the three major principles of chain shifting as first formulated (Labov Reference Labov1994: 115–154). However, once the issue of peripherality is taken into account in the description of universal principles of diachronic vowel movement, a more promising interpretation of the rotation movement presented here becomes possible. It remains to be demonstrated in future whether part of the movement process of trap and strut over the course of the twentieth century was indeed related to peripherality, in that strut in RP did move to being non-peripheral, as is suggested by the diagrams presented in Section 6, If this proves to be so, Labov's more generalised formulation in Labov (Reference Labov1994: 601): ‘in chain shifts, peripheral vowels become more open and non-peripheral vowels become less open’ may indeed apply to trap and strut in RP respectively.
7.2 Exegesis: phonetic and sociolinguistic interpretive stances
This brings the discussion to a further point arising from the present re-examination of the data obtained from Harrington et al. (Reference Harrington, Palethorpe and Watson2000). The original study examined normalised values for stressed vowels from nine Christmas broadcasts made by Queen Elizabeth II, compared with speech recorded by female BBC broadcasters in the 1980s (from the MARSEC corpus; Deterding Reference Deterding1997, Roach et al. Reference Roach, Knowles, Varadi and Arnfield1993). It concluded that significant changes over time (determined using ANOVAs and post-hoc t-tests) could be found in formant values on the F2 and F1 axes. This was interpreted as suggesting that the Queen's speech had gradually moved closer in phonetic terms towards a more mainstream and less upper-class RP, at least in the specific vowel qualities examined here, through an opening and lengthening of the vowel space over the 30-year time span from the 1950s to the 1980s. The study provided a new perspective on possible variation over the individual's lifespan. Harrington et al.'s (Reference Harrington, Palethorpe and Watson2000) comparison of vowel formant values across real time has already become an influential study in phonetics; see also the study of changes in unstressed vowels in the same data in Harrington (Reference Harrington2006).
However, it is perhaps wise for sociolinguists to keep in mind just what the nature of these phonetic changes has and has not been. There are certainly significant phonetic differences in formant values to be observed in the data, especially in the degree of openness for the open vowels in absolute terms and vis-à-vis the close vowels. From a Labovian sociolinguistic perspective, however, it should be noted the trap/ strut configuration does not however show a radical realignment of the vowels’ relative positions over time, if we understand ‘relative position’ as being within the individual's short vowel system at any one point in time.
Figures 12–14 show the relative positions of trap and strut in the Queen's data over the three decades in question, with lines joining trap to strut in each decade. While the later trap and strut vowels are indeed lower and more back relative to the earlier ones in absolute terms, the juxtaposition of the two vowels at each period of time (whether it be the 1950s, 1960s or 1980s) remains similar, ranging from −18 degrees in the 1950s, +2 degrees in the 1960s data, and −11 degrees in the 1980s. That is, in this respect, the Queen's data fit with her age cohort in Hawkins & Midgley's (Reference Hawkins and Midgley2005) data, group 1, born in the period 1928–1936, and with some speakers from subsequent generations. However, the data do not reveal an obvious radical realignment of trap and strut by the 1980s, say, such that they come to resemble the later configurations, seen in Hawkins & Midgley's groups born after 1946, and the Cambridge interview data from younger speakers born after 1956. This is not to suggest that the changes observed in the Queen's speech are not significant, since they surely are in phonetic and statistical terms, according to the conventions of the discipline of phonetics. Nonetheless, this phonetic interpretation should not lead sociolinguistically-interested observers to overestimate the degree to which the Queen's individual's vowel system hereby has been shown to change configurationally across her lifetime. This point depends crucially on understanding the vowel system at any point in time as a connected set of related positions, a practice which is standard in sociophonetics. Figures 12–14 here reveal that, in configurational and thus in more sociolinguistically-relevant terms, the Queen's vowel data must more accurately be interpreted as stable and typical for her generation, rather than radically variable and untypical of her generation (and thus by association typical of later generations). This distinction has important consequences for the identification of genuine diachronic change.

Figure 12 Short vowel system for Christmas broadcast data from 1950s, Queen Elizabeth II (based on Harrington et al. Reference Harrington, Palethorpe and Watson2000).

Figure 13 Short vowel system for Christmas broadcast data from 1960s, Queen Elizabeth II (based on Harrington et al. Reference Harrington, Palethorpe and Watson2000).

Figure 14 Short vowel system for Christmas broadcast data from 1980s, Queen Elizabeth II (based on Harrington et al. Reference Harrington, Palethorpe and Watson2000).
8 Concluding remarks
The mode of analysis employed here, which is based on examining short vowel configurations over time, has provided a new perspective on the historical trajectory of the strut vowel in RP. It remains beyond the scope of the present paper, however, to determine what mechanisms may have provided the impulse here for the diachronic displacement of strut, and whether there is a likely external source such that we can document this as a result of dialect contact (Trudgill Reference Trudgill1986, Reference Trudgill2004). The question of demonstrating the non-peripherality of strut also deserves more attention, but is beyond the remit of this study. It is likely that the newer placement for strut has multiple origins, both language system-internal and social/external, in the terms usually employed within the Labovian paradigm (see e.g. Torgersen & Kerswill Reference Torgersen and Kerswill2004).
Because the data reported here stem from different recording situations and different genres of speech, comparability remains an important issue, as discussed in Section 1 above. Because the normalisation procedure and angle and distance calculations provide a considerable level of abstraction, they promise to be amenable to usage on data from disparate sources, settings and time frames. The circumstances under which important real-time comparisons can take place will always be less than ideal, but this should not deter investigators from the process. The considerable size of the sample is also a counterweight to the disparate nature of the data, as is the fact that recordings of spontaneous speech (in interviews, for example) give access to real-time variation which must be considered closer to the everyday processes of variation and change that affect speakers in the community. The challenge in the analysis of spontaneous data is partly that of finding methodologies which enable identification of reliable trends, and if researchers are to obtain a realistic picture of sound change embedded in the speech community, this challenge must be faced.
In conclusion, the data presented here are suggestive of an ongoing vowel change operating below consciousness, since continuous speech data and elicited data from similar age groups show similar patterns, most clearly in the oldest and youngest age groups. This historical change in the juxtaposition of the two vowels may thus prove to be independent of ‘formality’, ‘genre’ or ‘setting’ constraints, a candidate for systematic and exceptionless sound change. One tentative suggestion, which remains to be explored more fully in future studies, could be that the trap-strut rotation is part of the consequences of an anti-clockwise chain shift involving trap and foot, operating at present in regional varieties in Southern England (Torgersen & Kerswill Reference Torgersen and Kerswill2004), which as a consequence in the case of the RP accent is pushing strut into the non-peripheral part of the vowel space. This movement in the RP variety differs from the movement taking place in, e.g. Reading or central London, where strut seems to be becoming fully back, and not central (Torgersen, Kerswill, Fox & Cheshire Reference Torgersen, Kerswill, Fox and Cheshire2006).
The findings of the present paper provide a coherent and systematic account of the changing juxtapositions of trap and strut vowels observed diachronically in RP real-time data, by employing an innovative combination of sociolinguistic and phonetic methodologies. The challenge of extracting real time phonetic change from a mass of observable variable speech data is an exciting one that can only benefit from dialogue on methodology, best practice and analytical interpretations between practitioners of phonetics and sociolinguistics.
Acknowledgements
The author is much indebted to Paul Foulkes, David Deterding, Kirsty McDougall, Bernhard Fabricius, Dominic Watt, Paul Kerswill, Eivind Torgersen, Bent Preisler, Peter Trudgill, Nicolai Pharao, Peter Roach, Simon Arnfield, John Esling and two anonymous reviewers for assistance, extensive discussion and critique of this paper in its development from a poster presentation at BAAP 2006 in Edinburgh. Any errors remain the author's responsibility, however.
Appendix

Table A1 Full description of data samples with sources.

Table A2 Numbers of vowel tokens/data points for each average value.
Note: S = Speaker

Table A3 Average values for Formants 1 and 2 in Hertz, all speakers.
Note: S = Speaker

Table A4 Values used for each speaker in the S-centroid normalisation.
Note: S = Speaker; a-category = the vowel with the highest F1 in each individual speaker's vowel space


