Introduction
The history of life is marked by innumerable ecological trends for paleontologists to interpret. Diversity—both globally (Sepkoski 1981; Alroy et al. Reference Alroy, Aberhan, Bottjer, Foote, Fursich, Harries, Hendy, Holland, Ivany, Kiessling, Kosnik, Marshall, McGowan, Miller, Olszewski, Patzkowsky, Peters, Villier, Wagner, Bonuso, Borkow, Brenneis, Clapham, Fall, Ferguson, Hanson, Krug, Layou, Leckey, Nürnberg, Powers, Sessa, Simpson, Tomašových and Visaggi2008) and within individual assemblages (Bambach Reference Bambach1977; Powell and Kowalewski Reference Powell and Kowalewski2002; Bush and Bambach Reference Bush and Bambach2004)—has increased during the Phanerozoic, and these changes—in addition to disturbances small and large (Miller Reference Miller1998; Bambach et al. Reference Bambach, Knoll and Wang2004)—have likely forced important changes to the ecological structure (ecospace) of these biotas through time (Bambach Reference Bambach1983; Bambach et al. Reference Bambach, Bush and Erwin2007; Bush et al. Reference Bush, Bambach and Daley2007a; Novack-Gottshall Reference Novack-Gottshall2007b; Bush and Bambach Reference Bush and Bambach2011). Many of the ecological trends are so persistent and independently affect so many clades that it is difficult to argue they are not caused by fundamental ecological tendencies. For example, increases in tiering (Ausich and Bottjer Reference Ausich and Bottjer1982; Bottjer and Ausich Reference Bottjer and Ausich1986) and predation (Vermeij Reference Vermeij1987; Aberhan et al. Reference Aberhan, Kiessling and Fürsich2006; Huntley and Kowalewski Reference Huntley and Kowalewski2007; Bush and Bambach Reference Bush and Bambach2011) are so well documented that it seems obvious that ecospace has become a more enriched, more specialized, and ultimately more competitive landscape for organisms to coexist.
Yet documentation of a trend is insufficient to draw conclusions on the processes causing it (Stanley Reference Stanley1973b, Gould Reference Gould1988; McKinney Reference McKinney1990; McShea Reference McShea1994). This lesson was well learned after the Marine Biological Laboratory (MBL) collaborations (Raup et al. Reference Raup, Gould, Schopf and Simberloff1973; Raup and Gould Reference Raup and Gould1974; Schopf et al. Reference Schopf, Raup, Gould and Simberloff1975; Gould et al. Reference Gould, Raup, Sepkoski, Schopf and Simberloff1977; Schopf Reference Schopf1979), in which the use of simple stochastic models provided informative—and often counterintuitive—benchmarks to better interpret evolutionary rates, clade dynamics, diversity trends, and morphological evolution. Macroevolutionary studies have embraced this critical framework, and now routinely employ such null models, while allowing for consideration of a wide range of potential artifacts and process-driven models (e.g., Foote Reference Foote1991; Wagner Reference Wagner2000; Hunt Reference Hunt2006; Hannisdal Reference Hannisdal2007; Bapst Reference Bapst2013; Korn et al. Reference Korn, Hopkins and Walton2013; Wagner and Marcot Reference Wagner and Marcot2013; Alroy Reference Alroy2014; Wagner and Estabrook Reference Wagner and Estabrook2014; Hunt et al. Reference Hunt, Hopkins and Lidgard2015). The use of such stochastic models in evolutionary paleoecology is comparatively rare. The best known remains Valentine’s “tesserae model” (Reference Valentine1980; Walker and Valentine Reference Walker and Valentine1984), a simulation used to demonstrate that ecological diversification (i.e., that associated with the origin of major clades) was easier to achieve during intervals of empty ecospace.
Arguably, the main obstacle for their broader implementation is the lack of consensus on how modern ecological communities are structured (cf. Maurer Reference Maurer1999; Weiher and Keddy Reference Weiher and Keddy1999; Hubbell Reference Hubbell2001; Chase and Leibold Reference Chase and Leibold2003; Clark et al. Reference Clark, Dietze, Chakraborty, Agarwal, Ibanez, LaDeau and Wolosin2007; Rosindell et al. Reference Rosindell, Hubbell, He, Harmon and Etienne2012). Where such ecological models are used (e.g., Clark and McLachlan Reference Clark and McLachlan2003), their model assumptions and data have often been of a resolution or context not amenable to the data of deep-time paleontology (Bennington et al. Reference Bennington, DiMichele, Badgley, Bambach, Barrett, Behrensmeyer, Bobe, Burnham, Daeschler, van Dam, Eronen, Erwin, Finnegan, Holland, Hunt, Jablonski, Jackson, Jacobs, Kidwell, Kock, Kowalewski, Labandeira, Looy, Lyons, Novack-Gottshall, Potts, Roopnarine, Strömberg, Sues, Wagner, Wilf and Wing2009). Recent developments in ecology, however, have helped bridge these differences. The discipline of functional ecology (Keddy Reference Keddy1992b; Díaz and Cabido Reference Díaz and Cabido2001; Petchey and Gaston Reference Petchey and Gaston2002; McGill et al. Reference McGill, Enquist, Weiher and Westoby2006) has confirmed that organismal functional traits (i.e., those organismal characteristics that allow organisms to interact with their biotic and abiotic environment), manifested across multiple taxa and individuals, are as important to understanding community processes (or perhaps more so) as are phylogenetic relationships (taxonomic identity), morphology, abundance, and other characteristics of taxa individually. This discipline has also developed an impressive inventory of functional diversity (disparity) statistics (e.g., Villéger et al. Reference Villéger, Mason and Mouillot2008; Mouchet et al. Reference Mouchet, Villéger, Mason and Mouillot2010)—having goals identical with those of the study of morphological disparity—and hypotheses suited to testing with these statistics. Given the lengthy paleontological history of such functional inferences (Savazzi Reference Savazzi1999; Plotnick and Baumiller Reference Plotnick and Baumiller2000) and our discipline’s comfort with disparity concepts (Foote Reference Foote1996; Wills Reference Wills2001), such a confluence offers much potential for mutual insight between ecologists and paleoecologists (e.g., Villéger et al. Reference Villéger, Novack-Gottshall and Mouillot2011; Berke et al. Reference Berke, Jablonski, Krug and Valentine2014).
The processes (and models) addressed by functional ecologists are fundamentally similar to those studied by all community ecologists, of course, and are often conceptualized as models of community assembly rules that incorporate processes such as habitat filters (Podani Reference Podani2009; Kraft et al. Reference Kraft, Adler, Godoy, James, Fuller and Levine2015), competitive exclusion (Fargione et al. Reference Fargione, Brown and Tilman2003; Schwilk and Ackerly Reference Schwilk and Ackerly2005; Mouillot et al. Reference Mouillot, Dumay and Tomasini2007), or neutral settlement from regional pools (Hubbell Reference Hubbell2005; Rosindell et al. Reference Rosindell, Hubbell, He, Harmon and Etienne2012). Most of these studies evaluate hypothesized models with one or a few functional diversity metrics and often only test whether observed data are statistically different from those expected under the proposed model, typically based on a simple permutation test. This approach is reasonable, but it ignores that all functional diversity/disparity metrics contribute information on functional (ecospace) structure (Ciampaglio et al. Reference Ciampaglio, Kemp and McShea2001; Mouchet et al. Reference Mouchet, Villéger, Mason and Mouillot2010), and thus there is value in retaining all suitable metrics when possible. However, this multivariate approach requires new techniques to conduct model selection when one wishes to compare multiple models simultaneously.
In this first of two companion articles, I summarize four general models of community assembly (neutral, redundancy, partitioning, and expansion) that collectively characterize the main mechanisms inferred in structuring ecospaces, whether at the scale of ecological communities or shaping entire biotas throughout evolutionary timescales. Although they have been introduced elsewhere (Novack-Gottshall Reference Novack-Gottshall2006; Bush and Novack-Gottshall Reference Bush and Novack-Gottshall2012), here I synthesize their bases in ecological and evolutionary theory and describe their expected statistical dynamics. These models have the useful property that they can be distinguished by their relationships between species richness and these functional diversity/ecological disparity statistics. I also discuss their relevance to long-standing paleoecological trends and theories and conclude that although most trends in Phanerozoic ecology are consistent with one or more of the driven models, the necessary statistical tests required to substantiate these claims have not been conducted. In the follow-up article, I demonstrate how the models can be implemented as stochastic simulations, evaluate their performance under a range of ecospace frameworks (functional-trait spaces), introduce a novel method of multimodel inference that allocates relative support across multiple multidimensional models, and apply these methods to well-preserved assemblages from the Late Ordovician (type Cincinnatian).
Four Models of Ecological Diversification
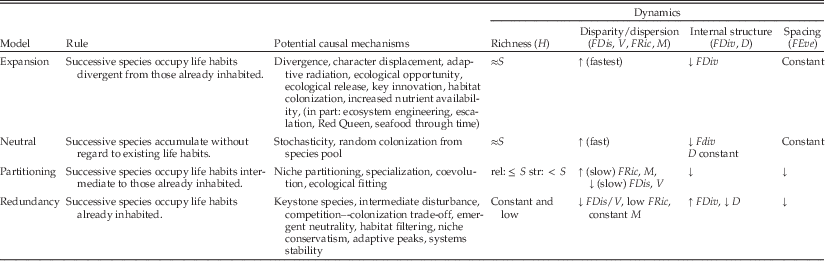
Four general models of ecological structure can result whenever the number of species increases within biotas. The statistical dynamics of these models are summarized in Table 1 and represented visually in Figure 1; which is based on simulations discussed in the companion article (Novack-Gottshall Reference Novack-Gottshall2016). Table 2 lists common multivariate ecological disparity/functional diversity statistics mentioned in the text, but other statistics ought to display dynamics similar to those summarized below. Resulting structural patterns (topologies) generated by these models can be produced by multiple mechanisms operating at different scales, including short-term ecological processes accompanying community assembly and longer-term processes involving evolution, speciation, and sorting. Because of these generalities, I describe a range of ecological and evolutionary mechanisms consistent with each model and relate each model to existing hypotheses in the community assembly, functional diversity, evolutionary diversification, and morphological disparity literature. I also discuss their relevance to long-standing perspectives on synoptic paleoecological trends across the scale of the Phanerozoic. For convenience, I describe the models in terms of species-level community assembly, but they could as easily be described in terms of large-scale evolutionary diversification. Descriptions of model dynamics summarized here are based on mathematical expectations but confirmed by the behavior of simulations in the companion article (Novack-Gottshall Reference Novack-Gottshall2016). For consistency, the term “rule” refers to the prescribed manner in which species are added to an assemblage (i.e., the assembly rule), and “model” refers to the resulting dynamics and topology (i.e., the dynamic statistical properties) resulting from the action of each rule.

Figure 1 Typical examples of simulated 50-species assemblages produced by the four model rules. Assemblages are plotted on a common nonmetric multidimensional-scaling ordination space of functional traits to allow comparative evaluation of model behavior. Five gray diamonds represent common “seed” species whose life habits were assigned stochastically using an 18-character (functional-trait space) ecospace framework (modified from Novack-Gottshall Reference Novack-Gottshall2007b), imposing a realistic constraint that each life habit could have at most two character states within a given character. Numbers illustrate the addition of five species to each assemblage (after seed species), with the remaining 40 species as hollow circles. All model rules, except redundancy, were enacted at 100%-rule following for each simulation; redundancy rules were weakened such that all successive species have habits 95% similar to preexisting ones; at 100% enactment, later life habits are limited to the “seed” species. A, In the neutral model, functional traits of all species are chosen independently at random, and the entire ecospace becomes inhabited through passive processes. B, In the redundancy model, new species have life habits similar to preexisting ones, producing an ecospace with distinct clusters. C, In the partitioning model, new species inhabit life habits intermediate to preexisting ones. This model can be enacted in a relaxed form (larger image), in which new species progressively fill in empty regions of the space originally defined by the seed species, and a strict form (inset), in which new species are restricted to gradients between preexisting species (typically leaving the center empty). D, In the expansion model, new species progressively inhabit novel life habits, producing an ecospace that expands its breadth over the simulation, while leaving the original region uninhabited.
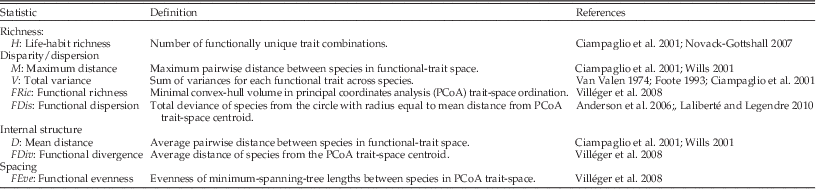
Table 1 Summary of the four models of ecological diversification. Model dynamics are based on simulations of community assembly, in which species’ life habits (functional traits) were assigned according to the model rules. However, the models are generalizable to any scale or process in which taxonomic richness increases. Listed mechanisms are non-exclusive, and include representative hypotheses spanning ecological and evolutionary processes. Models are sorted according to typical ranking of ecological disparity/functional diversity statistics (i.e., the expansion model generally has greatest values, whereas redundancy has the smallest). Strict (“str.”) and relaxed (“rel.”) refer to alternative implementations of the partitioning model. Statistics listed are those frequently used in the morphological disparity and functional diversity literature, although the general dynamics ought to occur for other statistics. See Table 2 for description and abbreviations of each statistic. Dynamics are reported as a function of increasing species richness (S); most dynamics reach asymptotic values at sample sizes of 50–200 species. When model rules are enacted in weakened form, dynamics will be intermediate between those of the neutral model and the relevant model.
Table 2 Description of statistics referred to in text and Table 1, listed according to the structural component that each statistic measures. These statistics are frequently used in the morphological disparity (Van Valen Reference Van Valen1974; Foote Reference Foote1993; Ciampaglio et al. Reference Ciampaglio, Kemp and McShea2001; Wills Reference Wills2001) and functional diversity literature (Mason et al. Reference Mason, Mouillot, Lee and Wilson2005; Anderson et al. Reference Anderson, Ellingsen and McArdle2006; Villéger et al. Reference Villéger, Mason and Mouillot2008; Laliberté and Legendre Reference Laliberté and Legendre2010; Mouchet et al. Reference Mouchet, Villéger, Mason and Mouillot2010; Mouillot et al. Reference Mouillot, Graham, Villéger, Mason and Bellwood2013), and further details on each statistic can be found in these references.
Redundancy Model
Model Dynamics
The model of redundancy (Table 1) occurs when successive species in a community occupy life habits that are identical to those previously occurring in that community. In a weakened form of the rule, successive life habits will be similar but not identical to preexisting ones. The general structural topology (Fig. 1B) is one of clusters of functionally identical, or similar, species (Bush and Novack-Gottshall Reference Bush and Novack-Gottshall2012). This model generally will yield the lowest values for disparity and functional diversity statistics of the four models. Life-habit richness (H) will remain at constant low values as species are added or increase slowly, depending on the strength of the rule’s enactment. Because of significant life-habit overlap among species, statistics that measure disparity/dispersion (such as total variance [V] and functional dispersion [FDis]) and spacing between species (such as functional evenness [FEve]) will decrease asymptotically as a function of increasing species richness. Because overall occupation of community ecospace is not enlarged by the addition of successive species, statistics sensitive to outliers such as maximum range [M] and functional richness [FRic]) will remain low and constant or increase slightly, depending on how often the rule is followed (i.e., model strength). Statistics sensitive to internal structure (i.e., clumpiness or inhomogeneity) will vary, depending on what structural component they measure. For example, functional divergence (FDiv) will increase, whereas mean functional distance between species (D) will decrease asymptotically.
Mechanisms
Classical ecological theory claims that competitive exclusion prevents true life-habit redundancy among species within local communities over long timescales (Gause Reference Gause1934; Fargione et al. Reference Fargione, Brown and Tilman2003; Loreau Reference Loreau2004; Purves and Turnbull Reference Purves and Turnbull2010). The recognition of substantial degrees of redundancy within living communities (Hubbell Reference Hubbell2005; Mouillot et al. Reference Mouillot, Villéger, Parravicini, Kulbicki, Arias-González, Bender, Chabanet, Floeter, Friedlander, Vigliola and Bellwood2014) is usually attributed to conditions that disrupt such competitive interactions. Well-known disruptive milieus include keystone species (Paine Reference Paine1966, Reference Paine1969; Terborgh Reference Terborgh2015), intermediate-scale environmental disturbances (Connell Reference Connell1978), and predation (Stanley Reference Stanley2008). Spatial structure, demographic stochasticity, and dispersal limitations—such as competition–colonization trade-offs that allow poorer competitors to resist extinction by virtue of higher dispersal rates—can maintain redundancy by restricting opportunities for local competitive interactions (Hastings Reference Hastings1980; Tilman Reference Tilman1994; Cornell Reference Cornell1999; Kinzig et al. Reference Kinzig, Levin, Dushoff and Pacala1999; Clark et al. Reference Clark, Dietze, Chakraborty, Agarwal, Ibanez, LaDeau and Wolosin2007; Olszewski Reference Olszewski2011). Such spatial and demographic complexities can be extended more broadly to mitigate most forms of competition (Hubbell Reference Hubbell2001), and this argument is discussed below in the neutral model. It is worth emphasizing that Hubbell’s (Reference Hubbell2005) assumption of “functional equivalency” in neutral theory is not the same concept as functional redundancy used here, as is clarified below. Recent simulations have demonstrated that complex competitive interactions involving many species can even promote redundancy (Scheffer and van Nes Reference Scheffer and van Nes2006), an idea later termed the emergent neutrality theory (Holt Reference Holt2006; Vergnon et al. Reference Vergnon, Dulvy and Freckleton2009, Reference Vergnon, van Nes and Scheffer2012). A common criticism of claims of apparent redundancy is that they are superficial, an artifact of focusing on relatively few traits that obscure recognition of ecologically more important differences (Clark et al. Reference Clark, Dietze, Chakraborty, Agarwal, Ibanez, LaDeau and Wolosin2007; Barabás et al. Reference Barabás, D’Andrea, Rael, Meszéna and Ostling2013; Kraft et al. Reference Kraft, Crutsinger, Forrestel and Emery2014).
Competitive interactions are not the only factor relevant to functional redundancy. A simple process such as habitat filtering (Southwood Reference Southwood1977; Keddy Reference Keddy1992a; Poff Reference Poff1997; Podani Reference Podani2009; Kraft et al. Reference Kraft, Adler, Godoy, James, Fuller and Levine2015), wherein the strictures of settlement to or existence within a particular habitat acts as a first-order control on community membership, can restrict community membership to species sharing particular functional traits. This can be considered a form of ecological canalization. Over longer, evolutionary timescales, redundancy can also result from niche conservatism accompanying speciation events (Mayr Reference Mayr1942, Reference Mayr1963; Peterson et al. Reference Peterson, Soberón and Sánchez-Cordero1999; Webb et al. Reference Webb, Ackerly, McPeek and Donoghue2002; Wiens and Graham Reference Wiens and Graham2005), although this is widely expected to result in subsequent divergence (Brown and Wilson Reference Brown and Wilson1956; Losos et al. Reference Losos, Leal, Glor, Queiroz, Hertz, Schettino, Lara, Jackman and Larson2002). A weakened form of redundancy is implicit in discussion of adaptive peaks and adaptive optima (Eldredge Reference Eldredge1989; Hansen Reference Hansen1997; Marshall Reference Marshall2006; Novack-Gottshall Reference Novack-Gottshall2007a; Mahler et al. Reference Mahler, Ingram, Revell and Losos2013). Convergent evolutionary pressures (Losos Reference Losos2011; Segar et al. Reference Segar, Pereira, Compton and Cook2013; Winemiller et al. Reference Winemiller, Fitzgerald, Bower and Pianka2015) can promote such functional redundancy, but convergence is typically only discussed when comparing geographically vicariant biotas, instead of within the individual communities considered here (but see Scheffer and van Nes Reference Scheffer and van Nes2006; Vergnon et al. Reference Vergnon, van Nes and Scheffer2012). It is clear that although reconciling functional redundancy with ecological theory remains among the most contentious areas of ecological research, there is little doubt that apparent redundancy is a common feature in many communities. The presence of such redundancy, regardless of its causes, has been claimed as an important factor for stabilizing ecosystems and increasing their resilience in the face of disturbances (Plotnick and McKinney Reference Plotnick and McKinney1993; Díaz and Cabido Reference Díaz and Cabido2001; Fonseca and Ganade Reference Fonseca and Ganade2001; Guillemot et al. Reference Guillemot, Kulbicki, Chabanet and Vigliola2011; Gerisch Reference Gerisch2014).
Paleoecological Examples
Few explicit discussions of functional redundancy exist in the paleoecological literature, perhaps because of its initially poor advocacy in classical ecological theory. In an editorial of this history, Stanley (Reference Stanley2008) argues that most benthic primary consumers are broadly functionally redundant but the high predation and disturbance prevents competitive exclusion from occurring. The concept of redundancy is most commonly invoked when discussing resilience of biotas in the face of environmental disturbances (Nagel-Myers et al. Reference Nagel-Myers, Dietl, Handley and Brett2013), especially mass extinctions. For example, a recent study (Foster and Twitchett Reference Foster and Twitchett2014) claimed little net ecological impact from the late Permian mass extinction because all but one life habit persisted globally into the Early Triassic. (But see Dineen et al. [Reference Dineen, Fraiser and Sheehan2014, Reference Dineen, Fraiser and Tong2015], who used a more multidimensional ecospace framework to demonstrate substantial differences in functional richness and evenness during these intervals.) Redundancy, or lack thereof, has been a broadly implicated causal factor in the extinction of individual lineages (Dick and Maxwell Reference Dick and Maxwell2015) and entire biotas during mass extinctions (Roopnarine et al. Reference Roopnarine, Angielczyk, Wang and Hertog2007; Mitchell et al. Reference Mitchell, Roopnarine and Angielczyk2012). At larger scales, many discussions of provinciality, sea level, habitable shelf area, and relationships between alpha and beta diversity as drivers of global diversity (e.g., Valentine and Moores Reference Valentine and Moores1970; Valentine Reference Valentine1973; Bambach Reference Bambach1977; Boucot Reference Boucot1983; Sepkoski 1988; Peters Reference Peters2008; Holland Reference Holland2010; Hautmann Reference Hautmann2014; Na and Kiessling Reference Na and Kiessling2015) have assumed implicitly that vicariant populations retained similar life habits during geodispersal.
Partitioning Model
Model Dynamics
The model of partitioning (Table 1) occurs when successive species in a community occupy life habits intermediate to those previously occurring in the community. The general structural topology (Fig. 1C) depends in part on how “intermediate” is defined. A “strict” definition produces distinct life-habit gradients, whereas a “relaxed” definition progressively fills in the central region of the ecospace (functional-trait space), although in both cases new species are occupying previously unoccupied portions of remaining ecospace (Bush and Novack-Gottshall Reference Bush and Novack-Gottshall2012). Dynamically, the slope of H on species richness will be <1 initially, reaching an asymptote when potentially inhabitable life-habit gradients become saturated. In the relaxed version, this rate is just slightly <1, whereas it is substantially less in the strict model. Because successive species inhabit more finely intermediate life habits, disparity metrics (such as V and FDis) will decrease asymptotically as a function of increasing species richness, generally with a faster decline in the more constrained strict version. Like the redundancy model, occupied ecospace will remain nearly constant and increase asymptotically at low to intermediate rates because overall community ecospace is not substantially enlarged by successive species. Statistics sensitive to internal structure (FDiv and D) will generally decrease asymptotically, as later species occupy life habits increasingly similar to previously inhabited ones. At large values of species richness, when relatively few unoccupied portions of intermediate ecospace still exist, the dynamics of partitioning models (and especially those implemented in weakened versions) may resemble those of weakened versions of the redundancy model because new species will be functionally rather similar to preexisting ones.
Mechanisms
Local competition among species for limited resources is widely expected to produce niche partitioning, a limiting similarity among species in their resource requirements (Gause Reference Gause1934; Hutchinson Reference Hutchinson1959; MacArthur and Levins Reference MacArthur and Levins1967; MacArthur Reference MacArthur1970; Schoener Reference Schoener1974; Fox Reference Fox1987). In a generalized sense, this partitioning is a form of resource specialization (Futuyma and Moreno Reference Futuyma and Moreno1988) that can take many forms, including dietary (Grant Reference Grant1986), foraging strategy (Schoener Reference Schoener1971; Stephens and Krebs Reference Stephens and Krebs1986), behavioral timing (Kronfeld-Schor and Dayan Reference Kronfeld-Schor and Dayan2003), habitat specialization (Hutchinson Reference Hutchinson1959; McPeek Reference McPeek1996), and polymorphisms within individual populations (Araújo et al. Reference Araújo, Bolnick and Layman2011). Coevolution (Ehrlich and Raven Reference Ehrlich and Raven1964; Futuyma and Slatkin Reference Futuyma and Slatkin1983; Brooks and McLennan Reference Brooks and McLennan1993), ecological fitting (Janzen Reference Janzen1985; Zamora Reference Zamora2000; Agosta and Klemens Reference Agosta and Klemens2008), and other mechanisms that facilitate diversification through specialized interactions with other taxa can also promote specialization (but these mechanisms could also promote redundancy if the functional traits of descendent species are phylogenetically conserved). Although these mechanisms span a range of scales and specific processes, the critical outcome in the model of partitioning is one of progressively closer packing of species according to life habits (i.e., specialization). Mathematical models have predicted unrealistically tight packing of species (Kinzig et al. Reference Kinzig, Levin, Dushoff and Pacala1999) in some circumstances, but Schwilk and Ackerly (Reference Schwilk and Ackerly2005) have shown this concern is ameliorated when demographic stochasticity (especially in immigration rate) and environmental heterogeneity occurs, both of which are predicted to increase the likelihood of limiting similarity. Partitioning has been relatively understudied by functional ecologists, but Mouillot et al. (Reference Mouillot, Dumay and Tomasini2007) found no evidence for partitioning in lagoonal fish communities.
Paleoecological Examples
Explicit tests of local-scale partitioning within individual fossil assemblages are rare, perhaps reflecting the expectation (Huntley et al. Reference Huntley, Yanes, Kowalewski, Castillo, Delgado-Huertas, Ibáñez, Alonso, Ortiz and Torres2008) that such local processes are unlikely to be recorded in the fossil record. Across synoptic scales, the most explicit discussion of niche partitioning in fossil communities involves tiering (Ausich and Bottjer Reference Ausich and Bottjer1982; Bottjer and Ausich Reference Bottjer and Ausich1986), in which benthic marine suspension feeders spanning many taxonomic groups were hypothesized to have subdivided epifaunal and infaunal microhabitats. Although their explanation for this partitioning includes multiple causes (including increasing body size and predator avoidance), I include it here because its primary mechanism is one of niche partitioning according to distance from seafloor. This pattern has been extensively demonstrated in paleocommunities (e.g., Peters and Bork Reference Peters and Bork1998; Morris and Felton Reference Morris and Felton2003; Wang et al. Reference Wang, Zhang, Holmer, Hu, Wang and Li2012; Brower Reference Brower2013; McLean and Lasker Reference McLean and Lasker2013).
James Valentine (Reference Valentine1969, Reference Valentine1995; Walker and Valentine Reference Walker and Valentine1984) has been the leading proponent of specialization as the dominant ecological trend in Phanerozoic diversification, a trend he termed “progressive canalization of ecospace” (1969). His conclusion was based primarily on the increasing proportion of lower taxa within higher taxonomic groups in the global biota, interpreting it as one of increasing Phanerozoic specialization, in which earlier genus-poor, presumably generalized classes were succeeded by genus-rich, more specialized classes. He later supported this conclusion using the stochastic tesserae model (1980; Walker and Valentine Reference Walker and Valentine1984), which demonstrated that logistic diversification within an empty ecospace should restrict later lineages to intermediate life habits. Although Valentine (Reference Valentine1973) conceded that the total ecospace of the marine biota has increased, the dominant pattern according to his model is one of increasing specialization.
This view of an ecologically generalized Cambrian biota was echoed by Sepkoski (Reference Sepkoski1979) in his analysis of early Paleozoic diversification, and he later developed this argument in his analysis of increasing beta diversity during the Paleozoic (Sepkoski 1988). Recent research on the Cambrian radiation (Na and Kiessling Reference Na and Kiessling2015), based largely on theoretical relationships between alpha, beta, and gamma diversity (Hautmann Reference Hautmann2014), reiterates that niche partitioning was an important contributor to the Cambrian radiation. Many aspects of post-Paleozoic diversification are hypothesized to have resulted from increasing specialization among motile predators (e.g., Vermeij Reference Vermeij1987; Bambach et al. Reference Bambach, Knoll and Sepkoski2002; Aberhan et al. Reference Aberhan, Kiessling and Fürsich2006; Stanley Reference Stanley2008), and Nürnberg and Aberhan (Reference Nürnberg and Aberhan2015) demonstrated a positive relationship between global diversity and environmental (habitat) specialization throughout the Phanerozoic. While the partitioning of ecospace implied by most of these paleoecological patterns was originally intended to explain global diversity patterns, all imply that progressive specialization should occur within individual assemblages, both as a cause of and as a response to increased species richness.
Expansion Model
Model Dynamics
The model of expansion (Table 1) occurs when successive species in a community occupy progressively more novel life habits that did not occur previously in the community. The general structural topology (Fig. 1D) is one of progressive divergence toward more extreme life habits (Bush and Novack-Gottshall Reference Bush and Novack-Gottshall2012). Except for FDiv, this model produces the largest statistical values of the four models. H will increase asymptotically at a rate faster than for any other model (including the neutral model) because the expansion model rule actively pursues novel life habits, constrained only by what life habits are deemed theoretically possible. The asymptote and rate of increase (or the slope for small sample sizes) will vary depending on the structure of the ecospace framework used, with the asymptote equal to the maximum number of unique life habits allowed by the framework. In those frameworks that allow less than approximately 5000 unique life habits (typically a result of specifying few numbers of functional traits), H will have an initial slope slightly <1 with species richness, whereas frameworks allowing more unique life habits will remain equal to sample size through approximately 200 species. Disparity statistics (V, M, FDis, FRic) will display the most rapid rates of increase as the extremes of the potential ecospace are explored, after which they will reach large asymptotes as the exploration of life habits attenuates. Statistics sensitive to internal structure will have varying dynamics, depending on the nature of the ecospace framework (see companion article [Novack-Gottshall Reference Novack-Gottshall2016] for details). For example, FDiv will typically decrease asymptotically (perhaps after rising during the initial phase of rapid expansion), whereas D will remain relatively constant or perhaps increase or decrease asymptotically. Evenness statistics (FEve) will likewise remain relatively constant or increase asymptotically if the life habits of originating species began the simulation clustered into a small region of the ecospace.
Mechanisms
The primary mechanism for the expansion model is one of active divergence among life habits. Within the context of community ecology, the basic mechanism promoting such novelty is niche divergence (Brown and Wilson Reference Brown and Wilson1956; MacArthur and Levins Reference MacArthur and Levins1967; Schluter Reference Schluter2000; Losos et al. Reference Losos, Leal, Glor, Queiroz, Hertz, Schettino, Lara, Jackman and Larson2002; Brousseau et al. Reference Brousseau, Bonal, Cigna and Scotti2013), which is often extrapolated to larger evolutionary scales to explain adaptive radiations (Schluter Reference Schluter2000; Losos Reference Losos2010). Alternative hypotheses, initially termed “forbidden species” or “checkerboard” patterns (Diamond Reference Diamond1975) but subsumed within the broader “niche-versus-neutral” debate (cf. Weiher et al. Reference Weiher, Freund, Bunton, Stefanski, Lee and Bentivenga2011), explain divergence patterns through biased immigration of species with niche traits not found previously within a community. Recent research on adaptive radiations suggests that many claims of character displacement are unsubstantiated (Stuart and Losos Reference Stuart and Losos2013) and that a shifting mosaic of adaptive peaks may be a better explanation than ecological divergence writ large (Estes and Arnold Reference Estes and Arnold2007; Harmon et al. Reference Harmon, Losos, Davies, Gillespie, Gittleman, Jennings, Kozak, McPeek, Moreno-Roark and Near2010). Whatever the cause, such diversifications are widely considered to result in elevated evolutionary rates during their initial phases, a pattern termed the “early-burst” model (e.g., Rabosky and Lovette Reference Rabosky and Lovette2008; Harmon et al. Reference Harmon, Losos, Davies, Gillespie, Gittleman, Jennings, Kozak, McPeek, Moreno-Roark and Near2010; Ingram et al. Reference Ingram, Harmon and Shurin2012; Wagner and Estabrook Reference Wagner and Estabrook2014; Knope et al. Reference Knope, Heim, Frishkoff and Payne2015), but widely discussed in the paleontological literature on evolutionary rates (Simpson Reference Simpson1944; Raup Reference Raup1983; Walker and Valentine Reference Walker and Valentine1984; Lee et al. Reference Lee, Soubrier and Edgecombe2013; Hautmann Reference Hautmann2014) and morphological disparity (Gould Reference Gould1991; Briggs et al. Reference Briggs, Fortey and Wills1992; Foote Reference Foote1994; Erwin Reference Erwin2007), especially in the context of the Cambrian and other fossil radiations. The statistical dynamics of the expansion model noted above fit these predictions well and are borne out in simulations.
Critical to all such concepts is the ecological-opportunity hypothesis (Gavrilets and Vose Reference Gavrilets and Vose2005; Losos Reference Losos2010; Mahler et al. Reference Mahler, Revell, Glor and Losos2010), which preconditions divergence on the availability of novel resources, previously uninhabited life habits, or ecological release from prior constraints. James Valentine has long advocated this idea (Valentine Reference Valentine1969, Reference Valentine1995; Walker and Valentine Reference Walker and Valentine1984; Erwin et al. Reference Erwin, Valentine and Sepkoski1987) to explain the uniqueness of the Cambrian radiation, and its roots go back to Darwin (Reference Darwin1859). The evolution of novel morphological (“key”) innovations (Stanley Reference Stanley1968; Erwin Reference Erwin1994; Hunter Reference Hunter1998; Gavrilets and Vose Reference Gavrilets and Vose2005; Vermeij Reference Vermeij2006) is a commonly inferred driver of such opportunities. Colonization of new habitats (or major changes to previous ones, either inhabited or regionally adjacent) is also thought to play an important role in divergence, as it can lead to increased nutrient and biogeochemical fluxes, novel ecosystem interactions, and ultimately new adaptive pressures (Losos et al. Reference Losos, Warheitt and Schoener1997; Price and Clague Reference Price and Clague2002; Herrel et al. Reference Herrel, Huyghe, Vanhooydonck, Backeljau, Breugelmans, Grbac, Van Damme and Irschick2008). The effects of such environmental changes are increasingly well studied in modern disturbed settings (Hooper et al. Reference Hooper, Chapin Iii, Ewel, Hector, Inchausti, Lavorel, Lawton, Lodge, Loreau and Naeem2005; Lotze et al. Reference Lotze, Lenihan, Bourque, Bradbury, Cooke, Kay, Kidwell, Kirby, Peterson and Jackson2006; Worm et al. Reference Worm, Barbier, Beaumont, Duffy, Folke, Halpern, Jackson, Lotze, Micheli and Palumbi2006; Kidwell Reference Kidwell2007, Reference Kidwell2015; Villéger et al. Reference Villéger, Miranda, Hernández and Mouillot2010; Boyd and Hutchins Reference Boyd and Hutchins2012; Mouillot et al. Reference Mouillot, Graham, Villéger, Mason and Bellwood2013), and frequently invoked for unique “natural experiments” throughout geological history (see below). Depending on how generally they are manifested, some niche-construction and ecosystem-engineering processes may also induce positive-feedback dynamics that result in inhabitation of novel portions of ecospace (Jones et al. Reference Jones, Lawton and Shachak1994, Reference Jones, Lawton and Shachak1997; Laland et al. Reference Laland, Odling-Smee and Feldman1999; Wright et al. Reference Wright, Jones and Flecker2002; Odling-Smee et al. Reference Odling-Smee, Laland and Feldman2003; Scott-Phillips et al. Reference Scott-Phillips, Laland, Shuker, Dickins and West2013; Berke Reference Berke2015). I also include escalation facilitated by new predators and Red Queen coevolution as examples of such positive-feedback mechanisms (Van Valen Reference Van Valen1973; Vermeij Reference Vermeij1987; Liow et al. Reference Liow, Van Valen and Stenseth2011) that can facilitate life in previously uninhabited portions of ecospace.
Note that my usage of “novel” in this context is distinct from the concept sometimes embodied by the term “specialized,” which I restrict to those new variations intermediate in some manner to preexisting traits (as represented above in the partitioning model); instead, here I use “novel” in the strict sense of life habits distinct and more extreme from those preexisting within the community. It is also worth emphasizing that not all key innovations, newly colonized habitats, or diversifications of newly originating taxonomic lineages must result in divergent, expansion dynamics (Erwin Reference Erwin2011). These events, if occurring as unique contingencies, are perhaps best not included in this model, which is intended as a generalized and persistent bias within diversifying biotas. Such contingency-driven patterns may be better cast as positive- or negative-feedback models (Bush and Novack-Gottshall Reference Bush and Novack-Gottshall2012), discussed in more detail below.
Paleoecological Examples
Like the partitioning model, most relevant paleoecological examples focus on synoptic Phanerozoic-scale trends instead of analyses of individual assemblages. Because diversity and inhabited ecospace have undoubtedly increased in all ecosystems since the Ediacaran and Cambrian (Bambach et al. Reference Bambach, Bush and Erwin2007; Bush et al. Reference Bush, Bambach and Erwin2011; Laflamme et al. Reference Laflamme, Darroch, Tweedt, Peterson and Erwin2013; Knope et al. Reference Knope, Heim, Frishkoff and Payne2015), most synoptic paleoecological hypotheses can be characterized as examples of the expansion model. The most cogent advocate for the role of continued expansion throughout the Phanerozoic is Richard Bambach (Reference Bambach1983, Reference Bambach1985), who compared the ecological strategies of Sepkoski’s (1981) three evolutionary faunas using the first-ever ecospace framework (functional-trait space), defined by diet, tiering, and activity. Because successive evolutionary faunas utilized greater numbers of life habits, his primary conclusion was that the evolution of novel adaptive strategies was a primary driver of taxonomic diversification. This general pattern has held up well to additional scrutiny (Bambach et al. Reference Bambach, Bush and Erwin2007; Bush et al. Reference Bush, Bambach and Daley2007a,Reference Bush, Kowalewski, Hoffmeister, Bambach and Daleyb, Reference Bush, Bambach and Erwin2011; Novack-Gottshall Reference Novack-Gottshall2007b; Bush and Bambach Reference Bush and Bambach2011; Knope et al. Reference Knope, Heim, Frishkoff and Payne2015), although Bambach has allowed a subsidiary role for specialization, especially for predators (Bambach Reference Bambach1983). He later expanded these ideas with his “seafood through time” theory (Bambach Reference Bambach1993), in which ecospace expansion was facilitated by improvements to organismal physiology and energetics, aided not only by mass extinctions (Knoll et al. Reference Knoll, Bambach, Canfield and Grotzinger1996, Reference Knoll, Bambach, Payne, Pruss and Fischer2007; Bambach et al. Reference Bambach, Knoll and Sepkoski2002;) and major environmental changes (Bambach Reference Bambach1999; Bush and Bambach Reference Bush and Bambach2011; Knope et al. Reference Knope, Heim, Frishkoff and Payne2015), but also as a persistent tendency during background intervals (Knoll and Bambach Reference Knoll and Bambach2000; Bush and Bambach Reference Bush and Bambach2011).
Another influential advocate of continuous innovation throughout time is Geerat Vermeij (Reference Vermeij1977) and his theory of enemy-driven escalation. Although initially envisioned to explain that Mesozoic predation-resistant adaptations—primarily thicker, more armored shells and increased mobility—were triggered by the evolution of durophagous predators (Vermeij Reference Vermeij1977; Vermeij et al. Reference Vermeij, Schindel and Zipser1981; Schindel et al. Reference Schindel, Vermeij and Zipser1982), the concept of asymmetric coevolution was later generalized by Vermeij to explain a wide range of performance-enhancing adaptations across all of life, including metabolic rates, bioturbation, vertebrate dentition, herbivory (Vermeij and Lindberg Reference Vermeij and Lindberg2000), body size, and planktonic habits (Signor and Vermeij Reference Signor and Vermeij1994), among many other innovations. The basic patterns have been exceptionally well documented, especially the trend of increasing frequency of (and presumably more disparate) predatory life habits during the Phanerozoic (Vermeij Reference Vermeij1987; Aberhan et al. Reference Aberhan, Kiessling and Fürsich2006; Kowalewski et al. Reference Kowalewski, Kiessling, Aberhan, Fürsich, Scarponi, Barbour Wood and Hoffmeister2006; Bambach et al. Reference Bambach, Bush and Erwin2007; Bush et al. Reference Bush, Bambach and Daley2007a; Huntley and Kowalewski Reference Huntley and Kowalewski2007; Novack-Gottshall Reference Novack-Gottshall2007b; Stanley Reference Stanley2008; Bush and Bambach Reference Bush and Bambach2011; Kosnik et al. Reference Kosnik, Alroy, Behrensmeyer, Fürsich, Gastaldo, Kidwell, Kowalewski, Plotnick, Rogers and Wagner2011). Evidence also exists for Phanerozoic increases in exploitation of other organisms as substrates or domiciles (Vermeij Reference Vermeij1987; Taylor and Wilson Reference Taylor and Wilson2003; Novack-Gottshall Reference Novack-Gottshall2007b). Vermeij’s comprehensive argument remains that the environment—primarily acting on productivity but also including an important role for energy-producing oxygenation (Vermeij Reference Vermeij2011)—and energy-intensive dominant taxa—primarily through their powerful effects on interacting taxa—are the primary factors facilitating opportunities for evolutionary novelties and controlling the structure of ecological (economic) systems (Vermeij Reference Vermeij1995, Reference Vermeij1999, Reference Vermeij2011, Reference Vermeij2013). In his perspective, mass extinctions, smaller disruptions, and other historical events can affect the timing of these system-wide reorganizations (both positively or negatively), but there exists a persistent tendency for such improved performance throughout the history of life (Vermeij Reference Vermeij1987). Although his explanations are not phrased in the terminology of expansion used herein, his focus on performance-enhancing innovations driving revolutionary ecological reorganizations is consistent with this model.
Most of these claims have been demonstrated at synoptic scales, but Bambach (Reference Bambach1977), Vermeij (Reference Vermeij1987, Reference Vermeij2008), and others have repeatedly encouraged their application to local assemblages. Many such studies have been conducted on predation and escalation dynamics (e.g., Schindel et al. Reference Schindel, Vermeij and Zipser1982; Hansen and Kelley Reference Hansen and Kelley1995; Hoffmeister and Kowalewski Reference Hoffmeister and Kowalewski2001; Kelley et al. Reference Kelley, Kowalewski and Hansen2003; Kelley and Hansen Reference Kelley and Hansen2006; Huntley and Kowalewski Reference Huntley and Kowalewski2007; Kowalewski and Leighton Reference Kowalewski and Leighton2007; Sessa et al. Reference Sessa, Bralower, Patzkowsky, Handley and Ivany2012; Tyler et al. Reference Tyler, Leighton, Carlson, Huntley and Kowalewski2013). More studies need to be conducted examining ecospace and functional traits at local scales; examples include Walker and Laporte (Reference Walker and Laporte1970), Levinton and Bambach (Reference Levinton and Bambach1975), Radenbaugh and McKinney (Reference Radenbaugh and McKinney1998), Behrensmeyer et al. (Reference Behrensmeyer, Stayton and Chapman2003), Bambach et al. (Reference Bambach, Bush and Erwin2007), Xiao and Laflamme (Reference Xiao and Laflamme2009), Bush et al. (Reference Bush, Bambach and Erwin2011), Villéger et al. (Reference Villéger, Novack-Gottshall and Mouillot2011), Laflamme et al. (Reference Laflamme, Darroch, Tweedt, Peterson and Erwin2013), Mitchell and Makovicky (Reference Mitchell and Makovicky2014), Miller et al. (Reference Miller, Behrensmeyer, Du, Lyons, Patterson, Tóth, Villaseñor, Kanga and Reed2014), Dineen et al. (Reference Dineen, Fraiser and Sheehan2014, Reference Dineen, Fraiser and Tong2015), and O’Brien and Caron (Reference O’Brien and Caron2015).
Biotic responses to habitat colonization and transformation that have occurred throughout the Geozoic history of life (sensu Kowalewski et al. Reference Kowalewski, Payne, Smith, Wang, McShea, Xiao, Novack-Gottshall, McClain, Krause, Boyer, Finnegan, Lyons, Stempien, Alroy and Spaeth2011) remain a major focus of paleoecology and biogeochemistry and are widely expected to drive ecospace expansion. Examples include infaunalization (Thayer Reference Thayer1979; Tarhan and Droser Reference Tarhan and Droser2014; Kloss et al. Reference Kloss, Dornbos and Chen2015); creation of marine reefs and hardgrounds (Guensberg and Sprinkle Reference Guensberg and Sprinkle1992; Wood Reference Wood1993; Taylor and Wilson Reference Taylor and Wilson2003; Servais et al. Reference Servais, Owen and Harper2010); colonization of the open ocean (Signor and Vermeij Reference Signor and Vermeij1994; Butterfield Reference Butterfield1997; Klug et al. Reference Klug, Kröger, Kiessling, Mullins, Servais, Frýda, Korn and Turner2010); terrestrialization, plant diversification, and concomitant changes to weathering and erosion (Algeo and Scheckler Reference Algeo and Scheckler1998; Bateman et al. Reference Bateman, Crane, DiMichele, Kenrick, Rowe, Speck and Stein1998; Bambach Reference Bambach1999; Labandeira Reference Labandeira2005; Sahney et al. Reference Sahney, Benton and Falcon-Lang2010; Zanne et al. Reference Zanne, Tank, Cornwell, Eastman, Smith, FitzJohn, McGlinn, O’Meara, Moles, Reich, Royer, Soltis, Stevens, Westoby, Wright, Aarssen, Bertin, Calaminus, Govaerts, Hemmings, Leishman, Oleksyn, Soltis, Swenson, Warman and Beaulieu2013; Edwards et al. Reference Edwards, Cherns and Raven2015; Sundue et al. Reference Sundue, Testo and Ranker2015); and many other biogeochemical revolutions (Bambach Reference Bambach1993; Vermeij Reference Vermeij1995; Martin Reference Martin1996; Bush and Pruss Reference Bush and Pruss2013; Allmon and Martin Reference Allmon and Martin2014). Although these environmental changes are not required to result in novel life habits and ecospace expansion, such an invocation is implicit in most discussions (e.g., Droser et al. Reference Droser, Bottjer and Sheehan1997; Bambach Reference Bambach1999; Bush and Bambach Reference Bush and Bambach2011; Vermeij Reference Vermeij2011).
Neutral Model
Model Dynamics
Unlike the previous three driven (or active) models (sensu McShea Reference McShea1994), community membership in the neutral model (Table 1) occurs without regard to life habit. It is a passive model of life-habit diversification (Bush and Novack-Gottshall Reference Bush and Novack-Gottshall2012) that can serve as a process-free null model (Gotelli and Graves Reference Gotelli and Graves1996). Unlike the three driven models, in which the functional traits of later species depend on the traits of species already present within a biota, the neutral model is in essence non-Markovian in that species are added independently and their functional identities are ignored. The general structural topology (Fig. 1A) is one of random inhabitation of life habits, in which most of the ecospace becomes inhabited at high levels of species richness, given sufficient numbers of species (Bush and Novack-Gottshall Reference Bush and Novack-Gottshall2012). Similar to other scenarios involving passive and driven models (Stanley Reference Stanley1973b; Gould Reference Gould1988; McShea Reference McShea1994; Wang Reference Wang2001; Hunt Reference Hunt2006), the dynamics of the neutral and driven expansion (but not other) models are often quite similar; sufficiently powerful analyses are needed to discern them. As in the expansion model, H will increase asymptotically at a slope close to 1 with species richness, becoming saturated as the number of potential life habits allowed by the ecospace framework is exhausted; the rate of increase will be very slightly less than that in the expansion model (although the difference will be negligible except for analyses with high statistical power). Disparity statistics (V, M, FDis, FRic) will also increase asymptotically until number of life habits becomes saturated, but generally at a rate less than that for the expansion model (i.e., these statistical dynamics offer greater opportunity to distinguish the expansion and neutral models than do the dynamics of H), the difference also a function of the number of life habits allowed by the ecospace framework. Statistics sensitive to internal structure will have varying dynamics, with FDiv generally decreasing (or increasing, if originating species share similar functional traits/life habits and begin in a small region of ecospace). D will remain approximately constant, as will evenness statistics (FEve), as successive species continue to have life habits unrelated to (or assigned at random from) prior species.
Mechanisms
In large part a reaction to the assembly-rule debate (Diamond Reference Diamond1975), community ecologists have exerted enormous effort developing null models that are both appropriate and sufficiently statistically powerful to distinguish relevant models of community assembly (cf. Connor and Simberloff Reference Connor and Simberloff1979; Gotelli and Graves Reference Gotelli and Graves1996; Weiher and Keddy Reference Weiher and Keddy1999; Gotelli Reference Gotelli2000; Gotelli and Ulrich Reference Gotelli and Ulrich2012). This methodological focus has only intensified in response to Hubbell’s (Reference Hubbell2001) neutral theory, which has refocused the assembly debate to one of niche-versus-neutral models. Functional ecology has offered important perspectives (and powerful statistics) on this debate, and null models are generally tested using simulations or permutation tests of individual statistics suitable to a particular model.
Recent sensitivity analyses (Mouchet et al. Reference Mouchet, Villéger, Mason and Mouillot2010; de Bello Reference de Bello2012; Maire et al. Reference Maire, Grenouillet, Brosse and Villéger2015) have demonstrated how performance of functional ecology null models depends highly on data structure (such as the number and type of functional traits used), characteristics of the species pool, and power of statistics used to discriminate assembly models. Defining the proper species pool for an analysis is a particularly important decision (Cornell Reference Cornell1999; Patzkowsky and Holland Reference Patzkowsky and Holland2003; Knope et al. Reference Knope, Forde and Fukami2012; Cornell and Harrison Reference Cornell and Harrison2014; Gerhold et al. Reference Gerhold, Cahill, Winter, Bartish and Prinzing2015; Mittelbach and Schemske Reference Mittelbach and Schemske2015). It is now generally recommended that tests be tailored to each particular study (de Bello Reference de Bello2012)—not prohibitive given modern computing resources (cf. Kowalewski and Novack-Gottshall Reference Kowalewski and Novack-Gottshall2010)—and that statistical conclusions be drawn using appropriate criteria (White et al. Reference White, Rassweiler, Samhouri, Stier and White2014). A major unresolved question is how to incorporate multiple statistics into single model-selection tests, as many statistics are correlated (Mouchet et al. Reference Mouchet, Villéger, Mason and Mouillot2010) and there often exists ambiguity about which statistic—if one exists at all—is most appropriate for distinguishing the range of assembly models under consideration (Ciampaglio et al. Reference Ciampaglio, Kemp and McShea2001; Mouchet et al. Reference Mouchet, Villéger, Mason and Mouillot2010; Maire et al. Reference Maire, Grenouillet, Brosse and Villéger2015). Another concern is that most tests only consider a single model, either supporting a stochastic process or rejecting it in favor of an alternative model; few functional ecology studies consider multiple-candidate models and explicit model-selection criteria (Burnham and Anderson Reference Burnham and Anderson2002; Johnson and Omland Reference Johnson and Omland2004; Grueber et al. Reference Grueber, Nakagawa, Laws and Jamieson2011). The companion article (Novack-Gottshall Reference Novack-Gottshall2016) suggests a novel and powerful solution to this impasse: the use of classification trees as a form of model selection.
The stochastic neutral model introduced here occurs when the other three driven models are not enacted, and it is formulated in a manner different from many used in community ecology and functional diversity. Rather than drawing species from a (biologically real) species pool, it creates samples of species whose life habits (functional traits) are drawn at random and independently from a theoretical ecospace framework/functional-trait space (e.g., Novack-Gottshall Reference Novack-Gottshall2007b). This process allows any theoretically possible life habit to exist within the neutral sample (similar to the process used in Raup and Gould Reference Raup and Gould1974; Foote Reference Foote1999). Although many of these life habits are going to be logically impossible or perhaps never realized in biological history (Hutchinson Reference Hutchinson1957; Valentine Reference Valentine1969; Bambach Reference Bambach1983; Bush et al. Reference Bush, Bambach and Daley2007a), this null model is useful in identifying important constraints (such as patterns of covariation among traits, empty regions of the ecospace, or perhaps particular habitat filters) that restrict real organisms from actual communities (Raup Reference Raup1966; Seilacher Reference Seilacher1970; Thomas and Reif Reference Thomas and Reif1993). The model can be modified (see companion article [Novack-Gottshall Reference Novack-Gottshall2016]) to weight the assignment of functional traits based on their frequency of occurrence in a supplied species pool and thus to provide better approximations to the realized ecospace of the sampled species pool. It can also be modified to serve as a simple permutation test, the null model used in most functional diversity analyses, if desired, by forcing sampling to occur only from a species pool.
It is worth emphasizing that this neutral model, aside from acting as a process-free, non-Markovian null model in which functional differences are ignored, is mechanistically different from the neutral model of Hubbell (Reference Hubbell2005, Reference Hubbell2006; Rosindell et al. Reference Rosindell, Hubbell, He, Harmon and Etienne2012). The two primary characteristics in Hubbell’s (Reference Hubbell2005, Reference Hubbell2006) model are “functional equivalence” among species in their per-capita demographic rates (i.e., birth, death, dispersal, speciation rates) and a spatially structured habitat in which dispersal from a regional species pool only occurs when a patch becomes available. The four models described herein focus explicitly on the functional traits of organisms: the neutral model ignores these traits (operationally using a different definition of “functional equivalence”) when assembling communities (that is, it is a “neutral theory,” sensu Rosindell et al. Reference Rosindell, Hubbell, He, Harmon and Etienne2012), whereas the three driven models can be considered models of “niche theories” (sensu Rosindell et al. Reference Rosindell, Hubbell, He, Harmon and Etienne2012). The four models herein also lack spatial structure; any species whose life habit is allowed by the ecospace framework and model rules (or in the case of the neutral model, any life habit allowed by the ecospace framework) is guaranteed entry into the community.
Paleoecological Examples
Paleontology has a long history—stemming in large part from the MBL simulations (Raup et al. Reference Raup, Gould, Schopf and Simberloff1973; Raup and Gould Reference Raup and Gould1974; Gould et al. Reference Gould, Raup, Sepkoski, Schopf and Simberloff1977)—of using stochastic null models to test whether observed patterns differ from those expected by stochastic processes. Valentine’s tesserae model (Reference Valentine1980; Walker and Valentine Reference Walker and Valentine1984) simulated stochastic taxonomic diversification within an empty ecospace. The simulation demonstrated that major taxonomic groups (those with distinct functional traits) would arise quickly at first, but subsequent originations would only represent diversification within these early clades. Once equilibrium species richness was reached, new species (and thus new life habits) could only be added after extinction of prior species. By comparing the per-species rate of extinction within a clade (a measure of species turnover) to that clade’s intrinsic rate of speciation, they were able to estimate that approximately 30% of the potential ecospace was unoccupied at any time. Although they interpreted the pattern in terms of progressive specialization, the general patterns are likely similar to the dynamics described above for the neutral model, albeit their analyses explicitly incorporated a Markovian phylogenetic structure.
This tradition of stochastic modeling has been well embraced in studies of morphological disparity (e.g., Foote Reference Foote1991; Ciampaglio et al. Reference Ciampaglio, Kemp and McShea2001; Korn et al. Reference Korn, Hopkins and Walton2013; Mitchell and Makovicky Reference Mitchell and Makovicky2014) but has only rarely been employed in analyses of ecological disparity. The only two studies (that I am aware of) include Mitchell and Makovicky (Reference Mitchell and Makovicky2014), who demonstrated that the functional diversity (ecological disparity) of Early Cretaceous bird assemblages was significantly lower than that for later bird assemblages, which expanded into unfilled portions of the Mesozoic ecospace. Miller et al. (Reference Miller, Behrensmeyer, Du, Lyons, Patterson, Tóth, Villaseñor, Kanga and Reed2014) demonstrated that the functional ecospace of the Amboseli mammalian death assemblage was statistically indistinguishable from a random draw from the living species pool, despite a bias toward larger species in the death assemblage.
Other Models
The four models discussed above can serve as informative and generalized end members of a wide spectrum of patterns that might result from ecological and evolutionary processes, but they are not intended to be exclusive (cf. Foote Reference Foote1996). Others have been introduced in the paleontological literature and are briefly discussed here. The contraction model (Bush and Novack-Gottshall Reference Bush and Novack-Gottshall2012) occurs when ecospace contracts. Especially relevant to discussion of extinctions, it could serve as a useful model when considering any reduction in species richness (Mouillot et al. Reference Mouillot, Graham, Villéger, Mason and Bellwood2013). Depending on the extent of functional selectivity and taxonomic loss involved, the dynamics are expected to follow the same as those presented above, but in reverse. Positive- and negative-feedback models (Bush and Novack-Gottshall Reference Bush and Novack-Gottshall2012) occur when the introduction of one life habit influences the range of life habits other taxa can inhabit, either through ecosystem engineering, habitat modification, or other processes (e.g., for discussion of ecosystem engineering in the context of the Ediacaran–Cambrian radiation, see Erwin et al. Reference Erwin, Laflamme, Tweedt, Sperling, Pisani and Peterson2011; Erwin and Tweedt Reference Erwin and Tweedt2011; Laflamme et al. Reference Laflamme, Darroch, Tweedt, Peterson and Erwin2013; Darroch et al. Reference Darroch, Sperling, Boag, Racicot, Mason, Morgan, Tweedt, Myrow, Johnston, Erwin and Laflamme2015). These feedback models can be envisioned as particular forms of the expansion and contraction model, but ones in which subsequent life habits are biased toward particular regions of the ecospace. They could be modeled as mixtures of the above models by specifying a change in model rules (and/or modification of the ecospace framework) at a particular point in a simulation or by adding linkages between functional traits. A migration model (Dick and Maxwell Reference Dick and Maxwell2015) has also been introduced recently, in which there is a wholesale shift in the occupation of ecospace; this model shares some similarity with the feedback models but lacks an obvious candidate for what causes the shift to occur. It could be modeled by allowed the ecospace framework to change (either in a specified manner or through a Brownian motion random walk) during a simulation. Inclusion of such phylogenetic structure would form a useful and interesting modification to the four models above, which currently have been formulated to focus only on functional identities of species and not their phylogenetic relatedness. For example, depending on implementation, inclusion of phylogenetic structure might cause the dynamics of all models to approach the redundancy model, as phylogenetic conservatism further constrains the exploration of ecospace. Because of their reliance on particular contingencies of timing, effect, and implementation, the variants discussed here are less generalizable than the four simpler models that are the focus of this article, and their predicted dynamics would likely vary, depending on the particular processes, interactions, and constraints involved.
Distinguishing among the Models: Trends in Phanerozoic Marine Ecological History
These four general models of ecological diversification can accommodate a wide range of processes in ecological and evolutionary theory (Table 1) and can be applied to any temporal or spatial scale at which these processes might operate, from individual assemblages to the entire biosphere. Their dynamics offer a useful benchmark when interpreting patterns of ecospace (functional) utilization. In particular, statistics used in morphological (ecological) disparity and functional diversity studies provide easily measured and informative metrics for identifying these models. In the discussion that follows, I summarize the most efficient ways to distinguish these models, emphasize important (and sometimes overlooked) dynamics, and discuss (sometimes playing devil’s advocate) how these dynamics may inform past and future analyses of ecological disparity.
Each of these four models produces predictable dynamics as a function of species richness. Most statistics, across models, display asymptotic behaviors, rising or falling quickly at low sample sizes as ecospace is colonized and reaching asymptotes as the model rules follow their course and the ecospace becomes saturated. Thus, evidence of such behavior, by itself, is insufficient to identify the process producing the pattern. In general, the expansion model produces the largest values for disparity and evenness statistics, followed closely by the neutral model, and the redundancy model tends toward the lowest values. Partitioning model dynamics are intermediate, with the strict version generally displaying lower values than its relaxed counterpart because of its more tightly constrained behavior. If models are followed in weakened forms, the dynamics will converge toward those of the neutral model.
The particular value for any statistic by itself is uninformative; it is the dynamics across varying levels of taxonomic richness that are needed to distinguish each model. It is critical that simulations are conducted—for each distinct ecospace framework used, and perhaps for each analysis—because the statistical power to distinguish the dynamics of each model depends on the data structure of the ecospace framework used (e.g., the number and type of functional traits) and to a lesser extent how each model is implemented (Mouchet et al. Reference Mouchet, Villéger, Mason and Mouillot2010; de Bello Reference de Bello2012; Maire et al. Reference Maire, Grenouillet, Brosse and Villéger2015). See companion article (Novack-Gottshall Reference Novack-Gottshall2016) for additional details on variation in dynamics using different ecospace frameworks and recommendations for implementing simulations and conducting model selection.
Guidelines, however, do exist to assist distinguishing these models in general circumstances (Table 1). The most diagnostic criterion for the redundancy models is having life-habit richness (H) values far lower than species richness (and especially so if relatively constant). Because this behavior is not expected in most actual circumstances, the redundancy model can also be distinguished by the combination of generally low H values and declining or low, nearly constant disparity values. This model can also be visually detected by the presence of discrete clumps of life habits in ordinations of the functional-trait space (Fig. 1). The partitioning model is diagnosed by generally declining trends in all statistics (except for certain disparity statistics, such as FRic and M, that will increase slowly) and relatively constrained ecospace occupation in ordinations, especially if linear gradients are present. The tightly restricted occupation of ecospace for the redundancy and partitioning models can present challenges to distinguishing these models in practice, especially when the rules for one or both models are implemented in a weakened state. In large samples, there will be very tight packing of life habits in both models. The primary distinction (aside from their fundamentally different causes) is the degree of differentiation among life habits; in redundancy, there exist discrete spaces between clumps, whereas life habits for partitioning are more continuously distributed. This behavior causes H to be less for the redundancy model and some disparity statistics (such as FRic and M) to have contrasting dynamics, although the differences may be subtle.
The dynamical similarities (Table 1) between the driven expansion model and the passive neutral model are worth discussing in more detail given their opposite causes. In both cases, overall ecospace enlarges as new life-habit combinations occur, increasing both the maximum range and dispersion of the biota. The rate of increase will be slightly greater for the expansion model, but the difference will only be able to be distinguished using powerful statistical methods (or large ecospace frameworks with many characters). Both models will also share generally constant evenness dynamics. Notably, sensitivity analyses in the companion article (Novack-Gottshall Reference Novack-Gottshall2016) demonstrate that the Bush and Bambach ecospace framework (Bambach et al. Reference Bambach, Bush and Erwin2007; Bush et al. Reference Bush, Bambach and Daley2007a, Reference Bush, Bambach and Erwin2011; Bush and Bambach Reference Bush and Bambach2011) may be insufficiently powerful to distinguish these two models statistically. In ordinations of the driven expansion model (Fig. 1), early species will typically have centrally located positions, with successive species in more extreme positions; the centroid will often (but not always) be empty as the model progresses. Species will also disperse from central positions in the neutral model, but the centroid will typically be occupied and later life habits will occur throughout the ecospace. This behavior, at least for small to moderately large sample sizes, mimics McShea’s (Reference McShea1994) “test of the minimum” for distinguishing passive from driven models.
Because biotic ecospace has expanded through the Geozoic, both at the scale of individual assemblages (Bambach et al. Reference Bambach, Bush and Erwin2007; Bush et al. Reference Bush, Bambach and Erwin2011; Villéger et al. Reference Villéger, Novack-Gottshall and Mouillot2011; Mitchell and Makovicky Reference Mitchell and Makovicky2014) and throughout the entire biosphere (Bambach Reference Bambach1983; Bush et al. Reference Bush, Bambach and Daley2007a; Novack-Gottshall Reference Novack-Gottshall2007b; Bush and Bambach Reference Bush and Bambach2011), there is broad consensus for the expansion model and its mechanism of novel divergence as a dominant pattern for the history of life. In particular, Bush et al. (Reference Bush, Bambach and Daley2007a), using abundance data from individual marine assemblages, demonstrated significant increases in individual functional traits during the Phanerozoic. Using the test of the minimum, they claimed that the predation pattern was consistent with a diffusional process (because predators remained uncommon within assemblages throughout time), whereas the patterns for increasing infaunality among suspension feeders and active motility were more consistent with driven processes (because most animals in modern assemblages are motile and most suspension feeders are infaunal). Bush and Bambach later (2011) claimed similar tendencies for increases in energetics and ability of animals to disturb other animals in their habitat (often caused by an interaction between motility and infaunality). There is little reason to question the veracity of these patterns given their overwhelming empirical (Vermeij Reference Vermeij1987; Aberhan et al. Reference Aberhan, Kiessling and Fürsich2006; Huntley and Kowalewski Reference Huntley and Kowalewski2007; Novack-Gottshall Reference Novack-Gottshall2007b; Bush and Bambach Reference Bush and Bambach2011) and theoretical support (Vermeij Reference Vermeij1987, Reference Vermeij2011, Reference Vermeij2013; Stanley Reference Stanley2008).
But a similar argument could be made in support of the model of redundancy, in which ecospace exists as clusters of crowded, canalized clumps. It is interesting to note that the modal marine life habits have not changed throughout the Phanerozoic. Whether examined taxonomically at the scale of Sepkoski’s three evolutionary faunas (Bambach Reference Bambach1983, Reference Bambach1985) or at finer scales (Bush and Bambach Reference Bush and Bambach2011), including proportional occurrences in local assemblages or across global aggregates (Bush et al. Reference Bush, Bambach and Daley2007a; Novack-Gottshall Reference Novack-Gottshall2007b), most marine animals have always been either epifaunal, attached suspension feeders; shallow infaunal, mobile deposit feeders; or mobile predators or algae eaters. The recurrence of these canonical life habits across multiple taxonomic groups throughout the Geozoic—despite many variations on the themes and supplemented by changes in how these life habits have been enacted—could be claimed as evidence that these strategies are ecological attractors (sensu Thomas and Reif Reference Thomas and Reif1993; Wagner and Erwin Reference Wagner and Erwin2006), adaptively basic ways of living essential to how marine communities function. The relatively few life habits tallied—in all attempts to comprehensively do so thus far—remain trivially low compared with the number of life habits that is at least theoretically possible given the number of species represented in such ecospace frameworks (cf. Kowalewski and Finnegan Reference Kowalewski and Finnegan2010). This low ratio provides compelling evidence that the redundancy model (or at least a weakened version of it) should be considered a viable candidate model for life’s history.
A compelling argument could as easily be made for the partitioning model, in which progressive specialization is the overriding tendency. The strongest evidence is the markedly linear gradients found in an ordination of the life habits of Paleozoic (Cambrian–Devonian) and Recent marine taxa (Novack-Gottshall Reference Novack-Gottshall2007b: Figs. 4,5). Not surprising, the end members of these gradients fall within the three canonical strategies just mentioned. Much of the gradation is a result of variation in body size and tiering, but it also reflects transitions in mobility, substrate relationships, and food preferences, which could be interpreted as intermediately specialized variations on these basic strategies. Similar linear patterns are also apparent in the occupation of “cubes” in the Bush and Bambach framework (Bambach et al. Reference Bambach, Bush and Erwin2007; Bush et al. Reference Bush, Bambach and Daley2007a, Reference Bush, Bambach and Erwin2011; Bush and Bambach Reference Bush and Bambach2011), especially in the categories of suspension feeding, predation, and motility, all of which gain progressively more variation throughout the Phanerozoic (i.e., the lines of cubes become more “connected” to adjacent cubes through time). Similar patterns of increased packing have been claimed for Phanerozoic bivalves (Mondal and Harries Reference Mondal and Harries2015): diversification after the Ordovician radiation involved closer packing among life habits, with bivalves never inhabiting more than ~30% of the available ecospace. Many of the best-documented paleoecological patterns—predation (Stanley Reference Stanley1973a, Reference Stanley2008; Vermeij Reference Vermeij1987; Baldomero et al. Reference Baldomero, Patrice Showers, Maren and Alexander2014) and tiering (Ausich and Bottjer Reference Ausich and Bottjer1982; Thayer Reference Thayer1983; Bottjer and Ausich Reference Bottjer and Ausich1986)—have consistently been interpreted as examples of increasing specialization. Simulation-based analyses in the companion article (Novack-Gottshall Reference Novack-Gottshall2016) support the partitioning model for ~75% of well-preserved Late Ordovician samples from the type Cincinnatian (the remainder are supported as redundancy models). However, this by itself is insufficient to establish whether this model continues to be upheld in later periods as a general Phanerozoic trend.
And yet many of these patterns are equally consistent with a pattern of stochastic diffusion from an initial ecological structure begun in the Cambrian or Ediacaran (Bush and Bambach Reference Bush and Bambach2011), perhaps punctuated with mass extinctions associated with major taxonomic turnovers, but in which ecological disparity generally increases with the addition of new species, and with many new species assured to have life habits functionally intermediate to, similar to, and often convergent with, already existing species. We do know that modern biotas are functionally more disparate than Paleozoic ones (measured as D by Novack-Gottshall [Reference Novack-Gottshall2007b] and as FRic by Villéger et al. [Reference Villéger, Novack-Gottshall and Mouillot2011]), but this alone is insufficient to identify whether this is caused by a driven or passive diffusional process. The simple truth is that we do not yet know which model is statistically best supported by these patterns. However, the data that exist are strong, and sufficiently powerful statistical analyses are available to answer this question.
Acknowledgments
I thank A. Bush, D. W. McShea, A. I. Miller, V. L. Roth, W. G. Wilson, and G. A. Wray for discussion of ecological models; and G. Spencer and the staff at the Myrin Library (Ursinus College), where much of the manuscript was written. Research and manuscript support was facilitated with a sabbatical leave provided by M. J. de la Cámara and Faculty Development (Benedictine University). This review is based, in part, on a portion of my doctoral dissertation at Duke University. This paper was strengthened by thoughtful reviews from M. Foote, S. M. Holland, and G. Hunt.