


Introduction
The continuing rise in the number and proportion of adults aged 65 or more years has made the importance of understanding the process of normal ageing more salient (UNO, 2001). Since the mid-1970s, considerable research attention has focused on neuropsychiatric and other medical disorders prevalent in old age, but efforts to understand and foster optimal wellbeing among older adults also require research on standard and even ideal functioning in later life in terms of healthy physical, cognitive and emotional functioning, as well as overall wellbeing. Researchers that focus on the study of healthy ageing face at least one disadvantage over those focused on illnesses among older adults. Specifically, to study neuropsychiatric or other medical disorders, dense concentrations of potential participants can often be contacted through clinical settings, but studies of broader non-patient populations require recruitment through what are often less concentrated sources. Because studies of healthy ageing may require large, geographically dispersed, non-patient samples, there tends to be an even heavier reliance (than in clinical research) on surveys and other self-report data.
Although self-report data have many advantages over other assessment methods, their validity rests, in part, upon the degree to which the participants give accurate and candid responses. It is important to consider the degree to which responses reflect variance in the targeted construct (the actual state of affairs), as against a socially-desirable response bias (whether or not the latter includes self-deception or intentional impression management) (Edwards Reference Edwards1953; McCrae and Costa Reference McCrae and Costa1983). The routine inclusion of measures that directly assess respondents' proclivity toward socially-desirable responses may be of value in clarifying the appropriate interpretation of other self-report data in research on ageing (McCrae and Costa Reference McCrae and Costa1983). On the other hand, there is also a danger of over-interpreting responses on social desirability scales, particularly in the absence of information about what other factors may result in responses elevated in a socially-desirable direction.
Consideration of standard models of socially-desirable response biases, as well as the assessment of such biases, illustrates why social desirability may be a particular issue in research on normal ageing. An individual's response on a self-report item seems likely to fall into one of three categories: (a) a valid/accurate reflection of his/her objective state on a given dimension, (b) a valid reflection of his/her own perceptions of his/her state, but (if his/her perception is biased) not an accurate reflection of his/her objective state, or (c) an intentional effort ‘to look good’ (or, in the case of malingering, ‘to look bad’). Researchers frequently have no access to objective information about the actual state of affairs, so they can only draw indirect inferences about which of these categories a participant's response belongs to. A common method of drawing such inferences is to include scales of social desirability response bias that have items reflecting socially-valued states that do not actually characterise most peoples' behaviour (such as invariably driving at or under the speed limit). Physical and/or psycho-social changes associated with normal ageing may evoke alterations in perception or self-presentational concerns, thereby affecting the rates of impression management and of responses in socially-desirable directions (Martin, Leary and Rejeski Reference Martin, Leary and Rejeski2000), and hindering the validity or at least the interpretation of self-report data from older people. On the other hand, interpreting elevated scores on social desirability scales can be problematic in some subgroups, such as those who have been socialised either to place particular importance on the judgement or perceptions by others of their ‘moral worth’, and/or actually to live by relatively pro-social standards. Some data suggest that older adults respond in a more socially-desirable manner because they are more socially responsible and conscientious, or adhere to more traditional norms and values, so not necessarily because they are lying or ‘faking being good’ (Dijkstra, Smit and Comijs Reference Dijkstra, Smit and Comijs2001; McCrae and Costa Reference McCrae and Costa1983).
Further complicating the interpretation of self-report and potential socially-desirable response biases are the issues of cognitive changes and of cohort differences in levels of education. For instance, Dijkstra, Smit and Comijs (Reference Dijkstra, Smit and Comijs2001) suggested that the association of age with a tendency toward socially-desirable responses may reflect a confound of education and memory functioning. Older people have been shown to respond in a more socially-desirable manner because they, as a cohort, many have lower education and poorer memories, which affect how well people remember situations during which they did socially-undesirable things, and because both influence the socially-desirable response pattern. Consistent with these findings, other researchers have reported significant associations between responses on social desirability scales and various socio-demographic characteristics. Some of the common predictors of socially-desirable responses are older age, female gender, lower education and/or income, and some ethnic backgrounds (Eisenberg and Okun Reference Eisenberg and Okun1996; Gove and Geerken Reference Gove and Geerken1977; Klassen, Hornstra and Anderson Reference Klassen, Hornstra and Anderson1975; Kozma and Stones Reference Kozma and Stones1988; Ray Reference Ray1988; Stöber Reference Stöber2001; Thomsen et al. Reference Thomsen, Mehlsen, Viidik, Sommerlund and Zachariae2005; Welte and Russell Reference Welte and Russell1993).
Prior studies have also shown significant positive associations between social desirability response style and self-reports of life satisfaction, emotional support, happiness and lack of hostility (Breemhaar, Visser and Kleijnen Reference Breemhaar, Visser and Kleijnen1990; Helmers et al. Reference Helmers, Krantz, Merz, Klein, Kop, Gottdiener and Rozanski1995; Lu and Shih Reference Lu and Shih1997; Ruehlman, Lanyon and Karoly Reference Ruehlman, Lanyon and Karoly1999), and positive attitude to one's own ageing and success in ageing (Abraham and Hansson Reference Abraham and Hansson1995; Mancini and McKeel Reference Mancini and McKeel1986). Significant negative associations have also been reported between social desirability and psychological distress (Phillips et al. Reference Phillips, Henry, Hosie and Milne2006; Ruehlman, Lanyon and Karoly Reference Ruehlman, Lanyon and Karoly1999).
To the degree that researchers rely upon self-report data to measure normal variance in various relevant dimensions of normal or successful ageing, it is critical to consider the likelihood that self-reports may be confounded by socially-desirable response styles, including the frequency of socially-desirable responses, the magnitude of such response tendencies (how much of the variance in other self-reports of various dimensions can be accounted for by such a response bias), and to identify the participants' characteristics that associate with impression management or socially-desirable responding. Thus, the purpose of the present study was to identify how socially-desirable responses affect scores on self-report measures after accounting for socio-demographic influences among a large sample of older women. Specifically, the present report describes our study of 1,860 older women who completed a ten-item version of the Marlowe–Crowne Social Desirability Scale (the MCSDS-10; Strahan and Gerbasi Reference Strahan and Gerbasi1972). We examined the associations between MCSDS-10 scores, socio-demographic characteristics, and several self-report measures of mental/physical health, cognitive functioning, successful ageing and wellbeing. Based on prior studies of social desirability in the general (non-aged) population, we hypothesised that the MCSDS-10 would account for significant additional variance, above that accounted for by socio-demographic attributes alone, on self-reports of medical burden, subjective wellbeing, self-perceived ‘successful ageing’, psychological distress, and cognitive functioning. In exploratory analyses, we also examined the frequency of responses in the ‘socially desirable’ direction on each MCSDS-10 item and the correlation between scores on the individual items with the MCSDS-10 total score.
Methods
The participants
The sample was of middle-aged and older women who participated in the Study of Successful Aging sponsored by the University of California, San Diego (UCSD) Stein Institute for Research on Aging. These participants were recruited from the San Diego Clinical Center cohort of the United States National Institute of Health-funded Women's Health Initiative (WHI). The WHI was a nationwide study of 161,808 generally healthy women aged between 50 and 79 years at the time of enrolment. It included a set of clinical trials and an observational study that focused on prevention of chronic disease post-menopause (Women's Health Initiative Study Group 1998). Women were excluded from the clinical trials if they had a history of breast cancer, sickle cell anaemia or kidney failure, and from the observational study for medical conditions predictive of a survival time of less than three years or for conditions (such as dementia) inconsistent with study participation. There were 6,427 women in the San Diego WHI cohort: 2,163 in the clinical trials and 4,264 in the observational study.
To enrol in the UCSD Study of Successful Aging, each participant was contacted at her final WHI study visit or by mail, and was invited to complete the Stein Institute's Successful Aging Survey, a 250-item self-administered, self-report questionnaire (reviewed and approved by the UCSD Human Research Protection Program). In response, 1,976 (31%) of the participants returned completed questionnaires. Of these, 1,860 provided complete responses to the MCSDS-10 and were English-speaking women and aged over 55 years. They constitute the analysis sample. We have previously reported some of the data from the Successful Aging Survey (Lamond et al. Reference Lamond, Depp, Allison, Langer, Reichstadt, Moore, Golshan, Ganiats and Jeste2008; Moore et al. Reference Moore, Sitzer, Depp, Montross, Reichstadt, Lebowitz and Jeste2007), but the present paper is the first to report a comprehensive analysis of the MCSDS-10 scores. Compared to other WHI participants, those in the analysis sample were more likely to be enrolled in the clinical trial (45% versus 29% χ2 (1)=142.9, p<0.001), to be Caucasian (89% versus 75% χ2 (1)=113.7, p<0.001), and to have higher education and income (both p<0.001).
Measures and procedures
Socio-demographic attributes
Age, education, ethnicity and income were obtained by self-report as part of the larger WHI study. Income and education were categorised (i.e. for income: ⩽$10,000, $10,000–$19,999, $20,000–$34,999, $35,000–$49,999, $50,000–$74,999, $75,000–$99,999, $100,000–$149,999 and $150,000 or more; and for level of education: No school, Grade school 5–8 years, Some high school (9–11 years), High school diploma/GED (General Educational Development), Vocational training school after high school graduation, Some college/associate degree, College graduate/Baccalaureate degree, Some college/professional school after college graduation, Masters degree, Doctoral degree (PhD, MD, JD, etc.), respectively). For purposes of the present analyses, ethnicity was coded dichotomously as Caucasian or non-Caucasian (Latinos were included in the latter group) although when collected for the WHI, additional categories had been collected (Latino, White, African American, Native American, Chinese, Filipino, Japanese, Korean and Other).
Social desirability
The Successful Aging Survey, which was a slightly modified version of the survey questionnaire described in our earlier studies (Lamond et al. Reference Lamond, Depp, Allison, Langer, Reichstadt, Moore, Golshan, Ganiats and Jeste2008; Montross et al. Reference Montross, Depp, Daly, Reichstadt, Golshan, Moore, Sitzer and Jeste2006; Moore et al. Reference Moore, Sitzer, Depp, Montross, Reichstadt, Lebowitz and Jeste2007), included a previously validated MCSDS-10 (Reynolds Reference Reynolds1982; Strahan and Gerbasi Reference Strahan and Gerbasi1972). Each MCSDS-10 item consists of a self-descriptive statement to which the participant responds ‘true’ or ‘false’, yielding a potential total score that can range from 0 to 10. Five of the items (1, 2, 5, 6 and 7) are reverse coded to allow a score of one point per item checked in the socially-desirable direction. The MCSDS-10 strongly correlates with the full 33-item schedule (r=0.85) (Reynolds Reference Reynolds1982).
Self-reported physical and mental health, cognitive function and wellbeing
All measures have been validated in numerous populations (Boulet and Boss Reference Boulet and Boss1991; Edwards, Feightner and Goldsmith Reference Edwards, Feightner and Goldsmith1995; Jenkinson, Wright and Coulter Reference Jenkinson, Wright and Coulter1994; Johnson, Murphy and Dimond Reference Johnson, Murphy and Dimond1996; McHorney, Ware and Raczek Reference McHorney, Ware and Raczek1993; Wijndaele et al. Reference Wijndaele, Matton, Duvigneaud, Lefevre, Duquet, Thomis, De Bourdeaudhuij and Philippaerts2007). The Successful Aging Survey included the Medical Outcomes Survey 36-item Short Form (SF-36; Ware and Sherbourne Reference Ware and Sherbourne1992), the Philadelphia Geriatric Center Morale Scale (PGCM; Lawton Reference Lawton1975), the Center for Epidemiological Studies Depression Scale (CES-D; Radloff Reference Radloff1977), the Anxiety and Hostility subscales of the Brief Symptom Inventory (BSI; Derogatis and Melisaratos Reference Derogatis and Melisaratos1983), and the Perceived Stress Scale (PSS; Cohen, Kamarck and Mermelstein Reference Cohen, Kamarck and Mermelstein1983). Higher scores on the PGCM represent more positive attitudes toward ageing, and higher physical and mental health composite scores on the SF-36 reflect greater wellbeing; higher scores on the CES-D, BSI and PSS reflect more psychological distress. As in prior studies (Lamond et al. Reference Lamond, Depp, Allison, Langer, Reichstadt, Moore, Golshan, Ganiats and Jeste2008; Moore et al. Reference Moore, Sitzer, Depp, Montross, Reichstadt, Lebowitz and Jeste2007), the participants also rated their degree of successful ageing on a scale from ‘1’ (least successful) to ‘10’ (most successful). No specific definitions of successful ageing were presented as we wanted the participants to choose their own criteria.
Self-perceived cognitive deficits were evaluated with the Cognitive Failures Questionnaire (CFQ) (Broadbent et al. Reference Broadbent, Cooper, FitzGerald and Parkes1982), which assesses self-perceptions of problems in various cognitive dimensions such as attention/distractibility, memory and motor functions (Broadbent et al. Reference Broadbent, Cooper, FitzGerald and Parkes1982; Wallace, Kass and Stanny Reference Wallace, Kass and Stanny2002). Higher CFQ scores represent greater self-perceived cognitive problems. The participants also completed a modified version of the Cognitive Assessment Screening Test (CAST; Drachman et al. Reference Drachman, Swearer, Kane, Osgood, O'Toole and Moonis1996), a self-administered test of actual cognitive deficits. Lower CAST scores represent worse cognitive function. This version of the CAST did not include the Orientation questions (Moore et al. Reference Moore, Sitzer, Depp, Montross, Reichstadt, Lebowitz and Jeste2007).
Statistical analyses
Descriptive statistics for all variables including means, medians, standard deviations (SD), ranges, skew and kurtosis were calculated. For each MCSDS-10 item, we calculated the proportion of participants who endorsed the item in the ‘socially desirable’ response direction, and Spearman's correlation between each item with the MCSDS-10 total score. A series of regressions were conducted with and without inclusion of the MCSDS-10 to assess the influence of the MCSDS-10 on responses over and above that of the socio-demographic attributes (age, education, income and ethnicity). Relative differences between the R-squared values were then computed (R 2 from the model including MCSDS-10 divided by R 2 from the model not including MCSDS-10) to determine the relative influence of the MCSDS-10 on the response for each test. The association between MCSDS-10 scores and ethnicity (Caucasian versus non-Caucasian) was evaluated by a t-test; the bivariate associations between MCSDS-10 total scores and each of the other participant characteristics were evaluated with Pearson's correlation, except for education which was evaluated with Spearman's rho. Statistical significance was determined at the 5 per cent level (p<0.05; two-tailed). Given the relatively large sample size, it is possible to identify statistically significant associations that may nonetheless have marginal pragmatic magnitude. Thus, we also describe the magnitude of associations with the descriptors for effect size ranges suggested by Cohen (Reference Cohen1988): ‘small’ (r⩾0.1 and <0.3), ‘medium’ (r⩾0.3 and <0.5), and ‘large’ (r⩾0.5).
Results
Social desirability
The mean MCSDS-10 score was 6.8 (SD=1.9; range=0–10). Endorsement rates for each of the MCSDS-10 items ranged from 36 per cent (‘I like to gossip at times’) to 94 per cent (‘I always try to practise what I preach’), with seven items being endorsed in the ‘socially desirable’ direction by a majority of the sample (Table 1). Spearman's correlations between MCSDS-10 items and the total score ranged from r s=0.22 (‘I always practise what I preach’) to r s=0.54 (‘There have been occasions when I took advantage of someone’ (p<0.001 in all cases). Note that consistent with Cohen's (Reference Cohen1988) descriptive scheme, the lowest of these correlations was in the small effect size range (r s=0.1–0.3); of the remaining nine, five were in the ‘medium’ effect size range (r s=0.3–0.5), and four were in the ‘large’ effect size range (r s⩾0.5).
Table 1. Proportion of individual item responses in the socially desirable direction and their relationship to total score on the ten-item Marlowe–Crowne Social Desirability Scale (MCSDS-10)
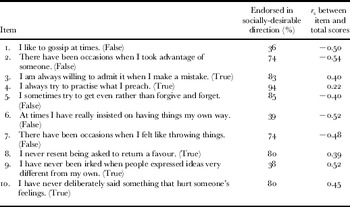
Notes: All correlations were significant at p<0.001 (negative correlations for items coded as ‘false’, and positive correlations for items coded as ‘true’). r s: Spearman's rank correlation coefficient. Sample size: 1,860.
Bivariate correlations of socio-demographic attributes and social desirability
As shown in Table 2, the correlations between the MCSDS-10 scores and age and education were statistically significant (r s=0.18 and r s=−0.11, respectively; both p<0.001); however, the absolute magnitude of both of these correlations was in the ‘small effect size’ range (Cohen Reference Cohen1988). There was no significant difference in MCSD-10 scores among Caucasian versus non-Caucasian participants, i.e. mean (and SD) MCSDS-10 total scores were 6.82 (1.92) and 6.99 (1.94), respectively (t (1,853 degrees of freedom)=1.20, p=0.23).
Table 2. Descriptive statistics and bivariate associations between socially desirable responses (ten-item Marlowe–Crowne Social Desirability Scale (MCSDS-10) score) and participant socio-demographic attributes

Notes: 1. Figures in brackets are degrees of freedom. 2. Possible range of scores: 0–10. 3. With the current sample size, this result is significantly (p<0.001) different from the null hypothesis value (ρ=0), but the magnitude of the association is in the ‘small’ effect size range (Cohen Reference Cohen1988). 4. p=0.23.
Association of social desirability on other self-reports of status
As shown in Table 3, the regression models with only the socio-demographic attributes (the ‘reduced model’) and those with also the MCSDS-10 scores (the ‘full model’) were completed to assess the extra variance explained by MCSDS-10 on each test score. The magnitude differences in R-squared between the reduced and full models indicated that the MCSDS-10 contributed most in terms of additional explained variance for models in which the dependent variables were measures of psychological distress (BSI Anxiety and Hostility subscales), i.e. the full models for these two variables explained more than ten times the amount of variance than did the corresponding reduced models. Addition of the MCSDS-10 into the model also explained at least twice the amount of variance over the reduced model for self-reported mental health functioning (SF-36 Mental Health component), other measures of psychological distress (CES-D and PSS), and self-reported successful ageing and cognitive impairment (CFQ) (Table 3). There were no magnitude differences between models with or without the inclusion of the MCSDS-10 for assessing physical health (SF-36 Physical Health component score), wellbeing/attitude toward ageing (Philadelphia Geriatric Center Morale Scale), or actual cognitive deficits (CAST) (relative increase of full versus reduced models all=1).
Table 3. Descriptive statistics and change in R2 for predicting participant responses with and without accounting for socially desirable responses (ten-item Marlowe–Crowne Social Desirability Scale (MCSDS-10) score)

Notes: Sample size: 1,860. SD: standard deviation. RI: relative increase. 1. Includes age, income, education, ethnicity and MCSDS-10. 2. Includes age, income, education and ethnicity only. 3. Higher scores indicate better functioning. 4. Figures in brackets are degrees of freedom.
As noted above, the two models in which the addition of the MCSDS-10 accounted for the most additional variance in the dependent variable, over the reduced model alone, were those for the BSI Anxiety and Hostility subscales. However, these were also the two dependent variables for which the reduced model alone accounted for the least variance (R 2=0.003 and 0.001, respectively). Thus to examine further the association of socially-desirable response scores with other self-reported status variables, we also calculated the bivariate Pearson correlations between MCSDS-10 and each of the ten dependent variables (see Table 3, columns 8 and 9). None of these correlations exceeded the ‘small’ effect size range, i.e. ⩾0.3. However, in terms of statistical significance, higher socially-desirable response style (MCSDS-10 total scores) was associated with better self-reported mental health functioning (SF-36 Mental Health component; r=0.14) and less psychological distress (CES-D r=−0.19; BSI Anxiety and Hostility subscales r s=−0.17 and −0.24, and PSS r=−0.23), as well as less self-reported cognitive impairment (CFQ; r=−0.24) (all p<0.001). There were also statistically significant correlations between the MCSDS-10 and self-reported successful ageing (r=0.09, p<0.001) and actual cognitive deficits (CAST total score, r=−0.06, p=0.021), were also statistically significant (all p<0.05) but the magnitude of these correlations was below the cut-off of r>0.1 suggested by Cohen (Reference Cohen1988) to define even a ‘small effect’. The correlations between MCSDS-10 and physical health (SF-36 Physical Health component score) and wellbeing/attitude toward ageing (Philadelphia Geriatric Center Morale Scale) were not statistically significant (both p>0.05).
Discussion
The findings from seven of the ten regression models tested were consistent with our a priori hypotheses, in that in these seven models, social desirability accounted for at least twice the amount of variance as that explained by the socio-demographic attributes alone for mental health, self-perceived cognitive deficits, successful ageing, and wellbeing. The MCSDS-10 did not add any interpretive value in two tests, those of physical health and wellbeing/attitude toward ageing. These regression models indicated that although the MCSDS-10 was a significant predictor, it did not add much additional relative value to the variance explained as the relative R-squared for both physical health and wellbeing/attitude toward ageing regressions were essentially equivalent, with or without the MCSDS-10. Therefore, socially-desirable responding did not appear to have much influence in the interpretation of the questions on these tests by the person taking them. The only regression model for which the addition of the MCSDS-10 did not result in significant additional explained variance was that for actual cognitive deficits with socio-demographic predictors alone. This is interesting as it was the only test not influenced by the responders' opinion or beliefs – it is more of an objective test.
Although previous research has shown that when scores are corrected for socially-desirable responding, this does not improve the observed validity of the scores, e.g. the concurrent validity in terms of association with objective external criteria may even be reduced (Dicken Reference Dicken1963; McCrae and Costa Reference McCrae and Costa1983; Wrobel and Shapiro Reference Wrobel and Shapiro1999), our findings indicate that adjusting for social desirability on some variables is worthwhile and justifiable considering the extra variance accounted for over and above socio-demographic attributes alone. In particular, considering the bivariate associations, as well as the degree of additional variance accounted for in the multiple regression analyses, it appears that respondents with a higher proclivity to give social desirable responses may also tend to report lower levels of anxiety, hostility, perceived stress and self-reported cognitive deficits. Social desirability thus warrants consideration as a partial explanation of inter-respondent differences in survey studies of these constructs. On the other hand, consideration must also be given to the possibility that such associations reflect overlap in item content rather than response biases. For instance, item 7 on the MCSDS-10, ‘There have been occasions when I felt like throwing things’, may be less applicable to persons with particularly low levels of stress or hostility, and thus result in a negative correlation between the two scales.
We also found statistically significant although small magnitude influences of some socio-demographic characteristics on degree of social desirability response styles. Age and education were positively correlated with scores on the social desirability measure (MCSDS-10), but the magnitudes of these correlations were only r=0.18 and ρ (rho)=−0.11, respectively, while income was negatively correlated (r=−0.08). For ethnicity, no differences were found between Caucasians and other ethnic groups on mean social desirability response scores. The latter finding contrasts with some reports that have suggested an ethnicity effect (Cappeliez Reference Cappeliez1989). However, our finding regarding level of education is consistent with earlier investigations in other populations (Cappeliez Reference Cappeliez1989; Gove and Geerken Reference Gove and Geerken1977; Klassen, Hornstra and Anderson Reference Klassen, Hornstra and Anderson1975). It is to be noted though that because of the rather low response rate to the survey and the corresponding potential presence of selection bias, especially considering that all respondents were women, these low magnitude correlations may not reflect the general older population.
In contrast to the small associations between the MCSDS-10 and socio-demographic characteristics, the correlations between individual MCSDS-10 items and the total score were generally high, with all but one of the ten values being in the ranges commonly labelled as ‘medium’ or ‘large’ effect sizes, i.e. correlations above 0.30 and 0.50, respectively (Cohen Reference Cohen1988). This finding speaks to the internal consistency reliability of the MCSDS-10. Thus, the low magnitude of associations between the MCSDS-10 and socio-demographic characteristics did not appear to be attributable to a lack of scale reliability.
There have been suggestions in the empirical literature that older women may be more likely to endorse statements in the ‘socially desirable’ direction (Eisenberg and Okun Reference Eisenberg and Okun1996; Gove and Geerken Reference Gove and Geerken1977; Klassen, Hornstra and Anderson Reference Klassen, Hornstra and Anderson1975; Kozma and Stones Reference Kozma and Stones1988; Ray Reference Ray1988; Stöber Reference Stöber2001; Thomsen et al. Reference Thomsen, Mehlsen, Viidik, Sommerlund and Zachariae2005; Welte and Russell Reference Welte and Russell1993). In that regard, it might be noted that seven of the ten items on the MCSDS-10 were endorsed in the ‘socially desirable’ direction by a majority of the present sample. At first glance, such high proportions of participants giving responses that appear socially desirable are consistent with the prior suggestions of gender and age effects on social desirability. The age range in our sample spanned 57–91 years and, as noted above, there was a statistically significant but small effect size correlation between current age and MCSDS-10 scores. However, the analysis had limited ability to evaluate age or gender effects, as we lacked data from younger women and from men by which one might evaluate the degree to which the observed pattern is unique to older women.
There are several other limitations to the present study. All measures were self-report, the sample was restricted to the San Diego cohort of the WHI investigation, and only one-third of the San Diego WHI cohort completed the present survey. Also, we used an abbreviated MCSDS, which although well validated (Reynolds Reference Reynolds1982; Strahan and Gerbasi Reference Strahan and Gerbasi1972), may not have given an accurate reflection of what is considered to be socially desirable in this population. There may be problems with designating certain responses as ‘socially desirable’; for example, the participant might not have understood how to interpret literally a given question (with terms such as ‘always’ or ‘never’ which are used in common parlance but are not exact), or that the responses were mediated more by self-deception or impression management, two closely-related concepts (Barrick and Mount Reference Barrick and Mount1996). The lack of substantial associations between social desirability scores and self-reports of wellbeing (as measured by the SF-36 Mental Health component and PSS) conflicts with some prior reports for other populations (Breemhaar, Visser and Kleijnen Reference Breemhaar, Visser and Kleijnen1990; Lu and Shih Reference Lu and Shih1997; Ruehlman, Lanyon and Karoly Reference Ruehlman, Lanyon and Karoly1999). This difference could be related to the item content of the specific scales used to operationalise the key constructs. Kozma and Stones (Reference Kozma and Stones1987, Reference Kozma and Stones1988) suggested that the strength of such associations, when present, reflects common item content in scales of quality of wellbeing and scales of social desirability response bias. For instance, they suggested that the Edwards Social Desirability Scale (ESDS) (Edwards Reference Edwards1957) has greater content overlap with commonly-used quality of wellbeing scales than did the full-length version of the MCSDS (Crowne and Marlowe Reference Crowne and Marlowe1960), and found that the ESDS had substantially higher correlations with three wellbeing scales relative to the correlations between the MCSDS and these wellbeing scales (Kozma and Stones Reference Kozma and Stones1988).
To our knowledge, only one prior study of healthy volunteers has described the specific endorsement rates on the individual items in the MCSDS-10. Specifically, in Reynolds's (Reference Reynolds1982) study of undergraduate college students, some of the most frequently endorsed MCSDS-10 items were the same as those endorsed in the present sample of older women, e.g. 85 per cent of the college students responded in a socially-desirable direction to ‘I always try to practise what I preach’ (true), 77 per cent to ‘I never resent being asked to return a favour’ (true), 61 per cent to ‘I'm always willing to admit it when I make a mistake’ (true), 47 per cent to ‘I sometimes try to get even rather than forgive and forget’ (false), and 41 per cent to ‘I have never been irked when people expressed ideas very different from my own’ (true). A part of the difficulty in interpreting the rates at which MCSDS items are endorsed in the ‘socially desirable’ direction is that a socially-desirable response bias cannot itself be measured directly, but rather must be inferred from responses to items that may reflect self-presentational concerns, i.e. the truth status for a particular individual on any particular items is generally unknown. While a person consciously endeavouring to present her/himself in a falsely favourable light will tend to answer ‘true’ to an item such as ‘I always try to practise what I preach’, a very conscientious person may also validly/candidly respond ‘true’ if s/he interprets the item as asking whether s/he attempts to live up to her/his stated values. (Whether one perceives oneself as successful in such attempts is a somewhat different question that is not assessed by the MCSDS items). In future studies, one means of disentangling social desirability response styles from accurate reports of socially-desirable behaviour might be to compare collateral and self-report reports of socially-desirable behaviours.
In conclusion, the reported findings indicate that social desirability as a concept has some explanatory power in regard to the variance in self-reports of successful ageing, or any of the other constructs related to physical and mental health, cognitive function and wellbeing in older women, especially when the question being asked requires more individual interpretation.
Acknowledgements
The authors thank the WHI investigators and staff for their dedication, and the study participants for making the programme possible. A listing of WHI investigators can be found at http://www.whiscience.org/publications/WHI_investigators_shortlist.pdf. We are grateful to the WHI investigative team for making this study possible. The authors would also like to acknowledge the additional support of the Sam and Rose Stein Institute for Research on Aging, and the Department of Veterans Affairs. They also express their gratitude to Ian Fellows, MA, and Shah Golshan, PhD, for their assistance with the statistical analyses. The authors acknowledge the funding support of the National Institute of Mental Health (P30 NH080002-01, T32 MH019934). The WHI programme is funded by the National Heart, Lung, and Blood Institute, National Institutes of Health, US Department of Health and Human Services through contracts N01WH22110, 24152, 32100-2, 32105-6, 32108-9, 32111-13, 32115, 32118-32119, 32122, 42107-26, 42129-32, and 44221.


