


1. INTRODUCTION
The Singapore Strait is a 105 kilometre long strait between the Strait of Malacca in the west and the South China Sea in the east. It links one of the largest ports to the rest of the world and has a high density of vessel traffic. More than 200 vessels pass through the Strait on a daily basis and this gives an annual throughput of approximately 70,000 vessels, carrying 80% of the oil transported to Northeast Asia, as well as one third of the world's traded goods including Chinese manufactures, Indonesian coffee etc. Although the Singapore Strait is of great importance to the global economy (Wang and Meng, Reference Wang and Meng2011; Qu and Meng, Reference Qu and Meng2012), it is not deep enough for some of the largest vessels (mostly oil tankers). The Strait also has substantial sections of narrower and shallower shipping lanes. At Philips Channel, it narrows to 2·8 kilometres wide, with 2·1 kilometres in the shipping lanes, creating one of the world's chokepoints. Therefore, the navigational safety of vessels through the Singapore Strait is a matter of great concern to the Maritime and Port Authority (MPA) of Singapore and other relevant stakeholders such as oceanic carriers.
Several strategies for enhancing navigational safety in the Strait have been implemented over the past 30 years. The Traffic Separation Scheme (TSS) was brought into force on 1 May 1981 to enable safer navigation in the Straits of Malacca and Singapore (see Figure 1). Since then, the opposing streams of traffic have been separated by the establishment of traffic lanes. In 1998, the Society of International Gas Tanker and Terminal Operators Ltd (SIGTTO) published the first version of the Passage Planning Guide: Malacca & Singapore Straits, including background and passage notes on the Straits, to provide guidance for ship masters and navigating officers transiting the Straits (SIGTTO, 2008). Different navigational rules, such as sailing speed limits, have been proposed at different locations on the Singapore Strait. The effectiveness of these risk mitigation measures can be assessed using the Quantitative Risk Assessment (QRA) models developed for maritime transportation (Li et al., Reference Li, Meng and Qu2011). The most important contributing input into such models is the Vessel Collision Frequency, defined as the product of the number of Vessel Conflicts and the causation probability. This paper focuses on the estimation of Vessel Collision Frequency in the Singapore Straight.
1.1. Literature Review
When looking into Vessel Collision Frequency, ‘conflict’ and ‘probability’ are the two key concepts involved. (Macduff, Reference Macduff1974) was the first to define the collision frequency as the number of Vessel Conflicts multiplied by a causation probability. In most previous research, the causation probability for distinct water areas is assumed to be a constant under a particular accident scenario (Kaneko, Reference Kaneko2002). However, the number of Vessel Conflicts is dependent on the geometric parameters of the water area, vessel size, traffic volume, vessel Speed Over Ground (SOG) and Course Over Ground (COG). In other words, the accuracy of the Vessel Collision Frequency primarily depends on the accurate estimation of the number of Vessel Conflicts.
Macduff (Reference Macduff1974) applied the molecular collision theory to estimate the number of Vessel Conflicts by assuming that the main vessel stream moves with the same speed and along the same course. This assumption is obviously unrealistic and may result in underestimation. Fujii (Reference Fujii and Tanaka1971) proposed a model based on geometry and the laws of motion to estimate the average number of conflicts when vessels pass through a given area. However, the results are overestimated to some extent because the evasive actions are assumed to take up between 9·5 and 16·3 times the vessel length, which is very conservative in practice. In reality, the minimum vessel distance, which is defined as the safe distance between two vessels at the moment of closest approach based on their measurement points (i.e., the ‘points’ of the vessel's radar echoes on the radar screen) is about three times the vessel length in the Singapore Strait. Following Fujii's pioneering work, the ship domain concept was proposed to estimate the number of Vessel Conflicts (Pietrzykowski, Reference Pietrzykowski2008; Pietrzykowski and Uriasz, Reference Pietrzykowski and Uriasz2009; Szlapczynski, Reference Szlapczynski2006; Wang, Reference Wang2010). For example, Fowler and Sorgard (Reference Fowler and Sorgrad2000) developed a ship domain based model by assuming there is a critical situation when two vessels cross within 0·5 nautical miles of each other. (Pedersen, Reference Pedersen2002) also applied the ship domain theory to conduct a risk analysis for a large suspension bridge. However, again, the minimum distance between two vessels was assumed to be a constant and only head-on conflicts were taken into account.
The computer simulation based approach can quantitatively examine various navigational safety issues. Dand (Reference Dand2001) introduced the Permanent International Association of Navigation Congresses (PIANC) simulation approach to water channel design. (Zhang and Huang, Reference Zhang and Huang2006) developed ship models to acquire pilot experience using the computer simulation approach. However, the simulation method is very time-consuming. It may also give rise to biased or inaccurate results because of a lack of practical criteria and incorrect interpretations of rules and seamanship. It is thus not rational to estimate the number of Vessel Conflicts using a simulation approach.
A mathematical model was recently proposed by (COWI, 2008) to estimate the number of overtaking or head-on Vessel Conflicts. In this model, the number of Vessel Conflicts depends on the route segment length, traffic intensity in each of the two sailing directions, the widths and speeds of the vessels, and the deviation of the vessels from the route axis. This model usually overestimates the overtaking and head-on collision frequencies because the dependency of consecutive vessels is not taken into account.
In addition to the above-mentioned methods and models, several other models and methods have also been proposed by researchers. A simple random walk model was built by Tan and Otay (Reference Tan and Otay1999) to estimate the number of Vessel Conflicts. To assess the navigational safety of the Singapore Strait, (Qu et al., 2011) put forward three ship collision risk indices: speed dispersion, the degree of acceleration and deceleration, and the number of ship domain overlaps.
1.2. Objectives & Contributions
This study aims to estimate Vessel Collision Frequency in the Singapore Strait. The Vessel Collision Frequency is calculated as the product of the number of Vessel Conflicts and the causation probabilities. The number of Vessel Conflicts is computed by using real-time vessel information, provided by Lloyd's Marine Intelligence Unit's (Lloyd's MIU) Automatic Identification System (AIS). Based on the estimated number of Vessel Conflicts, the most risky area in the Singapore Strait can be identified. The effects of vessel course and time period on Vessel Collision Frequency are also investigated.
The contributions of this study are twofold. First, it initiates research into estimating Vessel Collision Frequency in the Singapore Strait. Second, the results from this study can be used by the MPA of Singapore to choose appropriate navigational safety strategies.
The remainder of this paper is organized as follows: Section 2 introduces the Lloyd's MIU AIS data and the data processing methods; in Section 3, the Vessel Collision Frequency estimation model is formulated, followed by the results and discussions in Section 4; conclusions of this study are presented in the last section.
2. DATA
2.1. Data Collection
The International Maritime Organization (IMO) International Convention for the Safety of Life at Sea (SOLAS) has required since 2002 that all larger seagoing vessels (>300GT) and all passenger vessels should be equipped with an AIS (Mou et al., Reference Mou, Tak and Ligteringen2010). Through dedicated Very High Frequency (VHF) radio, AIS information can be transmitted between vessels, from vessels to shore and vice versa. In simple terms, AIS is a technology which makes vessels ‘visible’ to each other. It can record information on vessel behaviour, including the effects of human behaviour and vessel manoeuvrability.
One month's (July 2009) AIS data from the Lloyd's MIU AIS database are used in this study. A total of 166,182 AIS records were collected to evaluate the Vessel Collision Frequency in the Singapore Strait between longitudes 103°21′E and 104°35′E, as shown in Figure 1. The dashed lines in Figure 1 indicate the TSS for the Singapore Strait. Each AIS record comprises the following information for each vessel at each reporting time (every 3 to 10 seconds): MMSI (Maritime Mobile Service Identity) number, latitude position, longitude position, SOG and COG.

Figure 1. Map of Singapore Strait (MPA, 2011).
2.2. Data Processing
Although the majority of the AIS records collected are accurate, a few records have inaccurate position and speed information. For example, it is found that 0·18% of the longitude position data are outside the range from 103°21′E to 104°35′E, and 0·25% of the SOG data exceed an unbelievable speed of 50 knots. To deal with these inaccurate SOG and position data, the data cleansing method proposed by (Qu et al., Reference Qu, Meng and Li2011) is employed in this study.
Additionally, more than 35% of the AIS records do not include the vessel length. It would be inappropriate to delete this incomplete data as it would interfere with the integrity of the real-time data. Since the vessel length is a key parameter in the estimation of Vessel Collision Frequency, we propose the following procedure for determining the missing vessel length by dividing the AIS records that lack vessel lengths into two categories:
• Category 1: (Missing vessel length for a vessel with an IMO number). Vessel length is highly correlated with the following factors: Net Register Tonnage (NRT), Gross Tonnage (GT) and Dead Weight Tonnage (DWT). However, the values of NRT and DWT are sometimes unavailable and given as null. Considering the availability of the above factors, we first classify the data in this category into the following four groups:
i) NRT=null and DWT≠null.
ii) NRT=null and DWT=null.
iii) NRT≠null and DWT=null.
iv) Otherwise.
(1)The vessel length function in Equation (1) can provide an accurate estimate because of the high prediction performance (i.e., high R2).
• Category 2: (Missing vessel length for a vessel without an IMO number). For vessels in this category, the missing vessel lengths will be assigned by the average value (≈197 m) of all vessel lengths available in the database.
3. VESSEL COLLISION FREQUENCY MODEL
Motivated by the work of (Fujii et al., Reference Fujii, Yamanouchi and Mizuki1974; MacDuff, Reference Macduff1974 and Mou et al., Reference Mou, Tak and Ligteringen2010), the Vessel Collision Frequency in this study is estimated by:
where:
f is the collision frequency of the vessels.
N is the number of Vessel Conflicts
p c is the causation probability, which is the probability of failing to avoid a collision for a given Vessel Conflict.
To calculate the number of Vessel Conflicts, we take a time interval of three minutes (ΔT=3 minutes) over which we analyse the collected AIS data. A Vessel Conflict is defined as a critical situation where a vessel is expected to enter another vessel's ship domain in the next time interval (Montewka et al., Reference Montewka, Hinz, Kujala and Matusiak2010). Here, the ship domain is expressed as the area around the vessel that the navigator wants to keep clear of other vessels or objects (Goodwin, Reference Goodwin1975). Figure 2 shows an example of a Vessel Conflict, where Vessel B is going to intrude into the domain of Vessel A in the following time interval ΔT. Note that the radius (R) of Vessel A's domain is not fixed but changes with vessel length. It can be shown that the majority of domain radiuses are approximately three times the vessels’ length (Mou et al., Reference Mou, Tak and Ligteringen2010). Hence, the domain radius of a particular vessel i can be estimated simply by:
where R i is the domain radius for vessel i and l i is the length of vessel i.

Figure 2. A Vessel Conflict.
Let (x it, yit) denote the position of a particular vessel i at time t; ![]() and
and ![]() denote the speed and course of vessel i at time t, respectively. Similarly, (x jt, yjt) denotes the position of another vessel j at time t;
denote the speed and course of vessel i at time t, respectively. Similarly, (x jt, yjt) denotes the position of another vessel j at time t; ![]() and
and ![]() represent the speed and course of vessel j at time t, respectively. The relative speed of vessel i over vessel j at time t, denoted by
represent the speed and course of vessel j at time t, respectively. The relative speed of vessel i over vessel j at time t, denoted by ![]() , can be calculated by
, can be calculated by
The distance between vessel i and vessel j at time t, denoted by D ijt, can be computed by

Let θ ijt be the angle between the relative speed ![]() and the line connecting two vessels, as shown in Figure 3. The angle θ ijt can be calculated by:
and the line connecting two vessels, as shown in Figure 3. The angle θ ijt can be calculated by:


Figure 3. Relationships between vessels’ positions and Vessel Conflicts.
If vessel i is expected not to enter vessel j's domain during the next time interval, the maximum sailing distance (L ijt) at time t can be calculated by:
Hence, vessel i has a conflict with vessel j at time t if and only if the following condition holds:
There are three types of Vessel Conflicts, defined as follows:
i) Overtaking Conflict. An overtaking conflict means a conflict in which two vessels are proceeding on the same route, lying on almost parallel courses. The course difference of an overtaking should not exceed 10° (Montewka et al., Reference Montewka, Hinz, Kujala and Matusiak2010).
ii) Head-On Conflict. A head-on conflict is referred to as a conflict in which vessels are lying on almost reciprocal courses, and the course differences falls in the range from 170° to 190°.
iii) Crossing Conflict. A crossing conflict is a conflict in which the difference between two vessels’ courses falls in the range 10°–170° or 190°–350°.
It should be pointed out that the course classifications used in this study are different from those in the International Regulations for the Prevention of Collisions at Sea (COLREGS). This study adopts the course classification scheme from (Montewka et al., Reference Montewka, Hinz, Kujala and Matusiak2010) because this classification scheme could slightly overestimate collision risk, compared with COLREGS. In view of the high safety requirement in the Singapore Strait, it is reasonable to use this conservative course classification scheme. As a vessel may encounter all three of the above Vessel Conflict types, the Vessel Collision Frequency could be estimated as:
where:
N overtaking is the number of overtaking conflicts.
p covertaking is the causation probability for the overtaking conflicts.
N head–on is the number of head-on conflicts.
p chead–on is the causation probability for the head-on conflicts.
N crossing is the number of crossing conflicts.
p ccrossing is the causation probability for the crossing conflicts.
4. RESULTS AND DISCUSSION
4.1. Vessel Traffic Characteristics
This section mainly presents the characteristics of vessels involved in conflicts. The vessels sailing in the Singapore Strait can be divided into six groups: general cargo vessels, bulk carriers, tankers, Liquefied Natural Gas/Liquefied Petroleum Gas (LNG/LGP), Roll-On Roll-Off (RORO)/Passenger ships and container carriers. Table 1 gives each category's percentage share of the traffic in the Singapore Strait, based on our one month of AIS data. According to Table 1, it can be clearly seen that container carriers account for the biggest proportion (36·36%), followed by bulk carriers (20·50%) and then tankers (18·30%). The percentage of RORO/Passenger ships (4·77%) in the Strait is quite small.
Table 1. Types of vessels operating in the Singapore Strait.
To investigate the relative speed of two vessels involved in a conflict, the @Risk software (@Risk, 2002) is used to fit relative speed distributions. This software makes use of chi-squared fit statistics to measure how well a distribution fits the collected data. Those which fit best (with the lowest chi-squared statistics) are selected. Figure 4 includes three graphs which describe the best-fitted distributions of relative speed for vessels involved in the three different types of Vessel Conflict. Figure 4(a) shows that the Weibull distribution best describes the relative speed of two vessels involved in an overtaking conflict. The majority of relative speeds (79·9%) range from 1 to 5 knots, and the average relative speed is around 3 knots. Figure 4(b) indicates that the average relative speed in head-on conflicts is 12 knots. The three graphs in Figure 4 demonstrate that the relative speeds of vessels involved in head-on conflicts are generally larger than those of vessels involved in overtaking and crossing conflicts. Since higher relative speeds could cause more serious consequences, a head-on collision is more likely to be associated with a high level of severity.
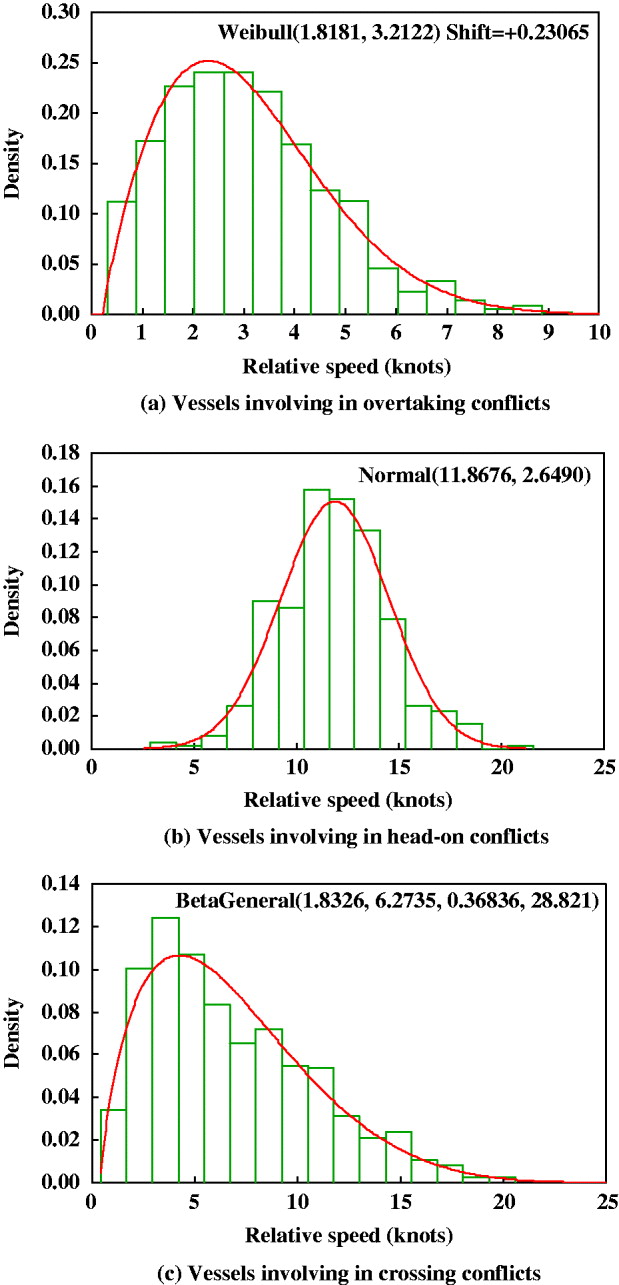
Figure 4. Relative speed distribution for vessels involving in conflicts of different types.
4.2. Vessel Collision Frequency
Figure 5 shows the compositions of vessel traffic involved in the different types of Vessel Conflict. According to Figure 5(a), container carriers, bulk carriers and tankers are the three main types of vessels involved in overtaking conflicts, representing 73·64% of all vessels involved. Furthermore, the container carrier is the most risky vessel type in terms of overtaking conflicts because it makes up the largest percentage. Figure 5(b) shows that the majority of head-on conflicts (79·78%) are again caused by these three vessel types. However, tankers rather than container carriers have the highest head-on collision frequency. The difference may be due to the rules for vessels navigating in the Singapore Strait. According to one of the rules, eastbound deep draught vessels (i.e., tankers) should use the deep water routes. Since the deep water routes are adjacent to the westbound traffic routes, tankers would certainly have more chance of colliding head-on with westbound vessels. In addition, another rule implies that eastbound tankers navigating in the deep water routes should avoid overtaking, which decreases the likelihood of tankers being involved in overtaking collisions. Figure 5(c) shows that the above three vessel types account for the majority of crossing conflicts as well, suggesting that the three vessel types are again the most risky in terms of crossing collision frequency. Due to the high percentage of Vessel Conflicts that involve tankers, and the severe consequences of such conflicts, focus may be placed on the tracking and management of tanker traffic.
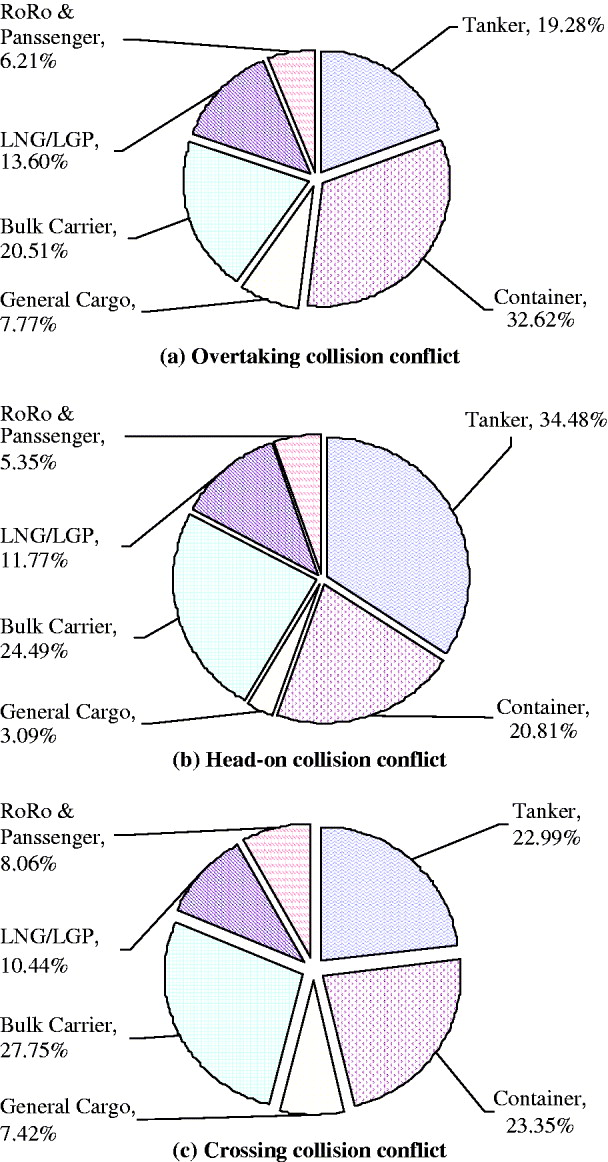
Figure 5. Types of vessels involving in traffic conflicts in the Singapore Strait.
The spatial distributions for different types of Vessel Conflicts in the Singapore Strait are presented in Figure 6. Figure 6(a) clearly shows that the most risky overtaking area is between longitudes 103°48′E and 104°12′E because of a greater number of overtaking conflicts. The high risk of overtaking collision may be caused by speeding vessels within this area (Qu et al., Reference Qu, Meng and Li2011). According to the Passage Planning Guide: Malacca & Singapore Straits (SIGTTO, 2008), the eastbound vessels reduce their speed to 12 knots in this area while the westbound vessels increase their speed from 12 knots if conditions are suitable. Therefore, there is a high frequency of vessel acceleration and deceleration manoeuvres within this area, which produces a larger number of overtaking conflicts. In addition, the traffic width in this area (specifically between longitudes 103°50′E and 104°00′E) is narrower than in other areas (see Figure 1). Hence, the density of vessels within this area is the largest in the entire Singapore Strait. This suggests that the vessels navigating in this area have the biggest probability of being involved in head-on conflicts, as shown in Figure 6(b). Figure 6(c) depicts the spatial distribution of vessel crossing conflicts. It can be seen that there are three areas associated with a high frequency of crossing conflicts. Two of them have a small peak centred at about 103°40′E and 104°16′E, respectively. It should be pointed out that the first small peak is in the crossing area between longitudes 103°30′E and 103°40′E while the other small peak is in the crossing area between longitudes 104°12′E and 104°18′E. One possible reason for a little higher frequency of crossing conflicts in the two areas might be that the slow-moving very large crude carriers (i.e., LNG/LGP) bound to or from the Shell SBM terminal sometimes cross the traffic lanes in these areas. The increase in the number of crossing manoeuvres could increase the number of crossing conflicts. From the figure, it can also be seen that the majority of crossing conflicts are distributed in the area between longitudes 103°50′E and 104°12′E. This may be due to the fact that vessels from the Singapore Port cross to the eastbound lane or merge into the westbound lane in this area.

Figure 6. Spatial distribution of Vessel Conflict in the Singapore Strait.
In the next step, the probability of a collision is computed on the basis of the number of conflicts obtained and the causation probability values adopted. We use three causation probability values which are commonly accepted in the existing studies (Pedersen, Reference Pedersen2002; Otto et al., Reference Otto, Pedersen, Samuelides and Sames2002; Kujala et al., Reference Kujala, Hanninen, Arola and Ylitalo2009): p covertaking=1·30×10−4 for the crossing conflict, p chead–on=4·90×10−5 for the overtaking conflict, and p ccrossing=4·90×10−5 for the head-on conflict. Table 2 shows the estimated Vessel Collision Frequency in the Singapore Strait. The estimated collision frequency (1·75 per year) is quite close to the average actual frequency of 1·80 per year, calculated from historical accident records for the Singapore Strait between the years of 1997 and 2002.
Table 2. Vessel collision frequency in the Singapore Strait.
* Commonly accepted by the existing studies (e.g., Otto et al., Reference Otto, Pedersen, Samuelides and Sames2002; Pedersen, Reference Pedersen2002; Kujala et al., Reference Kujala, Hanninen, Arola and Ylitalo2009)
4.3. Effects of Course and Time of Day on Vessel Collision Frequency
Table 3 shows the effects of course on the number of collisions in July 2009. From Table 3, it is clear that fewer overtaking, head-on and crossing collisions occur in the eastbound lanes than in the westbound lanes. Overall, westbound traffic has a collision frequency approximately twice that of eastbound traffic. One possible reason for this is that the lane width for the westbound traffic is narrower than that for the eastbound traffic although traffic volumes are similar in each course.
Table 3. Effect of the course on the number of collisions in the July.
Table 4 demonstrates that the Vessel Collision Frequency during the day is lower than the frequency at night. A one-way ANalysis Of VAriance (ANOVA) analysis is also carried out to test whether the night Vessel Collision Frequency is statistically higher than the day Vessel Collision Frequency. Table 5 gives the ANOVA test results, showing that the overtaking collision frequency during the day is statistically lower than the night frequency, at a significance level of 0·05. Similarly, both the head-on and crossing collision frequencies during the day are statistically lower than those at night. The higher collision frequency among night vessel traffic may be explained by the large concentration of small fishing crafts in the Singapore Strait, which may not be fully detectable at night by radar.
Table 4. Effect of time of a day on the number of collisions in the July.
Table 5. Statistical results of Vessel Collision Frequency for different time periods.
5. CONCLUSIONS
This study estimated Vessel Collision Frequency in the Singapore Strait using data from Lloyd's MIU AIS vessel movement database. According to the results, it can be seen that container carriers have the highest Vessel Collision Frequency while RORO/Passenger ships have the lowest collision frequency. Tankers have the highest head-on collision frequency. Due to the high percentage of Vessel Conflicts involving tankers and their severe consequences, focus should perhaps be placed on the tracking and management of tanker traffic in the Singapore Strait.
The results further show that the most risky overtaking area is between longitudes 103°48′E and 104°12′E. The most risky head-on area is between longitudes 103°50′E and 104°00′E. The majority of crossing collisions are distributed in the area between longitudes 103°50′E and 104°12′E. The Vessel Collision Frequency in the Singapore Strait is found to be 1·75 per year. It is also found that westbound traffic has about twice the collision frequency of the eastbound traffic. Moreover, the Vessel Collision Frequency during the day is lower than that at night. It should be pointed out that this study is just a first step towards quantitatively assessing the casualty risk in the Singapore Strait. The estimated Vessel Collision Frequency should next be used in QRA modelling.
ACKNOWLEDGEMENTS
This study is one part of the research project ‘Development of QRA model and software for shipping operations in the Straits of Malacca and Singapore’ funded by Maritime Innovation and Technology Fund of Singapore (WBS No. R-264-000-281-490 and R-702-000-004-490).


