Introduction
Radiotherapy has been carried out in our institution since 2011 with a medical Linear Accelerator (LINAC) capable of treating patients by use of different treatment techniques. In addition to three-dimensional (3D) conformal techniques, intensity-modulated radiation therapy (IMRT) and volumetric-modulated arc therapy (VMAT) are the standard modalities of treatment in the radiation therapy centre of the institution. The higher complexity in planning and delivery of radiation therapy require more rigorous quality assurance (QA) for the machine and treatment plan. There are various recommendations for dosimetric, mechanical and radiation safety QA tests pertaining to the machine. The American Association of Physicists in Medicine (AAPM) task groups reports, TG 40 and TG 142 describe various QA tests and their tolerances according to the periodicity such as daily, monthly and annually.Reference Kutcher, Coia and Gillin 1 , Reference Klein, Hanley and Bayouth 2 These reports also provide directions to the physicist for customising the QA program and designing an institutional protocol. The QA protocol followed by our institution is summarised in the Table 1. Pretreatment QA is also recommended for treatment fields per individual patient plans.Reference Fraass, Doppke and Hunt 3 , Reference McKenzie, Balter, Stingo, Jones, Followill and Kry 4 Traditionally, various radiation detectors such as ionisation chamber, film and different commercially available array detectors are used for the QA checks. These QA methods are time-consuming, expensive and require excess resources. Moreover, in all of these methods, the analysis reports may not be made readily available with the patient treatment chart.
Table 1 Customised QA protocol

Abbreviations: MLC, Multi-Leaf Collimator; QA, quality assurance.
Amorphous silicon Electronic Portal Imaging Device (EPID) replaces radiographic film images for patient treatment verification. Its role in two-dimensional (2D) dosimetry is quite significant for the last 10 years. Several studies have reported the use of portal dosimetry in the verification of treatment fields.Reference Pasma, Dirkx, Kroonwijk, Visser and Heijmen 5 – Reference Vieira, Bolt, Dirkx, Visser and Heijmen 9 Being a real-time dosimeter having good resolution and requiring only minimum set-up time, EPID is preferable for periodic machine QA tests.Reference Yang and Xing 10 – Reference Chang, Obcemea, Sillanpaa, Mechalakos and Burman 12 A study performed by Van Elmpt et al.Reference Van Elmpt, McDermott, Nijsten, Wendling, Lambin and Mijnheer 13 reviewed information provided in various publications including the characteristics of EPIDs of different vendors, their calibrations, EPID 2D dosimetry, and so on. Despite its capability for wide range of QA applications, there is still an uncommonness of clinical use due to the shortage of commercially available EPID dosimetry solutions. This can be resolved by developing codes in MATLAB program (The MathWorks, Inc., Natick, MA, USA), even if the dosimetry software is not available in the institution.
The present study aims to assess the feasibility of using EPID for various QA tests in radiotherapy. The analysis will be carried out on 3 years QA data of IMRT patients and the machine (Clinac-iX) through indigenously developed MATLAB programs.
Methods and Materials
The measurements were performed using Varian Clinac-iX LINAC (Varian Medical Systems, Palo Alto, CA, USA), having 6 MV and 15 MV photon energy modes. The machine was equipped with 60 leaf pairs Multi-Leaf Collimator (MLC) having widths 0.5 cm for the inner 40 pairs and 1.0 cm for the outer 20 pairs at the iso-centre of the LINAC. IMRT and VMAT treatments were performed by using 6 MV photons with a maximum dose rate of 600 MU/Min. The LINAC was calibrated to deliver 1 cGy corresponds to 1 MU at depth of maximum dose, field size of 10 ×10 cm2 and source to surface distance (SSD) of 100 cm. Portal Vision aS1000 (Varian Medical Systems, Palo Alto, CA, USA) is an amorphous silicon flat panel detector with an active imaging area of 40 × 30 cm2 and with resolution of 1024 × 768 pixels. The EPID was attached to a retractable arm and calibrated according to the vendor’s specifications. The response corresponds to 100 MU delivered by a 10 × 10 cm2 radiation field at 100 cm Source to Detector Distance (SDD) was defined as 1 calibrated unit. The centre of the detecting surface of the EPID was aligned to the LINAC cross-wire and all images were acquired at SDD of 100 cm without any additional build-up. Portal dosimetry software enables image acquisition mode for recording fluence patterns of IMRT and VMAT fields, image viewing and analysis.
Software tools
This study was performed by using different software tools developed in our department with the help of MATLAB for image analysis. They are (1) dailyqa_prof.m, (2) fwhm_cal.m and (3) fluence_comparison.m. These programs are capable of determining flatness, symmetry, output constancy, Field Width at Half Maximum (FWHM) and fluence comparison in a simple fashion. The programs require images from Treatment Planning System (TPS) and portal dosimetry in .jpg format. MLC shaper software (Varian Medical Systems, Palo Alto, CA, USA) was used to edit and create customised MLC patterns. Treatment and QA plans were generated on Eclipse (Varian Medical Systems, Palo Alto, CA, USA) TPS. For the scientific interpretation of results, statistical tests have been carried out. We used Pearson correlation coefficient (r) for checking the correlation of the data sets using GraphPad prism (Graphpad software, San Diego, CA, USA, version 6.07) and the equivalence was considered significant for p values < 0.05.
Comprehensive QA program
The periodic QA checks are conducted to ensure that the machine characteristics do not deviate significantly from baseline values, obtained at the time of commissioning of LINAC. Out of various checks described in Table 1, the measurements and analysing methods of the QA tests in our study are as follows.
Profile and output constancy
A quick measurement of output of photon beam was taken daily using EPID before patient treatment begins. This QA procedure involves checks on X and Y profiles of 6 MV photon beam. A field of 20 × 20 cm2 with uniform fluence was prepared by using MLC shaper and was imported as MLC file into a TPS plan prepared with a single field. This plan was delivered on EPID and the measured fluence map was saved in portal dosimetry in .jpg format. The measured fluence was used for the calculation of flatness, symmetry and central axis dose variations of the beam by use of the program, dailyqa_prof.m. The input of the MATLAB program is an image of fluence measured by EPID. One point each in four corners of the measured fluence map was defined by the user in order to draw multiple profiles of 0.5 cm apart along X and Y directions on the fluence plane. Flatness and symmetry were calculated along each and every line by using the following equationsReference Hossain and Rhoades 14 , Reference Nath, Biggs, Bova, Ling, Purdy and van de Geijn 15 and the average value was displayed.
 $${\rm Flatness}{\equals}{{R_{{max}} {\minus}R_{{min}} } \over {R_{{max}} {\plus}{\rm }R_{{min}} }}{\rm }{\times}{\rm }100{\rm \,\%\,}$$
 $${\rm Symmetry}{\equals}{{R_{L} {\minus}R_{R} } \over {R_{L} {\plus}{\rm }R_{R} }}{\rm }{\times}{\rm }200{\rm \,\%\,}$$
where R max and R min are the maximum and minimum readings along the profile within 80% of the field size. R L and R R denote readings at two symmetric points left and right or inferior and superior of X and Y profiles, respectively. Flatness and symmetry calculations were done as per recommendations of International Electro Technical Commission (IEC) 60976. The given program is also able to write the results into Excel spreadsheet every day. These steps are shown in Figure 1. The daily measured flatness and symmetry were compared with the standard readings, measured after tuning the machine. Output constancy was measured from the central reading of the above fluence map and was compared with the standard value. A more accurate investigation on output constancy of photon beam was performed in every week with a calibrated farmer type ionisation chamber (FC65-G) and solid plate phantom (IBA Dosimetry, Schwarzenbruck, Germany). Output constancy was measured with a fixed set up (SSD = 100 cm, depth = 5 cm, field size = 10 × 10 cm2) every Saturday and compared against the daily constancy of the average readings from Monday to Friday.

Figure 1 Daily analysis of flatness and symmetry along X and Y profiles using MATLAB program.
MLC QA
Extensive monthly QA protocol of our institution mainly consists of different MLC checks along with a few mechanical tests. There are several methods available in literature to verify the performance of dynamic MLC (dMLC).Reference Rangel and Dunscombe 16 – Reference Anup Kumar, Suresh Chander, Bhupendra and Arvind 18 The modulation characteristics of intensity modulated beam are determined by position and the speed of MLC leaves. As an initial check of above parameters, MLC patterns were produced by delivery of radiation through arbitrary MLC shapes with varying width and modulation. We have randomly created different shapes with the help of MLC shaper tool and stored in TPS as MLC QA plans. These patterns are shown in Figure 2, which include the shapes of alphabets such as L, T, N, Z, S, O, H and projections such as star, triangle and arrow. The accuracy of dMLC in producing complex intensity modulated fluence in different plans was verified with above patterns. Delivered fluence was captured by portal dosimetry software and was studied with corresponding TPS fluence. Field widths at different arms of above patterns were compared with those between planned coordinates (from MLC shaper), computed dose maps (from TPS) and measured fluence maps (from EPID). In-house developed stand-alone MATLAB code, fwhm_cal.m was used for analysis. Two points were needed to input by user to define the required fields. The comparison process is illustrated in Figure 3. Apart from this, other MLC QA such as picket fence, garden fence and leaf speed stability tests were carried out using films to assure the leaf position accuracy and reproducibility of the gap between leaves, but were not included in the present dosimetric study.

Figure 2 Fluence maps of different MLC shapes created with the help of MLC shaper. First and third columns represent the fluence maps from TPS and second and fourth columns represent fluences measured by EPID.
Abbreviations: EPID, Electronic Portal Imaging Device; MLC, Multi-Leaf Collimator; TPS, Treatment Planning System.

Figure 3 Comparison of TPS-computed and EPID-measured fluences of an MLC pattern (Z shape). FWHM is calculated and displayed.
Abbreviations: EPID, Electronic Portal Imaging Device; FWHM, Field Width at Half Maximum; MLC, Multi-Leaf Collimator; TPS, Treatment Planning System.
Patient-specific QA
Patient-specific QA has been performed for all IMRT and VMAT patients by using either EPID or 2D array detectors. MatriXX 2-D (IBA Dosimetry, Schwarzenbruck, Germany) ionisation chamber array system consisting of 1020 vented chambers was used for all pre-treatment QA till the end of 2013. The volume of each detector was 0.08 cm3. The spatial resolution of the detector array was 7.6 mm and inherent water equivalent build-up thickness was 3.2 mm. The QA plan was calculated with a solid phantom in Eclipse TPS and was transferred to the OmniPro IMRT (IBA Dosimetry, Schwarzenbruck, Germany) verification tool. These plans were delivered to the detector and the measured dose maps were compared with corresponding TPS computed dose maps.
The MatriXX 2-D array detector demands more human resource and time in the large patient-specific QA workload. In such a case, EPID is an efficient option for patient-specific QA,Reference Talamonti, Casati and Bucciolini 6 – Reference Vieira, Bolt, Dirkx, Visser and Heijmen 9 because of its least set-up time and better spatial resolution compared to 2D array detectors.Reference Esch, Huyskens, Hirschi, Scheib and Baltes 8 Most of the patient-specific QA was done with EPID and selective cases were remeasured with MatriXX 2D array. Three years of QA data from four anatomic regions, pelvis, thoracic and abdomen, head and neck (HN) and brain was studied. EPID-based QA of these 80 IMRT plans consisted of 20 patients in each group were also measured and studied retrospectively by using 2D array detector. The quantitative evaluation was performed in terms of the gamma indexReference Niyas, Abdullah and Noufal 19 of the measured against the TPS-calculated fluence. Percentage value of area gamma with a value less than 1 was calculated for all points in the fluence map. The standard passing criterion of 3% for dose difference and the 3 mm for distance to agreement (3%/3 mm) were used for analysis.Reference Nelms and Simon 20 The minimum, 25% percentile, median, 75% percentile, maximum, mean and standard deviation for the gamma values were calculated and tabulated. The correlation of measured data between EPID and 2D array was analysed by Pearson test and correlation coefficients were calculated. The measured EPID fluence of some of these patients was also checked by using indigenously developed image comparison tool, fluence_comparison.m. This program required two images, (1) TPS calculated and (2) EPID measured and user-defined origin for both images. Difference of two images was taken and percentage pixel differences were calculated, as shown in Figure 4.

Figure 4 Image comparison between TPS generated and EPID measured 2D fluences of an MLC shape and a patient-specific QA plan. Percentage difference and RMSE are also calculated by using MATLAB program.
Abbreviations: EPID, Electronic Portal Imaging Device; MLC, Multi-Leaf Collimator; RMSE, root mean square error; QA, quality assurance; TPS, Treatment Planning System.
Results
Profile and output constancy
The average values of flatness and symmetry along X axis were 0.8481 ± 0.0895 and 1.148 ± 0.1813 and those along Y axis were 0.9700 ± 0.1503 and 1.2155 ± 0.3141. The institutional data are plotted over 3 years, which is illustrated in Figure 5. Daily output of 6 MV photon beam was found to be correlated with the weekend value obtained through solid phantom measurements. The data drift is plotted in the consecutive weeks for all 3 years and a good correlation was observed, which is plotted in Figure 6. Pearson correlation coefficient (r) is 0.941 (p = 0.0001), 0.888 (p = 0.0188) and 0.917 (p = 0.0007) for the years of 2014, 2015 and 2016, respectively.

Figure 5 Three years institutional data of flatness and symmetry along X and Y profiles.

Figure 6 The comparison of 6 MV photon beam output constancy between daily EPID and weekly solid phantom measurement.
Abbreviation: EPID, Electronic Portal Imaging Device.
MLC QA
The accuracy of dMLC while shaping the complex IMRT fields was studied and verified. The comparison data in terms of FWHM at different portions of various fields showed good agreement between TPS generated and EPID measured MLC positions. Maximum deviation was 2.9%, obtained for triangle shape. The width of fields planned by MLC shaper was also compared with EPID measured FWHM and found in correlation with each other. A slightly higher variation is observed for small field comparison and all the data are given in Table 2. The calculated correlation coefficient (r) for TPS vs. EPID and MLC shaper vs. EPID images are 0.999 (p < 0.0001) and 0.998 (p < 0.0001), respectively.
Table 2 Detailed comparison report of field widths planned by MLC shaper, FWHM computed and measured by TPS and EPID for various MLC shapes at different locations

Abbreviations: EPID, Electronic Portal Imaging Device; FWHM, Field Width at Half Maximum; MLC, Multi-Leaf Collimator; TPS, Treatment Planning System.
Patient-specific QA
The overall gamma passing rate during the mentioned period of 3 years for all IMRT plans measured using EPID and compared with respect to their TPS plans was studied. The percentage of points within the passing range (γ 3 mm – 3%) is 97.6 ± 5.898, 98.3 ± 1.657, 97.4 ± 5.372 and 98.1 ± 2.004 for pelvis, thoracic and abdomen, HN and brain patients, respectively. The comparison statistics of total 80 patients along with retrospective study of the same patients with an independent detector is given in Table 3. Percentage difference of pixels in fluence comparison for selected patients using MATLAB code fluence_comparison.m exhibited maximum difference of 8.6%.
Table 3 Gamma results of fluence comparison between TPS computed vs. MatriXX 2-D measured for four different anatomic regions. % difference of pixels (TPS vs. EPID) computed by MATLAB code is also tabulated

Abbreviations: EPID, Electronic Portal Imaging Device; TPS, Treatment Planning System; SD, standard deviation.
Discussion
The EPID is widely used in recent years owing to its fastness, simplicity and flexibility. This retrospective study on patient-specific QA for a period of three years including 350 IMRT plans revealed our experience with EPID as an efficient dosimeter. In the present study, we have investigated the feasibility of EPID as an alternative to the 2D array in routine quality checks. The QA checks on daily beam measurements yield the status of beam profile quickly. The measurements also indicate that the output constancy of machine did not show any major variation from corresponding solid phantom data. The mentioned MLC QA verified (1) the agreement between TPS computation of a field width and the user-defined width used in MLC shaper and (2) capability of MLC for delivering the complex fields. Patient-specific QA exhibited the agreement between planned and delivered fluence, which validated the deliverability of IMRT plans. The study also performed comparison of two measurement systems, EPID and MatriXX 2D array, in IMRT verification of number of patients who had completed treatment in our radiation therapy centre. The results of 2D fluence comparison between these two detectors showed good agreement in fluence matching and statistically significant correlation was obtained. The stated comparison tool using MATLAB also showed deviation of less than 10% for the analysed cases. However, these data did not show any significant correlation with any of other two comparison data.
There are different means to measure 2D dose distributions. Film and multidimensional array detector are normally used for checking the MLC characteristics, beam profile and 2D dose maps. Film dosimetry has the advantages of high spatial resolution, but lacks an accurate reading system.Reference Bucciolini, Bounamici and Casati 21 , Reference Ju, Ahn, Huh and Yeo 22 It is an offline dosimetry system with a short dynamic range and an energy-dependent dose response. The 2D array can be connected to a computer and provides real-time measurement which can easily be read out. Even though resolution is limited, it has the advantage of storage and post-processing capability of the measured data.Reference Tyler, Vial, Metcalfe and Downes 23 – Reference Saminathan, Manickan, Chandraraj and Supe 25 However, in current clinical practice, the setting up of both the above detectors is a time-consuming task. The total machine time and manpower requirement for whole QA procedure is always a concern. At the same time, EPID is directly measurable with minimum uncertainty in set-up and gives images with greater spatial resolution. The detector is independent of position of laser, couch and optical distance reading and hence the measurement set up is very easy. Increased detecting surface, high-density detector, high contrast and linear response to exposure made EPID an accurate dosimeter. Hence, EPID is recommendable for maximum number of QA tests in routine checks.
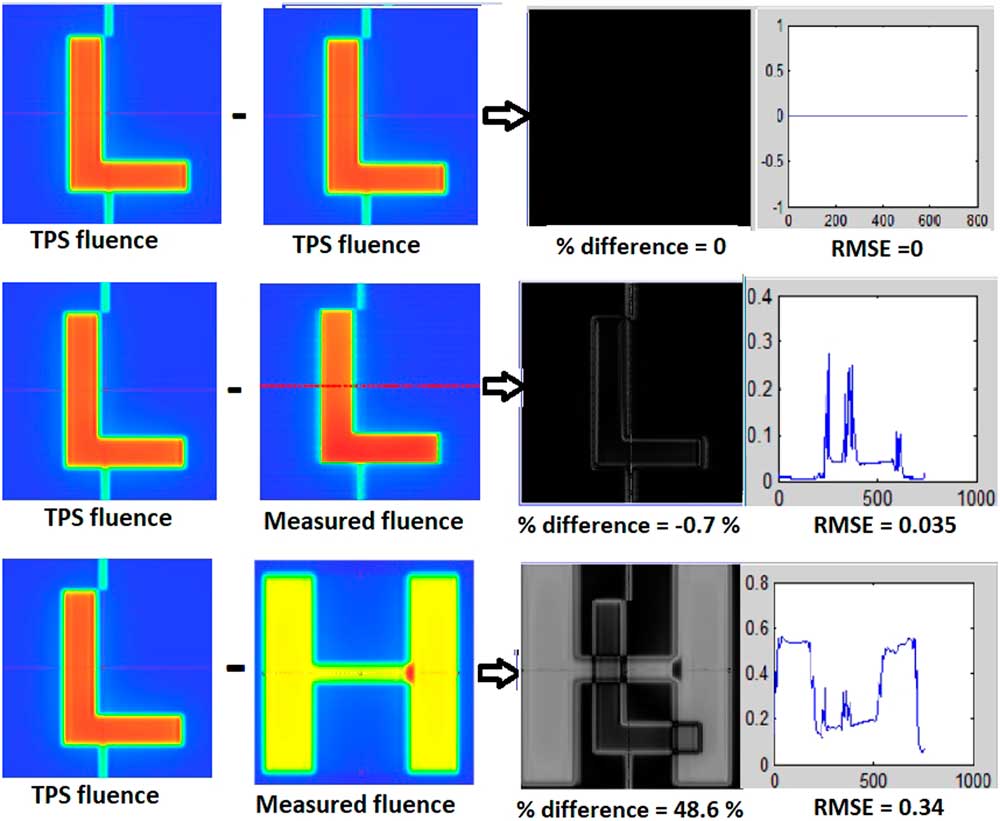
In the present study, we have developed MATLAB programs for EPID image analysis. These programs are written by use of image handling codes, used for image reading, analysis and comparison of multiple images. The elementary idea of calculation of flatness, symmetry, FWHM and pixel comparison of two images were taken and expanded with MATLAB codes. The software programs permit the user to import image files and these simple programs could easily be used in practice for the QA analysis. All these MATLAB programs were validated independently. The set of images generated by TPS and its corresponding images measured by EPID were compared in three different ways and the results are tabulated in Table 4. Percentage difference between same images, corresponding images (TPS vs. EPID of same fluence) and different set of images were calculated. Figure 7 illustrates the comparison of fluence images between two MLC shapes. The observed difference (% value) and root mean square error (RMSE) are (0.0%, 0.0), (−0.7%, 0.04) and (48.6%, 0.34), when the comparison was done between TPS fluences of an image and its copy, between TPS and measured fluence and between two different fluence (L and H shapes), respectively. The comparison of data that corresponds to different fluence shapes are shown in Table 4, validates the accuracy of the program.

Figure 7 Validation of image comparison MATLAB code by comparing three sets of images. From top to bottom row: TPS fluence of an MLC shape (L) and its own copy, TPS vs. EPID measured fluences of an MLC shape (L) and TPS vs. EPID measured fluences of two different MLC shapes (L and H).
Abbreviations: EPID, Electronic Portal Imaging Device; MLC, Multi-Leaf Collimator; TPS, Treatment Planning System.
Table 4 Comparison results (% difference and RMSE) of different fluence shapes, calculated using MATLAB code. Large disagreement is observed in the comparison of unmatched images.

Abbreviations: EPID, Electronic Portal Imaging Device; MLC, Multi-Leaf Collimator; RMSE, root mean square error; TPS, Treatment Planning System.
Various literatures explain the limitations of EPID dosimetry.Reference Van Elmpt, McDermott, Nijsten, Wendling, Lambin and Mijnheer 13 , Reference Bailey, Kumaraswamy, Bakhtiari, Malhotra and Podgorsak 26 More prominent are the over sensitivity in lower energies when the beam is scattered by bulk layer of the detector, ghosting and image lag due to the trapping of charges within the photodiode layer. EPID is unable to measure large radiation fields because of the smaller sensitive area and lower spatial resolution compared to that of film dosimetry. Also, the high Z materials of the detector deviate EPID away from the water equivalent characteristics. There are different algorithms and dosimetry solution available now for correcting the EPID measured response. These softwares modified EPID technology more versatile in both imaging and dosimetry. The further advancement in the development of softwares empowered EPID as an efficient tool for in-vivo dosimetry.Reference McDermott, Wendling, Sonke, van Herk and Mijnheer 27 , Reference Mans, Wendling and McDermott 28 The indigenously developed MATLAB based image comparison tool is not a fully-fledged program as there is no quantitative index other than the percentage difference and standard deviation for fluence comparison. The frequent irradiation of EPID may cause deterioration of its signal and demands consequent periodic calibration. The present study is limited to the photon beams for establishing the routine checks of flatness, symmetry and constancy of profile, whereas it is not extended to the case of electron beams. Further work is needed to develop certain indices for effective comparison of fluence by taking care of dose difference and distance to agreement.
Data acquired from QA checks and analysed in the present study establishe a pivotal role of EPID in the various QA programs. Usage of EPID in the daily QA checks ensures a quick measurement of profile and output constancy of photon beam. Also, EPID guarantees that no more than 5 minutes are taken to carry out the Daily QA tests in the LINAC room. MATLAB-based MLC pattern comparison enables a quick and consistent method for MLC QA checks. These tests are added to the monthly QA protocol in addition to the film-based MLC checks. Though it may not be possible to replace the currently available 2D comparison tool in patient-specific QA, we have used the MATLAB based image comparison method as a quick check of delivered fluence. Moreover, it will be more beneficial for those who do not have any commercial EPID dosimetry software packages. Hence, the EPID dosimetry in combination with the indigenously developed MATLAB program has a potential use in many of the routine QA.
Conclusion
EPID, at present is a versatile, fast and effective tool for LINAC QA. Three years institutional data analysed in the present study establishes the reliability and consistency of portal detector in the dosimetry. A comprehensive QA protocol developed in the study is more suitable for frequent daily measurements, patients specific QA and MLC checks. Using the protocol, EPID based measurements can be performed without much time requirement in LINAC room.
Acknowledgements
All patient data were from Baby Memorial Hospital, Kerala. Authors would like to thank Prof. T.S. Sankaran Nair for his assistance in the data collection. Thanks are also due to Dr. P.A. Subha, Head of the Post Graduate and Research Department of Physics, Farook College, Kerala for providing the research facilities. The authors are also thankful to Dr. Narayanan Kutty Warrier, Medical Director, MVR Cancer Centre & Research Institute, Kerala for permitting the facilities for data analysis.