


INTRODUCTION
Dissolved inorganic carbon (DIC) in the ocean represents one of the largest exchangeable carbon pools on Earth, and it is directly linked to oceanic organic carbon production and cycling. The ocean is the major sink of atmospheric CO2; about one-third of the anthropogenic CO2 produced each year is absorbed by the ocean through air-sea exchange and dissolved as DIC in the ocean (Gruber et al. Reference Gruber, Gloor, Fletcher, Doney, Dutkiewicz, Follows, Gerber, Jacobson, Joos, Lindsay, Menemenlis, Mouchet, Müller, Sarmiento and Takahashi2009). The distribution and cycling of DIC in the ocean, therefore, play crucial roles in the global carbon cycle and climate change (McKinley et al. Reference McKinley, Takahashi, Buitenhuis and Chai2006; Valsala et al. Reference Valsala, Maksyutov, Telszewski, Nakaoka, Nojiri, Ikeda and Murtugudde2012; Yasunaka et al. Reference Yasunaka, Nojiri, Nakaoka, Ono, Mukai and Usui2014).
Measurement of radiocarbon abundances of DIC in the ocean is a powerful technique for studying the carbon cycle, water mass transport, and circulation timescales in the ocean (Key et al. Reference Key, Quay, Jones, McNichol, Reden and Schneider1996; Druffel et al. Reference Druffel, Bauer, Griffin, Beaupré and Hwang2008; Santos et al. Reference Santos, Ferguson, Acaylar, Johnson, Griffin and Druffel2011). During the World Ocean Circulation Experiment (WOCE) Program and the ongoing Climate Variability and Predictability Program (CLIVAR), a large number of DIC samples have been collected from the world oceans and their Δ14C compositions have been measured (Stuiver et al. Reference Stuiver, Östlund, Key and Reimer1996; McNichol et al. Reference McNichol, Schneider, von Reden and Gagnon2000). Results from Δ14C-DIC measurements have provided great insight into our understanding of the oceanic carbon cycle and ocean circulation processes, as linked to climate variability (Stuiver et al. Reference Stuiver, Quay and Ostlund1983; Druffel et al. Reference Druffel, Williams, Robertson, Griffin, Jull, Donahue, Toolin and Linick1989, Reference Druffel, Bauer, Griffin, Beaupré and Hwang2008; Broecker et al. Reference Broecker, Sutherland, Smethie, Peng and Ostlund1995; Key Reference Key1996).
Several methods have been developed to extract DIC from natural waters for high-precision 14C analysis by accelerator mass spectrometry (AMS). The most commonly used method in many 14C laboratories for DIC study is based on McNichol et al. (Reference McNichol, Jones, Hutton and Gagnon1994), which provides a relatively rapid and high-precision way to strip CO2 from acidified seawater samples. More recently, Gao et al. (Reference Gao, Xu, Zhou, Pack, Griffin, Santos, Southon and Liu2014) developed a headspace method for extraction of seawater DIC for AMS 14C analysis. This method requires much less water volume (30–40 mL) and no nitrogen gas stripping on a vacuum line is needed. Seawater is simply acidified in a 64-mL septum-sealed cap vial, and the CO2 produced in the headspace can be collected using a gas-tight syringe and further processed for 14C analysis. The headspace method is very simple and rapid, but the extraction efficiency of DIC is rather low (46.6±3.9%). In addition, a small isotopic fractionation of 13C (≤0.6‰) also occurred due to the partial extraction of DIC (Gao et al. Reference Gao, Xu, Zhou, Pack, Griffin, Santos, Southon and Liu2014). In many cases when quantitative determination of DIC concentrations in seawater is needed, this method has limitations.
This article reports a modified DIC extraction method based on McNichol et al. (Reference McNichol, Jones, Hutton and Gagnon1994). The method is relatively simple and effective and has been used in our laboratory to extract DIC from natural waters for 14C analysis by AMS. Using the method, we report the first data set of 14C values of DIC depth profiles collected in the shelf and slope of the East China Sea (ECS), one of the largest marginal seas in the northwest Pacific Ocean.
METHODS
Extraction of DIC
DIC was extracted from water samples as gaseous CO2 and the extracted CO2 was purified on a vacuum system. As shown in Figure 1, the vacuum line system includes a sample connection joint that can be connected with 100-mL borosilicate glass bottles with ground-glass-joint stripping probes (1); a cold (–80°C) water trap (2); a liquid nitrogen trap for freezing CO2 (3); a vacuum gauge (7) (Agilent, 1×10⁻⁴ to 760 Torr) and a pressure transducer (8) (MKS, 0–1000 Torr); a calibrated volume cold-finger for CO2 measurement and quantification (4); a CO2 transport connection joint (5); and a liquid nitrogen protection trap (6) leading to an oil-free turbomolecular pump (9) (Agilent TPS Compact Dry TV301).
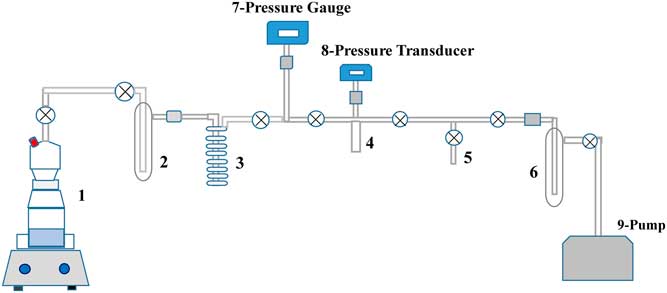
Figure 1 General scheme of the reaction and stripping probe (1) and the vacuum line system for DIC extraction from seawater.
To test the extraction efficiency of the method and blank level of our new vacuum line, we used two inorganic materials with very different 14C ages: (1) reagent-grade sodium carbonate standard and (2) a modern coral. A sodium carbonate standard was dissolved directly in preboiled and N2-bubbled Milli-Q™ water (to remove dissolved CO2) to make a 100-mM stock DIC solution. Based on the DIC concentration ranges measured in natural waters, we tested three concentrations: 1, 2, and 3 mM. Three precleaned 100-mL borosilicate glass bottles with ground-glass-joint stripping probes (Figure 1) were pumped down on the vacuum line to 10–3 Torr. In a N2-filled bag (to avoid contact with atmospheric CO2), 50 mL of each standard DIC solution was injected into the glass bottle through a rubber septum-sealed tube on the top side of the probe using a syringe and a needle. Then, 1 mL of 85% H3PO4 acid was injected into the bottle to acidify the DIC sample to pH≤2. The glass bottles with acidified DIC samples were removed from the N2 bag and placed in a hot water bath (70°C) for 30 min and shaken by hand several times. At pH≤2, all the forms of DIC (carbonate, bicarbonate, and CO2) dissolved in water will become CO2 because the solubility of CO2 in water is a function of temperature and pressure. Henry’s law shows that at 70°C under vacuum, the solubility of CO2 in water is <6.0×10⁻⁵ μmol/L, so it is expected that all CO2 dissolved in water escaped into the probe headspace. The glass bottle was removed from the hot water bath, cooled down for 5 min, then placed on a stir plate and attached at the top to the vacuum line. After evacuation, the stopcock on the top of the stripping probe was opened and the CO2 generated was collected cryogenically into the liquid nitrogen trap. During this process, CO2 was extracted under static vacuum conditions for 3 min and then pumped for 1 min to remove any uncondensed gases. It should be mentioned that since a considerable amount of water will be vacuumed out, an efficient cold (–80°C) water trap is necessary or adding second cold water trap to avoid a small amount of water carried into the liquid nitrogen trap. Usually, we clean and dry the water trap after processing every five samples. After the volume was measured and recorded, the CO2 was flame-sealed inside 6-mm-outer-diameter Pyrex™ tubes for 14C and 13C analysis. The whole process takes <15 min for each sample.
We also used modern coral (growing <30 yr) to test the extraction efficiency and vacuum line blank. The coral was first cleaned and ground. Then, 5-, 10-, and 15-mg particles of coral were weighed into three 100-mL borosilicate glass bottles and then connected to the ground-glass-joint stripping probes. The bottles were then pumped down on the vacuum line to 10–3 Torr, and 50 mL of preboiled and N2-bubbled Milli-Q water was injected into each bottle. After injecting 1 mL of 85% H3PO4 acid, the reaction bottles were placed in a 70°C hot water bath for 30 min. DIC produced from the dissolution of coral was extracted as CO2 and collected on the vacuum line as described earlier.
Extraction of DIC from Seawater
DIC water profile samples were collected from the shelf and slope of the East China Sea (ECS) at six stations during a cruise in July 2014 on the Japanese Research Vessel (R/V) Shinset Maru (Figure 2). The ECS is one of the largest marginal seas on the northwest Pacific with a contiguous shelf area of about 0.75×10⁶ km2. Many oceanographic processes of the ECS are strongly influenced by the Changjiang (Yangtze) River, the largest river in China and third largest river in the world (Milliman and Meade Reference Milliman and Meade1983). In addition, the shelf break region of the ECS receives a major influence from the upwelled subsurface water of the northward-flowing Kuroshio Current, providing major nutrient supplies to the region (Li Reference Li1994; Guo et al. Reference Guo, Miyazawa and Yamagata2006). For DIC water collection, we used the protocol described in McNichol and Jones (Reference McNichol and Jones1991). Water was collected (after overflowing ~100 mL) in prebaked 100-mL glass bottles with ground-glass stoppers using precleaned silicone tubing connected directly to the Niskin bottle. After adding 50 μL of saturated HgCl2 solution, the bottles were capped tightly with grease-coated ground-glass stoppers and secured with rubber bands to make a gas-tight seal. In the laboratory, the extraction procedure is the same as described earlier. In a N2-filled bag, 50 mL of water sample was injected into a pre-evacuated 100-mL borosilicate glass bottle with ground-glass-joint stripping probes. After injecting 1 mL of 85% H3PO4, the glass bottle was placed in a 70°C hot water bath for 30 min and DIC was extracted as CO2 and collected on the vacuum line as described.
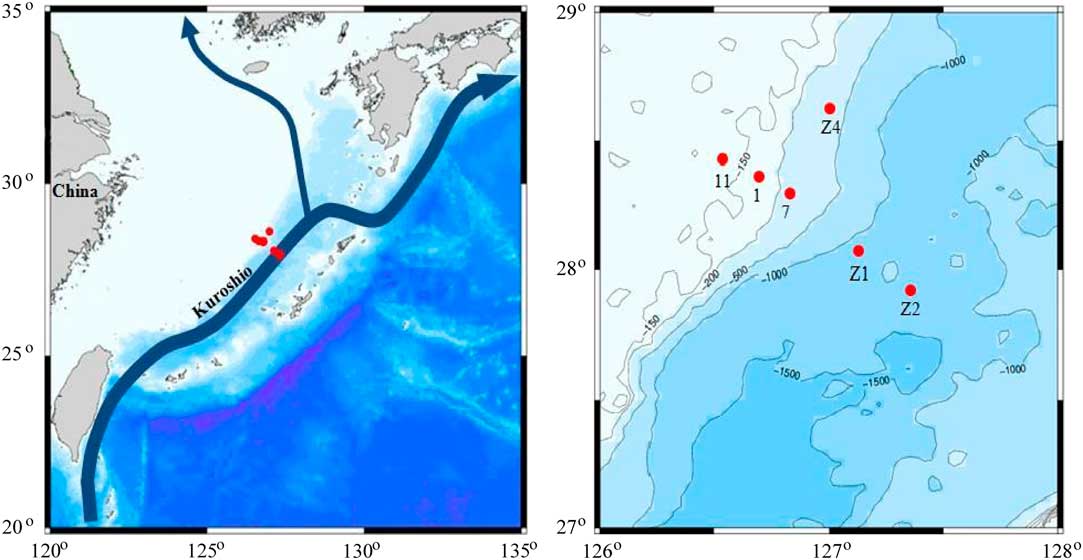
Figure 2 Map showing the water sampling stations in the shelf and slope regions in the East China Sea of the northwest Pacific during the cruise in July 2014. The region is influenced largely by the northward-flowing Kuroshio Current.
Concentration of DIC Analysis
To determine the extraction efficiency, we measured DIC concentrations before and after extraction for all standard DIC solutions. The concentrations of DIC water profiles were also measured. DIC was measured using a Shimadzu TOC-L analyzer equipped with an ASI-V autosampler, using the total inorganic carbon (IC) mode. The concentration of DIC was calibrated using a 5-point calibration curve prepared from reagent-grade sodium carbonate and sodium bicarbonate dissolved in DIC-free Milli-Q water as the IC standard. The instrument blank and DIC values were checked against DIC reference material (CRMs, Scripps Institute of Oceanography, University of California San Diego). Total blanks associated with DIC measurements were less than 3 μM, which is about <0.15% of seawater DIC concentrations, and the analytic precisions on triplicate injections were <3%.
Isotopic Measurement
Purified CO2 gas samples were sent to the National Ocean Sciences Accelerator Mass Spectrometry (NOSAMS) facility at Woods Hole Oceanographic Institution (WHOI) for 13C and 14C analysis. A small split fraction of CO2 was measured for δ13C using a VG isotope ratio mass spectrometer (IRMS) and the rest of the CO2 was graphitized for Δ14C analysis using AMS. Values of δ13C are reported in ‰ relative to the VPDB standard and values of Δ14C are reported as the modern fraction based on the modern reference material used (McNichol et al. Reference McNichol, Jones, Hutton and Gagnon1994). The conventional 14C ages (years before present, or yr BP) were calculated following Stuiver and Polach (Reference Stuiver and Polach1977).
RESULTS
Method Validation
Our modified method showed very good extraction efficiency and high precision of both 13C and 14C measurements as compared to the standard materials (Table 1). The results indicate that the extraction efficiencies are in the range of 96–98% for the DIC solutions tested. The differences of measured average values of δ13C (–5.17‰, 1σ=0.01) and Δ14C (40.3‰, 1σ=3.2) of extracted coral DIC are less than 2% and 4% compared to the values of the coral standard; the mean values are almost the same (δ13C=14.8‰, 1σ=0.10; Δ14C=993‰, 1σ=0.8) between the extracted sodium carbonate DIC and the standard (Table 1), indicating that the blank effect from the vacuum line during extraction processing is very small. Compared to the traditional extraction method of McNichol et al. (Reference McNichol, Jones, Hutton and Gagnon1994), our modified method used water bath heating and eliminated the use of N2 gas bubbling for stripping during extraction of CO2. The sample handling process is relatively simple and rapid. In our laboratory, we usually process 10 DIC samples a day.
Table 1 Comparison of measured Δ14C and δ13C values of coral standard and Na2CO3 standard and prepared DIC extracted using the method.

DIC Concentration Profiles in the ECS
All hydrographic data and measurements are summarized in Table 2. The temperature ranged from 26.31 to 29.34 in the surface waters (5–10 m) and decreased with depth at all stations (Figure 3a). For the four shelf stations (1, 7, 11, and Z4), although their water depths are shallower, the temperature decreased more rapidly and the values were significantly lower than the two slope stations Z1 and Z2. The salinity ranged from 33.92 to 34.87 for the stations (Table 2). As plotted in Figure 3b, salinity was lower in the surface and increased with depth in the upper 100 m and then decreased for all stations. For Stations Z1 and Z2, the salinity values were identical below 600 m depth. A transectional distributions of sigma-t plot for the sampling stations (Figure 4) showed that the water mass in the sampling area is composed of mixed Kuroshio and ECS shelf waters. This is consistent with the salinity profiles of the stations as plotted in Figure 3b. The concentration profiles of DIC ranged from 1.777 to 2.045 mM/kg for the four shelf stations (Stations 1, 7, 11, and Z4), and from 1.720 to 2.142 mM/kg for the two deep slope stations (Z1 and Z2), respectively. As plotted in Figure 5a, DIC concentrations increased with depth for all stations (except 160 m at Station 1). In the surface water (<20 m), concentrations of DIC showed fewer variations (1.749 to 1.822 mM/kg) among the stations. DIC concentrations increased more rapidly with depth for the shelf stations compared with the slope stations (Z1 and Z2), and DIC was higher in the shelf water column (<420 m) than in the slope water column at the same depths (Figure 5a).

Figure 3 Depth profiles of temperature (°C) and salinity (‰) for the six sampling stations in the East China Sea during the cruise in July 2014.

Figure 4 Transectional distribution of sigma-t (density 1000) for the sampling stations in the East China Sea during the cruise in July 2014.
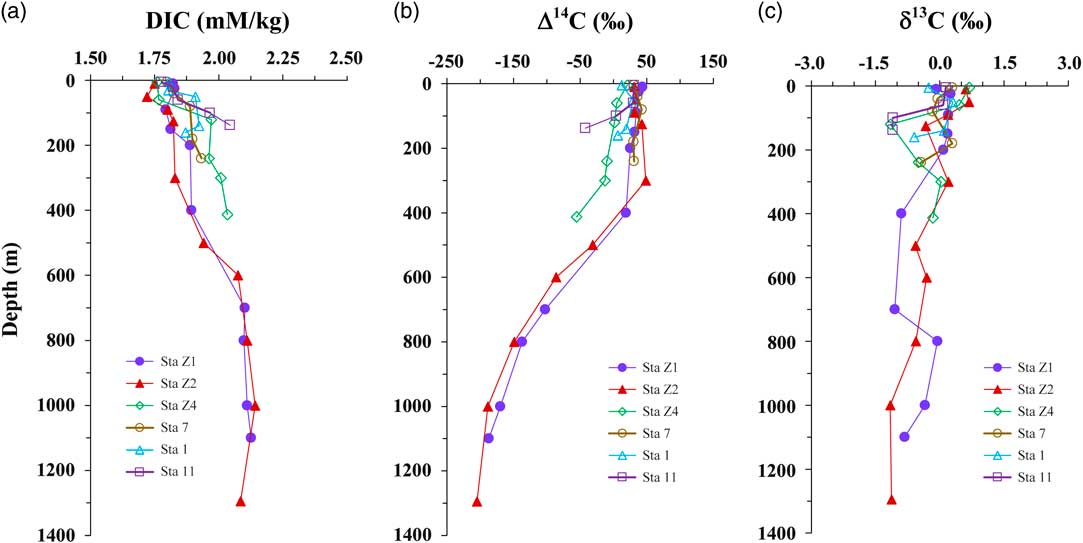
Figure 5 Depth profiles of DIC, Δ14C-DIC, and δ13C-DIC measured in the shelf and slope stations in the East China Sea
Table 2 Hydrographic data, DIC concentration, and isotopic natural abundance in DIC for water samples collected from the NW Pacific margin in July 2014.

Carbon Isotopic Signatures of DIC in the ECS
Using our DIC extraction method, we processed 41 DIC samples collected from the shelf and slope of the ECS. The measured DIC Δ14C values ranged from 42.5‰ to –55.6‰ for the shelf stations and 48.4‰ to –205.1‰ for the slope stations. The depth profiles of Δ14C-DIC showed an opposite trend to the concentrations of DIC. Higher DIC concentrations in the shelf stations 11 and Z4 had lower Δ14C-DIC values (Figure 5b). In the surface waters (<20 m), values of Δ14C showed fewer variations and then decreased with depth in general. At Stations 11 and Z4, the Δ14C-DIC values (3.9‰ to –55.6‰) at 100–413 m depth are significantly lower than the values of the slope stations Z1 and Z2 at the same water depth (18.7‰ to 48.4‰). Below 400 m depth, the Δ14C-DIC values of Stations Z1 and Z2 are very similar and decreased with depth. Depth profiles of δ13C-DIC are plotted in Figure 5c. Values of δ13C-DIC ranged from 0.69‰ to –1.15‰ for the four shelf stations (1, 7, 11, and Z4) and from 0.68‰ to –1.16‰ for the two slope stations Z1 and Z2. It appears that no clear differences and trend exist for δ13C-DIC between the shelf and slope stations.
DISCUSSION
Influence of Kuroshio on DIC in ECS
The ECS is one of the largest marginal seas in the northwest Pacific Ocean. Many oceanic processes and material transport in the inner shelf range of ECS are affected mostly by the input of Changjiang (Yangtze), the largest river in China and the second largest river in the world in terms of freshwater discharge (Milliman and Meade Reference Milliman and Meade1983). In the outer shelf and slope range of the ECS, it is affected largely by the northward-flowing Kuroshio Current (Delcroix and Murtugudde Reference Delcroix and Murtugudde2002; Lie et al. Reference Lie, Cho, Lee and Lee2003; Kamidaira et al. Reference Kamidaira, Uchiyama, Mitarai and Sakagami2014; Hu et al. Reference Hu, Wu, Cai, Gupta, Ganachaud, Qiu, Gordon, Lin, Chen, Hu, Wang, Wang, Sprintall, Qu, Kashino, Wang and Kessler2015). The influence of the Kuroshio on the ECS is primarily associated with the nutrient-rich mid-depth water of the current that upwells into the slope and shelf ranges of the ECS (Qiu Reference Qiu2001; Andres et al. Reference Andres, Wimbush, Park, Chang, Lim, Watts, Ichikawa and Teague2008; Bai and Zhang Reference Bai and Zhang2008). For the slope stations Z1 and Z2, it appears that the modern Δ14C-DIC was well mixed in the top 400 m. The high DIC concentrations with the lower Δ14C-DIC values observed in the shelf stations clearly indicate influence by different water masses with high DIC concentrations and low values of Δ14C-DIC (Figures 5a, b). Although the Changjiang (Yangtze) River input plays an important role in affecting the ECS, these stations were not likely affected by freshwater input from the Changjiang (Yangtze) River because the salinity distributions in the shelf stations were high and quite uniform without any freshwater dilution signals. DIC concentrations in the Changjiang (Yangtze) River ranged from 1.38 to 1.73 mM/L and the riverine Δ14C-DIC values were low, ranging from –156‰ to –137‰, as we measured during the low and high flood periods in 2014 (Wang et al. Reference Wang, Ge, Xu, Xue and Luo2016). However, the DIC concentrations increased to 1.80–2.23 mM/L and Δ14C-DIC increased to the modern values of –2.1‰ to 16.0‰ beyond the estuarine mixing at the river mouth. The modern Δ14C-DIC values in the shelf waters of ECS are mainly controlled by air-sea mixing (Wang et al. Reference Wang, Ge, Xu, Xue and Luo2016) and the Δ14C-DIC values should be well mixed in the inner shelf because the water depth of the shelf range in the ECS is relatively shallow (<100 m, Figure 2). It is therefore impossible that the well-mixed shelf waters could bring low Δ14C-DIC values to the bottom water depth at Stations 11 and Z4. Decomposition of 14C-depleted dissolved organic carbon (DOC) in the shelf waters could contribute to the low Δ14C-DIC, but this effect is relatively small when comparing the DOC pool with the much bigger DIC pool in the ocean (Kashgarian and Tanaka Reference Kashgarian and Tanaka1991; Bauer et al. Reference Bauer, Druffel, Wolgast, Griffin and Masiello1998; Druffel et al. Reference Druffel, Bauer, Griffin, Beaupré and Hwang2008). In addition, sediment contributions might change Δ14C-DIC values in the bottom water. Turbidity in the bottom water (413 m, Figure 6) is slightly higher than in the shallower water in Station Z4; however, it is very similar to that in Station 7 but without Δ14C-DIC depletion, suggesting a minor sediment effect. Similarly, the turbidity profile in Station 11 is comparable with that of Station 1 (Figure 6), but it still cannot account for the ~50‰ Δ14C-DIC difference caused by sediment impact between these two stations. We believe that this is likely evidence of intrusion of Kuroshio intermediate water (500–800 m) into the shelf range of the ECS. This intrusion more likely took place as upwelling of intermediate Kuroshio water along the bottom (Guo et al. Reference Guo, Miyazawa and Yamagata2006; Yang et al. Reference Yang, Yin, Liu and Feng2011, Reference Yang, Yin, Liu, Bai, Qi and Chen2012). The sigma-t diagram as showing in Figure 4 also provides clear evidence supporting the idea that the Kuroshio intermediate water upwells onto the ECS shelf and affected the bottom waters at Stations Z4 and 11 (Figure 4). It seems that this upwelling intrusion had almost no effect on the surface water (<100 m depth) for the shelf stations we sampled. However, we are not able to tell how far and how strongly this Kuroshio intrusion extended into the shelf range beyond Stations 11 and Z4. This intrusion we observed could reflect a smaller-scale or eddy effect rather than a large-scale Kuroshio intermediate water influence. If we use the average surface Δ14C-DIC value of 26‰ measured at Stations 11 and Z4, and the average Δ14C-DIC value of –100‰ for the intermediate Kuroshio water (500–800 m) as the end-member for the two water masses, we calculate that a contribution of about 54–65% Kuroshio intermediate water is required to produce the Δ14C-DIC values observed in the bottom waters at Stations 11 and Z4. This result agrees well with the estimate by Bai and Zhang (Reference Bai and Zhang2008) using rare earth elements that 30–40% of Kuroshio intermediate water supplies the outer-shelf bottom water (100–130 m depth).
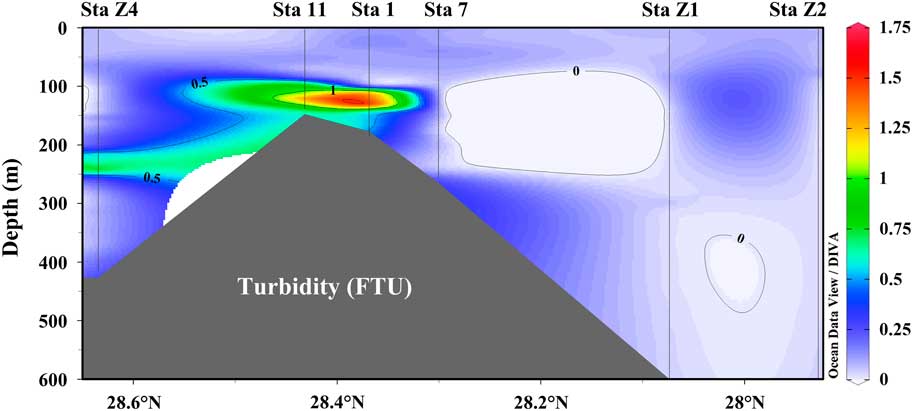
Figure 6 Transectional distribution of turbidity in the shelf and slope stations in the East China Sea.
Comparison of Δ14C-DIC in the Northwest Pacific Ocean
A large number of DIC samples was collected for Δ14C measurements in the northwest Pacific during the WOCE Program (Key Reference Key1996; McNichol et al. Reference McNichol, Schneider, von Reden and Gagnon2000). Stations P09-21 and P09-26 from the transection line P09 during the WOCE cruise 49RY9407 in 1994 (R/V Ryofu Maru) were nearby our Z1 and Z2 sites. As an attempt, we compared the Δ14C-DIC values of Stations Z1 and Z2 with the results from Stations P09-21 and P0-26 measured 20 years ago (http://cdiac.ornl.gov/ftp/oceans/p09woce/) to see what changes have happened for Δ14C-DIC in the region. As shown in Figure 7, we also compared the Δ14C-DIC values reported for a subarctic station (NWP) by Tanaka et al. (Reference Tanaka, Otosaka, Wakita, Amano and Togawa2010). Both PO9-21 and PO9-26 were in the Kuroshio region. The NWP site Δ14C-DIC profile was collected in 2006 (Tanaka et al. Reference Tanaka, Otosaka, Wakita, Amano and Togawa2010) and it was in the eddy of the Western Subarctic Gyre region and influenced by the southward-flowing Oyashio (Figure 7). For our Station Z site, we used the average Δ14C-DIC values of Stations Z1 and Z2 because the depth profiles are similar for these two stations (Figure 5b).
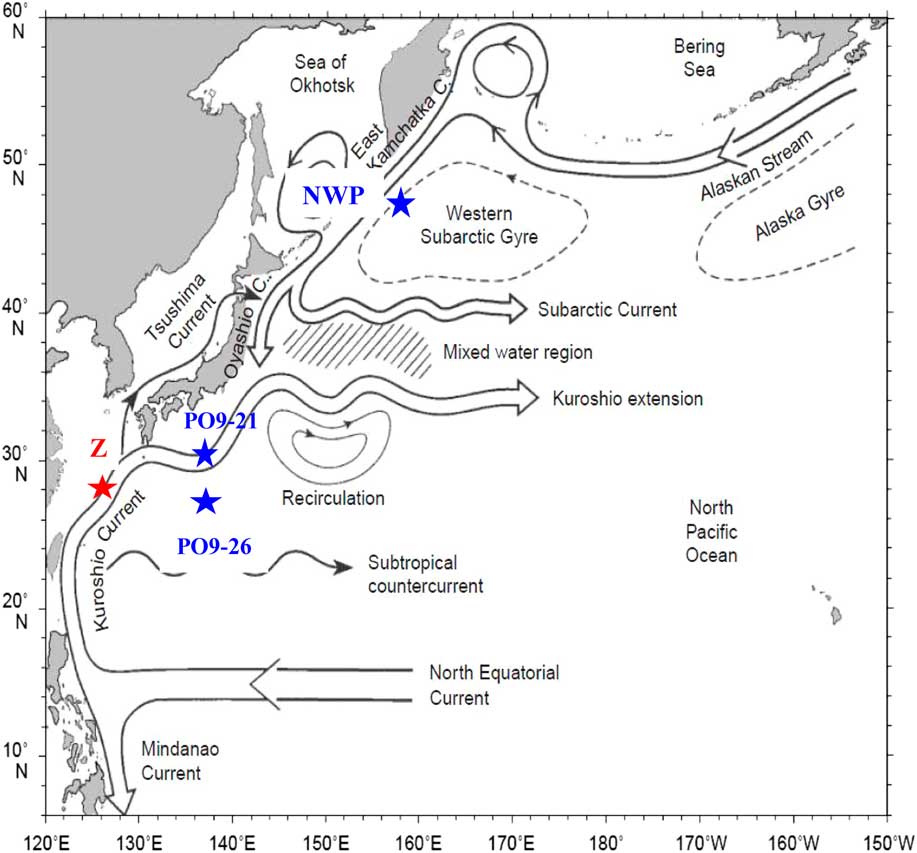
Figure 7 Map showing the major currents in the northwest Pacific and the four sites (Z, NWP, PO9-21, and PO9-26) for the comparison of ∆14C-DIC depth profiles. The map is adopted from Qiu (Reference Qiu2001). Stations PO9-21 and PO9-26 were the WOCE cruise 49RY9407 stations collected in 1994.
As shown in Figure 8, we plotted both salinity (Figure 8a) and Δ14C-DIC (Figure 8b) profiles for the stations. Significant differences exist for both salinity and Δ14C-DIC values in the top 1000 m depth at these sites. Salinity values at the NWP site were lower than the other stations in the upper 600 m depth, indicating the less-dense water mass carried by the Subarctic Current due to the observed cooling and freshening of the upper layer in the Oyashio and Sea of Okhotsk during the time (Rogachev Reference Rogachev2000; Onishi Reference Onishi2001). At Station Z, Δ14C-DIC values are about 80‰ lower than the values at Stations PO9-21 and PO9-26 in the surface 200 m, and the differences decreased with depth from 400 to 1200 m (Figure 8b). Below 1000 m, the Δ14C-DIC values are quite comparable at these sites. For the Δ14C-DIC profile at the NWP site as reported by Tanaka et al. (Reference Tanaka, Otosaka, Wakita, Amano and Togawa2010), the values are about 180‰ to 250‰ lower than the values at sites PO9-21 and PO9-26 and about 80‰ to 150‰ lower than the values at site Z in the upper 400 m. The differences also decreased with water depth, and below 1200 m, the values became similar for the sites (Figure 8b).
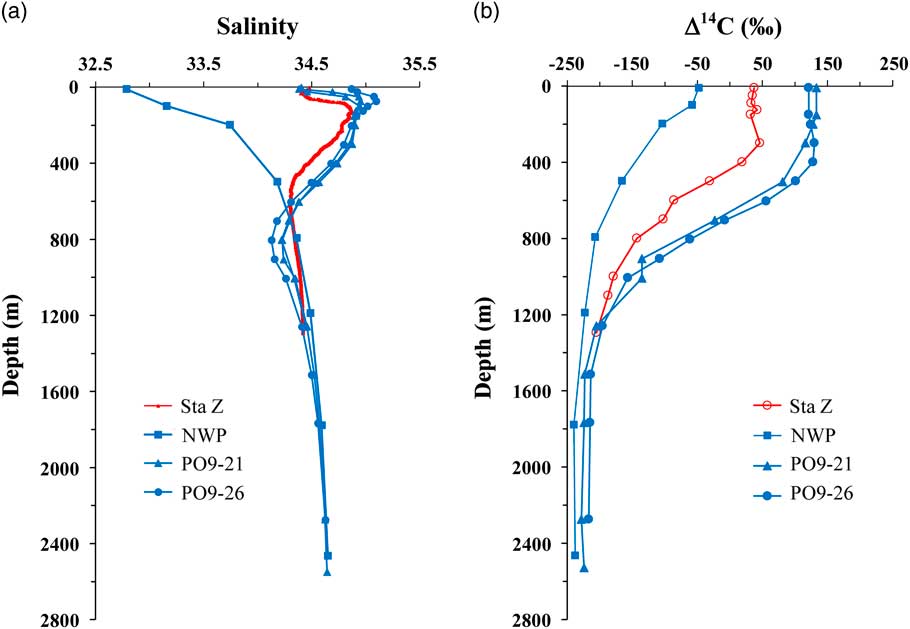
Figure 8 Depth profiles of (a) salinity and (b) ∆14C-DIC in the Z and NWP sites and two WOCE Stations PO9-21 and PO9-26. Values for Station Z are the average values of Station Z1 and Z2 (collected in 2014). Values for NWP are from Tanaka et al. (Reference Tanaka, Otosaka, Wakita, Amano and Togawa2010) and the values for WOCE Stations PO9-21 and PO9-26 (collected in 1994) are downloaded from http://cdiac.ornl.gov/ftp/oceans/p09woce/.
The differences of Δ14C-DIC values at these sites in the northwest Pacific reflect different processes affecting the Δ14C signatures of DIC. Site Z and Stations PO9-21 and PO9-26 are all within the flow path of Kuroshio as the western boundary of the North Pacific Gyre (Qiu Reference Qiu2001; Hu et al. Reference Hu, Wu, Cai, Gupta, Ganachaud, Qiu, Gordon, Lin, Chen, Hu, Wang, Wang, Sprintall, Qu, Kashino, Wang and Kessler2015). The Δ14C-DIC at these three sites therefore should have similar values. Because the samples for PO9-21 and PO9-26 were collected in 1994 during the WOCE cruise, the difference in Δ14C-DIC values at the PO9 and Z sites is likely due to the decrease of the bomb Δ14C signal in the atmosphere in the last 20 years (from 1994 to 2014) that has mixed into the upper ocean through air-sea exchange. As reported by Levin and Hesshaimer (Reference Levin and Hesshaimer2000), the decrease of Δ14CO2 in the atmosphere slowed down to about –4‰ yr–1 in 1998. If the decrease rate stayed the same in the last 20 years, then an –80‰ decrease in Δ14CO2 value would be expected today compared with 1994. This could explain the observed Δ14C-DIC differences between Station Z and the PO9 sites (Figure 8b). For the NWP site, however, the observed Δ14C-DIC differences could not be explained by changes of Δ14CO2 in the atmosphere. They reflect the different water masses in the upper 1000 m at the two sites. As shown in Figure 7, the NWP site was influenced by the Oyashio Current, which flows southward and brings subarctic water to the surface and then mixes with the Kuroshio Current flowing eastward (Qiu Reference Qiu2001; Qiu and Chen Reference Qiu and Chen2011). The subarctic water with low Δ14C-DIC values was clearly observed at the NWP site by Tanaka et al. (Reference Tanaka, Otosaka, Wakita, Amano and Togawa2010). The unchanged distributions of Δ14C-DIC in the deep depths (1200 m below) at these stations (Figure 8b) suggest that the North Pacific Intermediate Water (NPIW) is still occupied by a similar water mass as transported by its global ocean circulation (Tsunogai et al. Reference Tsunogai, Watanabe, Honda and Aramaki1995) even though some chemical properties such as dissolved oxygen and nutrients showed some temporal and special variations in the northwest Pacific in the past (Tsurushima et al. Reference Tsurushima, Nojiri, Imai and Watanabe2002; Takatani et al. Reference Takatani, Sasano, Nakano and Midorikawa2012). Currently, we are analyzing more DIC samples collected in the water mixing region of Oyashio and Kuroshio and its extension to reveal more detailed information about currents and water transport in the northwest Pacific Ocean.
SUMMARY
A modified DIC extraction method for 14C measurement by AMS is presented. The method is operationally relatively simple and shows good extraction efficiency and reproducibility. The blanks associated with the method are low and precisions for both Δ14C-DIC and δ13C-DIC measurements are good. Using the method, we report the first data set of Δ14C-DIC profiles in the shelf and slope waters of the ECS.
The depth profiles of both DIC concentration and Δ14C-DIC in the shelf and slope regions of ECS are affected by the Kuroshio. It is estimated that 54–65% of the bottom water in the shelf region could be from the intrusion of Kuroshio intermediate water, which causes the high concentrations of DIC and low values of Δ14C-DIC in the bottom water in the shelf region. As compared to the Δ14C-DIC profiles in the WOCE PO9 stations and NWP sites, it appears that the Δ14C-DIC values are largely controlled by the air-sea exchange of 14CO2 in the atmosphere and the major oceanic currents in the northwest Pacific; the large variations in Δ14C-DIC mainly occurred in the upper 800 m depth. The unchanged distributions of Δ14C-DIC in the deep depths suggests that the deep-water circulation patterns have been relatively stable in the northwest Pacific Ocean in the last 20 years.
ACKNOWLEDGMENTS
We thank the crew of the R/V Shinset Maru for the cruise opportunity and field sample collection. We appreciate the help from Drs Jinglin Ren, Huijun He, and Qian Liu during sample collections and transportation. We thank Dr Masao Ishii at Japan Meteorological Research Institute for providing the PO9 Δ14C-DIC information. We also thank the staff and colleagues at the National Ocean Science Accelerator Mass Spectrometry (NOSAMS) facility for high-precision measurements of δ13C and Δ14C of the samples. We appreciate the thorough review and comments from the two reviewers. Financial support for this work was provided by China’s National Natural Science Foundation (Grants: 41476057, 41521064 and 91428101).


