Introduction
Lepidopteran borers are food crop pests of economic significance in sub-Saharan Africa (Davis & Pedigo, Reference Davis and Pedigo1990; Cardwell et al., Reference Cardwell, Schulthess, Ndemah and Ngoko1997; Kfir, Reference Kfir and Polaszek1998). The African sugarcane stalk borer, Eldana saccharina Walker (Lepidoptera: Pyralidae), poses a great threat to commercial, emerging and small-scale sugarcane growers in South Africa, Zimbabwe, Uganda, Ethiopia, and maize and sugarcane farmers in most of the west African countries (Girling, Reference Girling1972; Conlong, Reference Conlong2001; Assefa et al., Reference Assefa, Conlong, van den Berg and Mitchell2010). Larval boring (i.e. feeding) causes direct and indirect revenue losses through stalk damage and secondary fungal stalk infections (Butterfield, Reference Butterfield2002; Goebel & Way, Reference Goebel and Way2006). Control strategies for E. saccharina include cultural practices, chemical control and biological intervention (e.g. Webster et al., Reference Webster, Maher and Conlong2006). Most recent developments include integrated pest management (IPM) programs that are followed by commercial sugarcane growers (Webster et al., Reference Webster, Maher and Conlong2006), intensive research and the implementation of area-wide IPM programs (Conlong & Rutherford, Reference Conlong, Rutherford, Peshin and Dhawan2009; Webster et al., Reference Webster, Brenchley and Conlong2009; Conlong et al., Reference Conlong, Webster and Wilkinson2016).
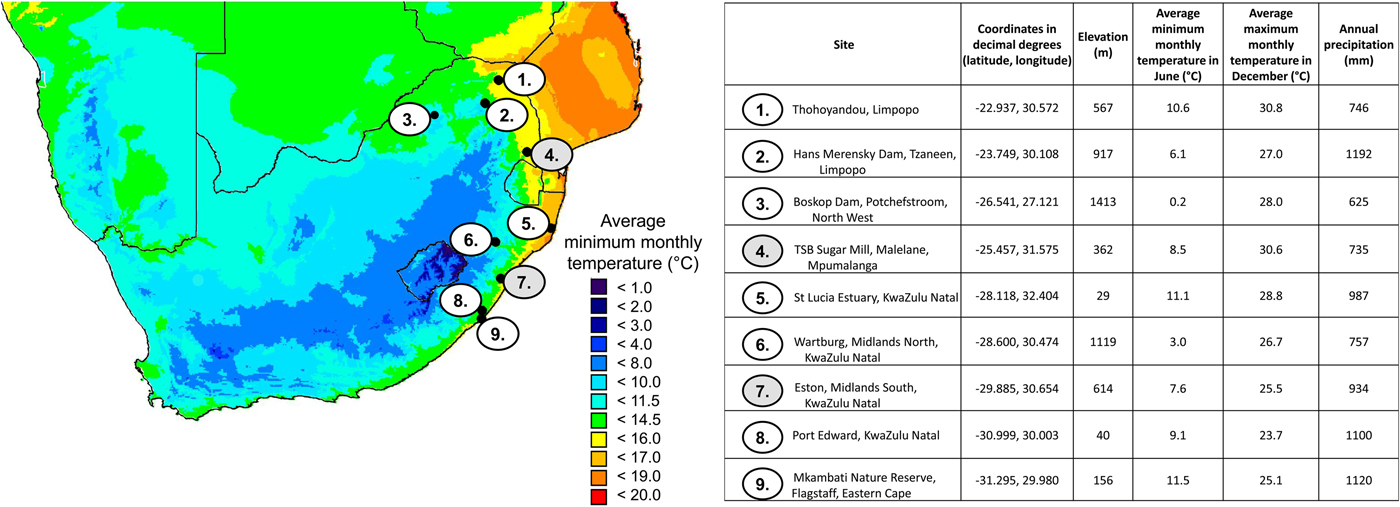
In South Africa, the first pest outbreak of E. saccharina in sugarcane occurred in 1939 on 2-year-old sugarcane (cultivar: POJ 2725) planted in the warm Umfolozi flats of KwaZulu-Natal (Dick, Reference Dick1945; Carnegie, Reference Carnegie1974; Atkinson, Reference Atkinson1980). Previous studies concluded that low winter temperatures could limit the stalk borer distribution by reducing adult reproductive performance, larval development, and survival (Dick, Reference Dick1945; Atkinson, Reference Atkinson1980; Atkinson et al., Reference Atkinson, Carnegie and Smaill1981; Way, Reference Way1994). However, since this first outbreak on the Umfolozi flats, E. saccharina has spread rapidly into areas formerly thought to be too cold for the completion of the larval life stage (Webster et al., Reference Webster, Maher and Conlong2006; Assefa et al., Reference Assefa, Conlong, van den Berg and Le Rü2008). As such, the current known geographic distribution of E. saccharina stretches across several distinct climate zones (e.g. Conlong, Reference Conlong2001; Kleynhans et al., Reference Kleynhans, Mitchell, Conlong and Terblanche2014b) beyond the coastal sugar belt to inhabit the warm sub-tropical summer climates in Thohoyandou in Limpopo (northern limit), cool winter sites in the Mkambati Nature Reserve in the Eastern Cape (southern limit) and cold winter sites with occasional frost at Boskop dam in the North-West province (western limit) (fig. 1; Conlong, Reference Conlong2001; Assefa et al., Reference Assefa, Conlong, van den Berg and Le Rü2008).

Fig. 1. Site details where Eldana saccharina has been recorded present (1, 3, 9) on the range edges of its distribution. Warm permanent site locations: 2, 4, 5 and permanent cold site locations: 6, 7, 8. The two sites used in the model are numbered 4 and 7 (shaded in grey).
Across the geographic distribution of E. saccharina, populations at different climatic locations could represent different biotypes that differ ecologically (see Conlong, Reference Conlong2001) or physiologically (Sinclair et al., Reference Sinclair, Williams and Terblanche2012). These differences might result in phenotypic (Maes, Reference Maes and Polaszek1998) and genetic differences between populations (e.g. King et al., Reference King, Conlong and Mitchell2002; Chown et al., Reference Chown, Slabber, McGeogh, Janion and Leinaas2007; Kleynhans et al., Reference Kleynhans, Mitchell, Conlong and Terblanche2014b). Frequent cold spells resulting in frost in the northern Midlands possibly limit E. saccharina presence early in the season (see table 1 in Webster et al., Reference Webster, Maher and Conlong2006, Reference Webster, Brenchley and Conlong2009), however, the species is now spreading and possibly adapting to the cooler climates of the northern and southern Midlands of KwaZulu-Natal. Indeed, there is marked phylogenetic differentiation between E. saccharina populations along geographical lines in broader Africa (Lange et al., Reference Lange, Scott, Graham, Sallam and Allsopp2004; Assefa et al., Reference Assefa, Mitchell and Conlong2006). Evidence for phenotypic variation of climate stress resistance traits of E. saccharina exists within South Africa likely due to the effects of local, fine-scale climate variation (Kleynhans et al., Reference Kleynhans, Mitchell, Conlong and Terblanche2014b) and perhaps also host plant differences (Kleynhans et al., Reference Kleynhans, Conlong and Terblanche2014a).
Table 1. Thermal constant (K) and lower developmental threshold (LDT) estimates for the different stages, obtained from Way (Reference Way1995), and estimates of the theoretical optimal temperature (T opt) for development of each life stage (following Briere et al., Reference Briere, Pracros, Le Roux and Pierre1999).
To further complicate understanding the processes facilitating the spread of E. saccharina into cooler regions of South Africa, the different life stages of this pest vary in their thermal tolerances, their ability to sustain activity in the face of climate extremes, and their capacity to overcome lethal conditions. Laboratory trials, for example, reveal stage-specific critical thermal temperatures and lower developmental thresholds (LDT) (Way, Reference Way1995; summarized in table 1). At low temperatures (11.00 °C for 14 days) larvae were completely inactive and did not feed, but, when returned to 20.00–25.00 °C they revived and continued to develop (Dick, Reference Dick1945). This suggests that larval development can be arrested, but larvae can survive a typical cold winter. While larvae appear to have a relatively low freezing point of −7.01 ± 0.30 °C (mean ± SE given throughout), their specific freeze tolerance strategy remains unstudied. Moreover, E. saccharina pupae are able to withstand laboratory temperatures down to a much colder −17.00 ± 1.80 °C before they freeze, conditions that would likely not be encountered in the field in Africa (Kleynhans et al., Reference Kleynhans, Conlong and Terblanche2014a). Given these different thermal sensitivities, the life stage that coincides with cold temperatures during winter may be the key to whether a population persists or perishes in a newly invaded, cold, location.
Here we aim to develop a better understanding of the effect of local climate on population phenology, fitness and abundance of E. saccharina in South Africa. We test the null-hypothesis that the life stage and population age structure entering a given winter determines the resulting downstream spring and summer population phenology and age structure. We apply a mechanistic (process-based) population model, following the methods described in Barton & Terblanche (Reference Barton and Terblanche2014), to predict population abundance and performance at two geographic locations currently occupied by E. saccharina: a warm site (−25.46S, 31.57E decimal degrees given throughout; average minimum temperature of the coldest month (July) = 8.50 °C; average annual temperature = 21.60 °C) and a cold site (fig. 1; −29.91S, 30.63E; average minimum temperature of the coldest month = 7.60 °C; average annual temperature = 17.00 °C) (Hijmans et al., Reference Hijmans, Cameron, Parra, Jones and Jarvis2005 calculated 50 year (1950–2000) averages). The two sites were chosen to represent a typical warm and cold site in the current thermal range of E. saccharina, at least within South Africa (fig. 1). More specifically, stage-specific developmental rates and critical temperature thresholds were integrated with hourly temperature data to predict how seasonal fluctuations in thermal conditions at the two study sites may affect E. saccharina phenology, and quantify thermal stress, survival, population turnover, relative abundance and fecundity. In addition to modelling the outcomes at the two climatically-distinct geographic locations, we consider two separate freeze-intolerant overwintering life stage scenarios (larvae vs. pupae). This is due to field scouting data revealing the presence of both life stages in the sugarcane at the two study sites during mid-winter but it remains unclear if this would significantly influence downstream population dynamics the following spring of summer season. Additionally, thermal thresholds estimated by Way (Reference Way1995), which may overestimate actual values because they are estimated from a linear model, for all life stages are below average winter temperatures (in July). Together with lower freezing points, this suggests that larval and pupal stages of E. saccharina can theoretically survive and develop throughout the year in all regions. The biological and population implications of overwintering stage however remain unstudied.
Materials and methods
Input climate data
A process-based, deterministic population model (see Barton & Terblanche, Reference Barton and Terblanche2014) was applied to high resolution time-series climate data for two point locations in South Africa, where E. saccharina is currently found in sugarcane: a warm site near Malelane in the province of Mpumalanga and a cold site near Eston in the province of KwaZulu-Natal. Daily maximum, minimum and average temperatures were compared for the period 1 July 2013–31 July 2014. For each site, hourly temperature fluctuations were interpolated from measurements of daily average minimum and maximum temperatures with a sinusoidal wave according to the equation in Campbell & Norman (Reference Campbell and Norman1998). Daily temperature records were obtained from the SASRI Weather Data Acquisition and Processing System (WeatherWeb). Data for the warm site in Mpumalanga was collected at Mhlati (station number 465: 25.467S, 31.517E) at 301 m above sea level. Data for the cold site in KwaZulu Natal was collected at Hayfields (station number 458: 29.867S, 30.517E) at 785 m above sea level. The SASRI weather station is within a 6 km radius from the scouted sugarcane fields at the warm site and within a 15 km radius from the scouted sugarcane fields at the cold site. We assumed that the body temperatures (T b) for E. saccharina life stages were equal to ambient temperature for the purpose of modelling the population responses throughout the season, i.e. the thermal effects of radiation, metabolism and evaporation on body temperatures of this species were assumed to be negligible (see Watt, Reference Watt1968; Kingsolver & Moffat, Reference Kingsolver and Moffat1982; see Supplementary information). Microsite temperatures did not differ significantly from that recorded by the weather station (see Supplementary information).
Physiological and life history traits and model parameters
Physiological data of each life history stage were called into the model while it was stepping through the temperature data. Thermal constants and LDT for the life history stages were obtained from work published by Way (Reference Way1995). A Briere model (i.e. quadratic temperature-dependent equation) was used to estimate a theoretical optimal temperature for each life stage (Briere et al., Reference Briere, Pracros, Le Roux and Pierre1999). The input parameters for the model are given in table 1. These parameters remained constant for each model iteration.
During the larval phase, E. saccharina transitioned through 5–8 instars, depending on their diet and gender (Waiyaki, Reference Waiyaki1968; Girling, Reference Girling1978; Atkinson, Reference Atkinson1980). We modelled a seven-instar larval life stage, which corresponds to findings by Atkinson (Reference Atkinson1980), and the age-related head capsule size studies completed by Way (Reference Way1995). The temperature-dependent rates of egg-production were also obtained from Way's (Reference Way1995) work and corresponded to 205, 417, 432 and 183 eggs at 15, 20, 25 and 30 °C, respectively. These egg counts were however more conservative than those published recently by Walton & Conlong (Reference Walton and Conlong2016) but sufficient to explore the potential impact of temperature on population dynamics.
Model setup and simulations
For each geographic location, we ran two model simulations to explore the outcomes of overwintering as either pupae, or larvae. We set the model to commence on 1 July 2013 with accumulated DD units set to 624.0 and 160.3 for larvae and pupae overwintering scenarios, respectively (table 1). At each hourly time step, the model calculated the number of degree-day (DD) units obtained according to the ambient temperature above the LDT temperature for each particular life stage (Way, Reference Way1995). Thus, as the model progressed through the simulation period, DD units were allowed to accumulate until the threshold DD (for that particular stage) was reached, at which point the model transitioned into the next life stage. Once the adult stage was reached (see Feng et al., Reference Feng, Gould, Huang, Jiang and Wu2010), the model remained as an adult for 14 days, after which it transitioned back to an egg, the accumulated DD total was reset to zero, and an additional generation was tallied (Barton & Terblanche, Reference Barton and Terblanche2014).
For each modelling scenario, estimates of phenology and fitness were subsequently tracked throughout the 365-day simulation period. Model output parameters included: the number of generations per year (and showing the life stage transitions throughout the season), number of stress hours encountered through each life stage and for the season, relative fitness of adult moths, relative adult abundance and female fecundity. Parameters were compared between sites and overwintering life stage. Briefly, for each hour, DD were calculated where temperatures did not exceed 35.00 °C or dropped below the LDT. Stress-hours were calculated as the total number of hours during which Tb dropped below an arbitrary stress-inducing cold temperature set to 2.00 °C below the LDT (cold stress) or rose above 35.00 °C (heat stress). The thermal safety margin (TSM = T opt − T b, where T opt is the stage-specific optimum temperature for development), listed in table 1 were calculated for each hour. Relative population fitness was calculated for emerging adult moths, based on the average developmental TSM, where relative fitness = 1/TSM, so adults that had developmental periods closest to the optimum were assumed to be the fittest. The relative abundance was calculated as the total number of adult female emergences over the previous 14 day period, assuming female moths survive for 9 days in total, multiplied by the relative fitness at that hour. Female fecundity predictions were estimated based on a linear model of the relationship between temperature and egg-production (see above for data). The number of reproducing 2-day old adult moths on each day were determined, and then multiplied by the potential number of eggs laid during that hour, depending on the T b, and the temperature-dependent function for egg production. All modelling simulations and validations were performed in R (R Development Core Team, Reference Robin, Turck, Hainard, Tiberti, Lisacek, Sanchez and Müller2010; v. 3.1, R Foundation for Statistical Computing, Vienna, Austria).
Model output validations
Model predictions were validated against weekly-obtained scout records (expressed as a % larvae (all instars included) scouted per 100 stalks) obtained from 29 sugarcane fields (>3 ha average, 16 different cultivars) in and around the Eston weather station, and >400 sugarcane fields (>8 ha average, 7–19 month old sugarcane, 14 different cultivars) in and around the Malelane weather station. We used predictions of life stage transition and stress (cold and heat) at the Eston site with a larval overwintering stage scenario, because scouted larval numbers returned high in-field infection during the initial winter months of this particular season. Scout records were obtained from the South African Sugarcane Research Institutes’ extension specialist in the Midlands South region of KwaZulu-Natal, and the Lowveld Pest, Disease and Variety control specialist in the Malelane area. Surveys for E. saccharina larvae are done by Pest and Disease survey teams that pluck 100 stalks at random from a <10 ha sugarcane field. The stalks are sliced in half, lengthwise, and the number of larvae found are expressed as a percentage infestation, i.e. indication of larval relative abundance; and damage as percentage internodes bored, i.e. the total number of internodes damaged in the stalk, divided into the total number of internodes on the stalk multiplied by 100. The field age and cultivar were always recorded. The cultivars included in the scout records obtained from the field specialists were amongst others the high risk varieties: N16, N28, N31, N35, N36, N37, N40, N45, N47, N48, N49, N50, N52, and low risk varieties: N12, N39, N41 (Leslie, Reference Leslie and Leslie2013). The sugarcane ages at fields where scouting was done ranged between 7 and 31 months.
Statistical analyses
All statistical analyses were performed in R (v. 3.1, R Foundation for Statistical Computing, Vienna, Austria; Packages ‘MASS’ and ‘car’). A comparison of maximum, minimum and average daily temperatures was made between the geographic locations using the Wilcoxon–Mann–Whitney rank sum test as data were not normally distributed. The effect of geographic location and overwintering life stage on the number of generations, cold- and heat-stress hours is compared, with Poisson distribution of errors and log link function, while fecundity, relative moth abundance and fitness were compared, with Gaussian distribution of errors and identity link function, in generalized linear models. The models were corrected for over-dispersion by square root transformation of count data (quasi- family distribution of errors did not stabilize the variance in the data) and log transformation of continuous data. The models were checked for over-dispersion by inspection of residual deviance and degrees of freedom (following Crawley, Reference Crawley2007). The model predictions were validated against scout records of larval abundance using an area-under-the-curve (AUC) function that calculates the area under the response operating characteristic (ROC) curve (following Mason & Graham, Reference Mason and Graham2002 with the pROC package). The P-value obtained from the AUC function is related to the Mann–Whitney U statistic that addresses the null hypothesis stating that the area under the ROC curve is 0.5 i.e. the model prediction has no relevance to actual observations. Values statistically >0.5 are considered to be models better than random.
Results
Population responses were modelled at two geographic sites, initiated from a larval or pupal overwintering life stage. Statistical analyses of the daily maximum, minimum and average temperature verified that the Malelane site (22.34 ± 0.15 °C) was significantly warmer than the Eston site (18.60 ± 0.16 °C) (Wilcoxon rank sum test, W = 84,540, P < 0.0001). Daily maximum temperatures were significantly higher at Malelane than at Eston (29.57 ± 0.18 °C vs. 24.45 ± 0.22 °C respectively) and daily minimum temperatures were significantly lower at Eston than at Malelane (12.75 ± 0.15 °C vs. 15.11 ± 0.20 °C, respectively). Variation in ambient temperatures between the two sites resulted in significant differences in the predicted fitness traits of E. saccharina as described below.
The number of predicted generations completed for E. saccharina across the season was higher at the warm site than at the cold site (fig. 2a, b). Three complete generations were predicted at the warm site, irrespective of the life stage (larval or pupal) overwintering, while at the cold site larval overwintering resulted in a single generation during the season and pupal overwintering resulted in two complete generations (fig. 2a, b). The interaction effect between the site and overwintering life stage on the number of generations completed was significant (table 2), reflected by an additional generation following pupal overwintering at the cold site (fig. 2a, b). At the warm site (fig. 2c, d), overwintering stage had no impact on the timing of life history transitions; adult moths were predicted to appear earlier in Spring, and be present in October, January and March–April (fig. 2c, d) irrespective of overwintering stage. At the cold site adult moth abundance peaks were predicted in January following larval overwintering (fig. 2c) and in December, as well as March following pupal overwintering (fig. 2d). Overwintering larvae were, however, exposed to increased cold and heat stress at the cold site, in comparison with the warm site (fig. 3a, b). Ultimately, larval overwintering in the cold site reduced adult moth abundance, probably through an increased amount of thermal stress hours experienced in the field during the larval life stage.
Fig. 2. The impact of local climate and overwintering stage on the number of generations (a, b) completed and life stage transition (c, d) predictions for E. saccharina in a warm (Malelane) and cold (Eston) climate. Model predictions were based on a larval (a, c) and pupal overwintering stage (b, d) and projected the dates of life stage transition or generation turn-over through time. In (c, d), ‘L’ on the y-axis represents larval instar stage (L1 = first instar larva).

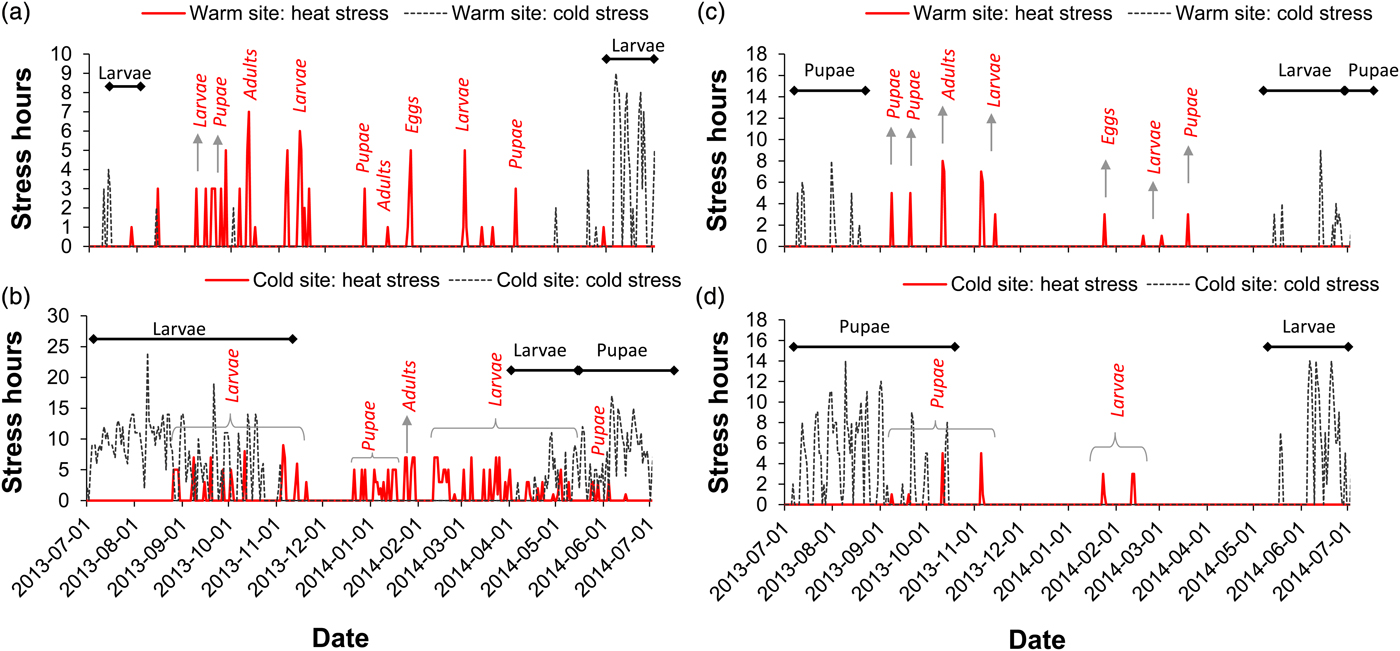
Fig. 3. The impact of local climate and overwintering stage on the number of stress hours per day for the specific life life history stages during the model simulation. Model outcomes were based on larval (a, b) and pupal (c, d) overwintering stages at a warm site and a cold site in South Africa. Horizontal bars denote the duration and life stage that experienced cold stress, while curly brackets and arrows show the heat stressed life stages throughout the season.
Table 2. Summary results from a generalized linear model testing the effects of warm or cold climate (site).
TSM, thermal safety margin.
Overwintering life stage (overwinter stage), which was pupae or larvae, particular life stage, which includes eggs, seven larval stages, pupae and adults (life stage) tested where applicable on the number of generations, cold- and heat-stress hours (Poisson distribution of errors and log link function), relative adult abundance, fecundity and relative fitness (Gaussian distribution of errors and identity link function). Interaction effects are presented with × and the degrees of freedom (d.f.), chi-square (χ 2) statistic, corresponding P-value are shown. Significant effects are shown in bold.
The accumulated number of cold and heat stress hours depended on overwintering stage, climate (site) and stage sensitivity (table 2). In general, the larval life stage experienced more stress in a cold environment following larval overwintering in comparison with a warm site and pupal overwintering (fig. 3a, b). For example, the first and second instar larvae experienced the highest amount of cold stress hours when the larval life stage overwintered at the cold site, followed by pupae then the third instar larva. In contrast, when pupae overwintered at the cold site, the final larval instar experienced the highest amount of cold stress, perhaps partly owing to its relatively high LDT (table 1). Interestingly, adult moths experienced the highest amount of heat stress when larvae overwintered at the cold site, while pupae experienced more stress hours (both heat and cold stress) at a cold site following larval overwintering, than in a warm site (fig. 3a, b). As expected, for pupal overwintering, all E. saccharina stages experienced a higher incidence of heat stress at the warm site in comparison with the cold site, and more cold stress at the cold site in comparison with the warm site (fig. 3c, d). Given the relatively cold LDT of E. saccharina eggs (table 1), this life history stage did not experience any hours of cold stress at either site, however during the height of summer, several hours of heat stress at the warm site were endured, irrespective of overwintering stage (fig. 3).
Relative population fitness and relative adult abundance are direct results of these population stress-predictions, and as such varied accordingly. The relative fitness of E. saccharina life stages was significantly affected by the climate of the two sites (table 2) such that relative fitness was higher at the warm site in comparison with the cold site (fig. 4a, b). The interaction effect between site and the overwintering stage on relative moth fitness was also significant, whereby fitness at the cold site was higher with pupal-overwintering in comparison with larval-overwintering. Relative moth abundance predictions for E. saccharina were also significantly affected by site, with higher abundance predicted at the warmer site (table 2, fig. 4c, d). Female fecundity (number of eggs laid per female per hour) was significantly affected by the overwintering life stage and the site (table 2), so that reproduction and/or egg laying commenced sooner at the warm site than at the cold site. Estimates of fecundity showed the first spikes during November at the cold site following pupal overwintering in comparison with January (42 days later) following larval overwintering. This lag effect between the overwintering stages resulted in 13, 552 more eggs being produced at the cold site following pupal overwintering vs. larval overwintering.
Fig. 4. The impact of local climate and overwintering stage on adult moth fitness (a, b) and relative adult abundance (c, d). Model predictions were based on a larval (a, c) and pupal (b, d) overwintering stage.
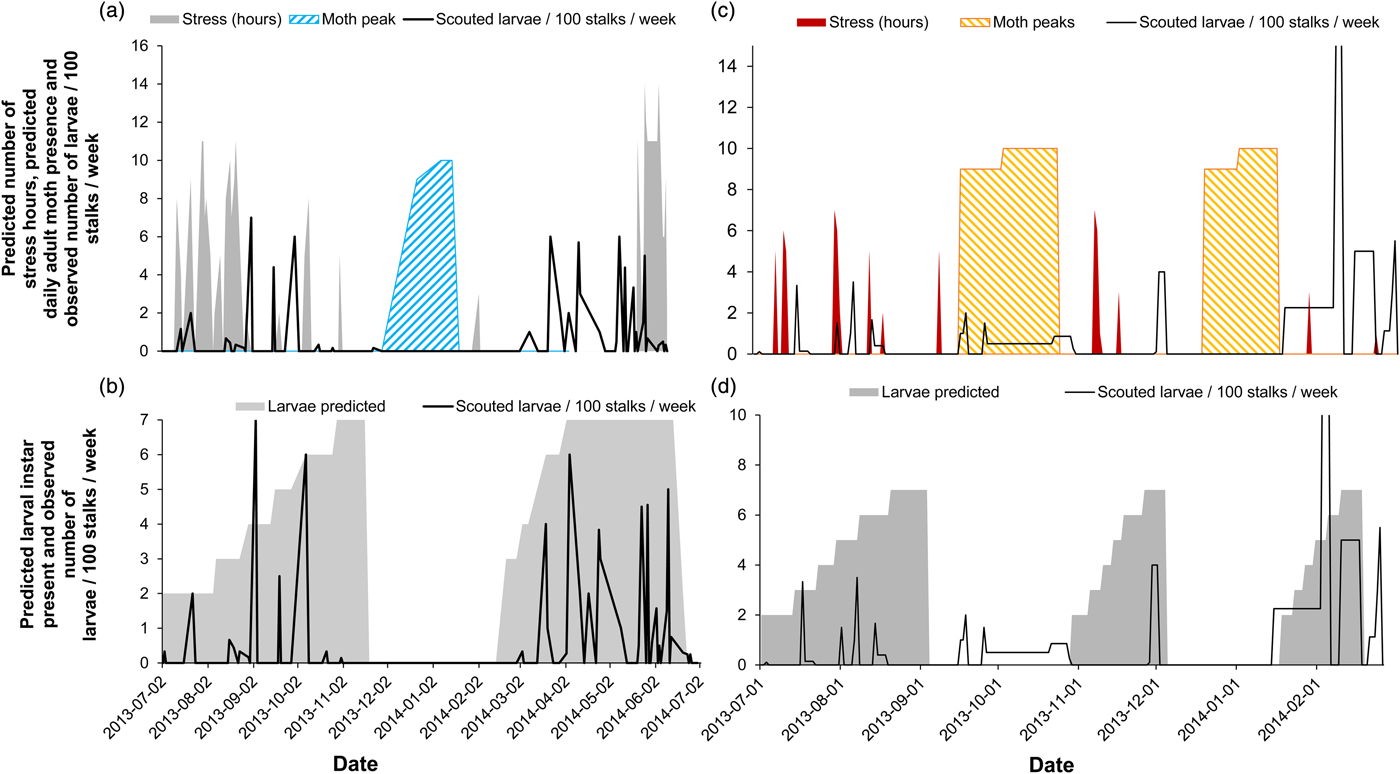
The availability of year-round in-field scout records enabled the verification of temporal model predictions. Here, model predictions for insect stress hours were plotted against scout records (expressed as average % larvae) in the field. We used larval overwintering model predictions for these validations because the larval scout data during winter revealed larval presence in the field from both model sites. Larval incidence was highest when the model predictions for insect stress in the environment were lowest and vice versa (Fig. 5a, c, cold stress: GLZ: χ 2 = 3740.20, d.f. = 9, P < 0.001; heat stress: GLZ: χ 2 = 273.51, d.f. = 9, P < 0.001). Furthermore, predictions for the adult stage corresponded with notable absences of larval observations in the scout records (fig. 5a), possibly further explaining population demographics observed at the cold site and during the second moth peak at the warm site. In summary, larval presence, according to the biophysical model, overlapped well with positive scout records averaged across a matrix of sugarcane field ages and cultivars (fig. 5b, d). The AUC calculation resulted in a significant model ability to predict the observed outcomes (cold site AUC = 0.76 ± 0.127 c.i. and P = 0.003; warm site AUC = 0.63 ± 0.132 c.i. and P = 0.031). At the cold site, the model performed better in predicting larval presence and absence (overall performance = 67.39% accurate; false positive rate = 38.89%, false negative rate = 10.00%) than at the warm site (overall performance = 62.26% accurate; false positive rate = 44.83%, false negative rate = 29.17%).

Fig. 5. Predicted thermal stress index (hours) and timing of the adult life stage (moth peaks) compared with weekly obtained scout records (expressed as the number of larvae per 100 stalks per week) for a cold site (a) and a warm site (c) and the predicted larval instars over time (tallied for a larval overwintering life stage) compared with obtained scout records at the two sites (b, d).
Discussion
Modern IPM programs rely heavily on understanding the pest phenology in order to develop predictive tools to plan timely, cost-effective interventions, especially with biological control. Here we aimed to develop a better understanding of the effect of local climate on E. saccharina population phenology and fitness, since it is clear that temperature, through its effect on insect life-cycle duration, forms a critical part of any control program. For many tropical species that live at environmental temperatures close to their optimal performance temperatures, their relative fitness is expected to decrease with mild warming. In contrast, for species that occupy high-latitudes or altitudes have environmental temperatures far cooler than optimal, such that climate warming may enhance fitness (Deutsch et al., Reference Deutsch, Tewksbury, Huey, Sheldon, Ghalambor, Haak and Martin2008). The latter may be the case for E. saccharina, at least for the populations considered here. From the results obtained, different climatic locations affected different fitness traits that had significant outcomes ecologically (see also Conlong, Reference Conlong2001). We provide support for adult moth abundance variation across geographic sites that depend on the overwintering life stage and local climatic conditions. We specifically show that overwintering larvae resulted in a reduced adult moth occurrence in the field. Three generations were completed at a warm site. At a cold site one generation were completed and more frequent cold and heat stress were observed when larvae overwintered here in comparison with pupae overwintering. Relative population fitness and abundance did not differ between the overwintering stages, however fitness and the resulting abundance was significantly lower at the cold site. In the context of Sterile Insect Technique (SIT) as part of an area-wide IPM control approach for E. saccharina (Conlong & Rutherford, Reference Conlong, Rutherford, Peshin and Dhawan2009), the data generated from this model indicate that field releases of sterile moths in warm sites can be performed at the start of the first moth peak of the season, i.e. July–September, to bring down the peak predicted to occur during October, irrespective of overwintering life stage. In cold sites, however, these results suggest that releases should be delayed by approximately 1 month when the pupal stages are most abundant during winter-month scouting.
The model predictions of life stage timing and abundance were compared with a large in-field scout dataset. Here the model performed relatively well. For example, the number of predicted stress hours was high, or the model projected an adult life stage, which is unable to be surveyed or sampled in the scout data, during the times when larval scout data were zero. Model predictions for larval presence overlapped well with positive scout records averaged across a matrix of sugarcane ages and cultivars. Furthermore, earlier light trapping work showed that adult moth phenological cycles showed a definite September peak although with low moth numbers (Carnegie & Leslie, Reference Carnegie and Leslie1990), larger adult numbers peaked during November–December and March–May (Atkinson, Reference Atkinson1982) and, specifically, in April (Carnegie & Leslie, Reference Carnegie and Leslie1990). Here, the model predictions, for both sites and overwintering stages, correspond well to these findings. Finally, definite low adult moth abundance was recorded by Atkinson (Reference Atkinson1982) and Carnegie & Leslie (Reference Carnegie and Leslie1990) during June–July, which the model reflected through an incomplete pupal period over these months. To conclude, the model corresponded well with adult moth peak events on the calendar (or Julian days), and larval abundance predictions were verified by on-farm scouting practices. In a broader context, these results hold important implications for field releases of SIT moths in different areas (Potgieter et al., Reference Potgieter, van Vuuren and Conlong2013, Reference Potgieter, van Vuuren and Conlong2016), and or biological control agents targeting different larval instar ages and/or pupae (Conlong, Reference Conlong1990, Reference Conlong1994). These results can also be used to better predict the timing of insecticide applications targeting specific stages in the E. saccharina life cycle (Leslie et al., Reference Leslie, Stranack and De Haas2006) and perhaps aid in understanding fitness cost in insecticide-resistant strains of insect pests, for example, diamond back moth (Plutella xylostella (Linnaeus) (Lepidoptera: Plutellidae)) when experiencing thermal stress (Zhang et al., Reference Zhang, Jing, Li, Li, Bourquet and Wu2015). The application of this biophysical model can inform growers and pest management advisory staff to ensure accurate and timely management actions against this pest in the field.
Mechanistic (process-based) population modelling enables scenario-driven hypothesis testing. Here the overwintering life stage significantly affected the generation time in the cold, but not hot regions. In other words, the population's age structure at the end of a previous season, partly determines the population's phenology, age- and stage-structure of the following season. Warm climates are more stable and temperatures fluctuated closer to the thermal optimum of the insects, resulting in fewer stress hours experienced, in terms of both magnitude and frequency. Stress (i.e. sustained sub- or super-optimal temperatures), in turn, resulted in changes in overall population abundance and estimated fitness. We showed that larvae experienced more stress in a cold environment following larval overwintering in comparison with a warm site and pupal overwintering. This suggests that, in cold environments, there might be consistent selective pressure for E. saccharina to develop greater cold resistance (e.g. seasonal acclimatization or genetic adaptation over the long term) during the larval stage or complete the final larval instar sooner in order to pupate and overwinter in this stage. Indeed, running model simulations across multiple seasons might alter the life history stage within which overwintering occurs. The model predicts that overwintering as pupae confers higher adult occurrence, increased generation number and reduced thermal stress. Microclimate temperature recordings at different locations relative to the sugarcane stalk showed that there was a significant interaction effect between season and location (GLZ: χ 2 = 7.30, d.f. = 2, P = 0.03). In the winter, average temperatures recorded inside the sugarcane stalk were significantly cooler (16.32 ± 0.15 °C) than the base of the stalk (16.61 ± 0.10 °C) (see Supplementary information). Larvae can ‘seek out’ slightly warmer microsites by boring into the stalks during winter. Leaf sheaths – where adult moths and eggs are typically found – were warmer than the insides of the stalks but this difference was not significant during the winter months.
Further studies exploring where, and when, pupal overwintering occurs in the field would provide useful insights into E. saccharina’s physiology in its new and native ranges, and may help to forecast a population's potential for crop damage at a given location. For example, the detection of large numbers of overwintering pupae may serve as an early warning signal for more intense pest management practise in anticipation of relatively high adult performance in the following summer generations (as predicted here by the model).
The results obtained in this study are dependent on the incorporation of stage-specific trait data. This is not typically done for species abundance models, and the procedure outlined here is relatively novel, even to pest modelling literature. There are however limitations to the model as it currently stands. For example, here we modelled a single season to focus primarily on the effects of local climate and overwintering life stage on the model predictions. When more than one season's phenological and abundance responses are captured, it will likely sketch a better picture about the long-term stressors that work on the species in a particular environment. From a broader point of view, sophisticated models that have been developed to predict the outcomes of IPM intervention (Potgieter et al., Reference Potgieter, van Vuuren and Conlong2012, Reference Potgieter, van Vuuren and Conlong2013, Reference Potgieter, van Vuuren and Conlong2016) provide excellent insight into temporal population responses in the light of future pest management plans. Nevertheless, the mechanism-based model applied in this study provided novel insights into the effect of newly-invaded cold climates on E. saccharina survival and adult relative abundance. These results, in addition to many other observations concluding that E. saccharina will spread into novel areas, provide strong evidence for complete generation turnover and population fitness in cold climates. The model assumes (or rather constrains) overwintering larvae or pupae and hence does not allow for multiple overwintering stages, which might further advance adaptation to unpredictable climate.
Higher population turnover associated with warmer climates involve higher pest abundance and crop damage under regional global warming changes in climate. Locomotion performance, adult size, body mass, fecundity, growth rate and development time are temperature dependent and affect insect field fitness (Angilletta et al., Reference Angilletta, Niewiarowski and Navas2002; Terblanche et al., Reference Terblanche, Klok, Krafsur and Chown2006; Kingsolver & Huey, Reference Kingsolver and Huey2008). The planned SIT program against E. saccharina in the sugarcane industry (Conlong & Rutherford, Reference Conlong, Rutherford, Peshin and Dhawan2009) will, for example, benefit from the use of this model, as already explained. However, to obtain maximum effect with minimum costs, sterile male moth releases should be conducted when the natural population of moths are low and in the initial stage of moth peak as mating ratios and released moth performance are critical aspects of SIT success (Chidawanyika & Terblanche, Reference Chidawanyika and Terblanche2011; Sørensen et al., Reference Sørensen, Addison and Terblanche2013; Terblanche, Reference Terblanche2014). In this way, sterile-male mating will optimize sterile egg production during the wild moth's peak so that the effect on the population is maximised towards reproductive suppression. Higher average temperatures might reduce the number of cold stress events (e.g. freeze thaw cycles), accelerate the development times and lead to range expansion into areas that are currently too cold for E. saccharina persistence. Management strategies should be tailored according to local climates, especially in areas where multiple generations are expected to occur and also in areas where the pest might expand its range.
The results also provide valuable insights into the management of E. saccharina in commercially grown sugarcane. Adult scouting practices could benefit from the model predictions in validation and forecasts. It would be valuable to verify the model predictions on adult moth abundance once such a scouting method has been developed. The predicted output parameters are directly relevant and interpretable to the general sugarcane grower in the specific site locations. It furthermore holds significance to the broader sugarcane industry through added insight into the effect of local climate and overwintering stage on E. saccharina population abundance. This work should aid in decision making when area-wide IPM strategies are employed in the field.
Supplementary material
The supplementary material for this article can be found at https://doi.org/10.1017/S0007485317000712
Acknowledgements
The authors thank Karlien Trumpelmann, Tom Webster, Nelson Muthusamy and Angela Walton for providing us with logistical and in-field support, and the referee's comments on an earlier version. Financial support was provided by the South African Sugarcane Research Institute, HortGro Science, Claude Leon Foundation, the Centre for Invasion Biology, Stellenbosch University and the National Research Foundation Incentive Funding for Rated Researchers.